


To View the Stream
Results
Running the Simulation
You have now entered the data and specifications for this simulation.
1Click OK to run the simulation.
The Control Panel allows you to monitor and interact with the Aspen Plus simulations calculations.
As Aspen Plus performs the simulation, status messages display in the Control Panel.
GENANAL is defined as having 20 constituents. If you only use a portion of the constituents available in GENANAL, Aspen Plus generates a warning. Since you need only one element in GENANAL for this simulation, ignore this warning. The remainder of the simulation completes without warnings or errors.
When the calculations finish, the message Results Available appears in the status area at the bottom right of the main window.
2Use the vertical scrollbar to see the messages.
3Examine the results of your run.
Examining Results
1From the Control Panel, click  .
.
The Results Summary | Run Status | Summary sheet appears, indicating that the simulation completed normally.
2Click  to move to the next sheet with results.
The Results Summary | Streams | Material sheet appears.
3Review the results on this sheet.
Note: Since this is a scrolling sheet, use the scrollbars to review results that are off the screen.
4In the Display field, select Streams.
5At the top of the blank column of results, click  and select ACETONE. In subsequent columns, select TO-CCD, WASHH2O, WASH-OUT, and SLURRY.
6Evaluate the performance of the hydrocyclone by comparing its outlet streams: ACETONE and TO-CCD.
5-22 • Modeling Polymer Recovery |
Getting Started - Solids |
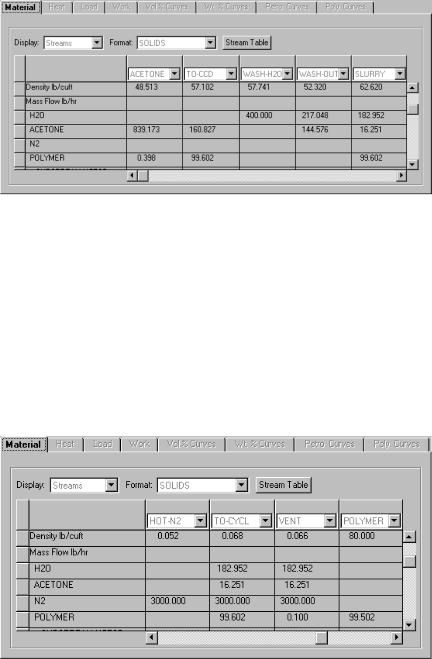
Most of the acetone and very little of the polymer are in stream ACETONE. The hydrocyclone has substantially concentrated the dilute slurry of polymer in acetone to feed to the CCD.
7Evaluate the performance of the countercurrent decanter by comparing streams TO-CCD, WASH-OUT, and SLURRY.
Most of the acetone in TO-CCD is removed by the wash water. Stream SLURRY contains polymer in a water rich environment. Note that stream WASH-OUT contains no polymer.
8After the SLURRY column, click  and select the following streams HOT-N2, TO-CYCL, VENT, and POLYMER.
The DRIER block operates by mixing streams SLURRY and HOT-N2. There is enough hot nitrogen to adiabatically evaporate all of the liquid in stream SLURRY (VFrac + SFrac =1 in stream TO-CYCL).
The CYCLONE block separates the solid polymer from the gas. Because the Cyclone model neglects the interstitial flow of gas in the separated solids, stream POLYMER has no flow of H2O, ACETONE, or N2.
9 Close the Data Browser window and the Control Panel.
Getting Started - Solids |
Modeling Polymer Recovery • 5-23 |
To View the Block
Results
1In the Process Flowsheet window, right-click the CCD block. From the shortcut menu, select Results.
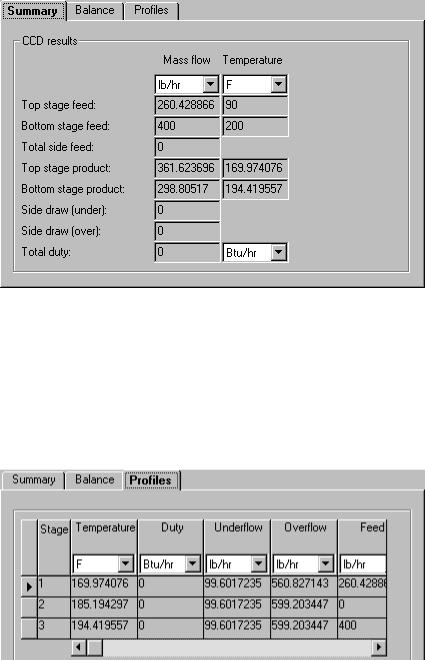
The CCD | Results | Summary sheet appears. This sheet displays summary flow and temperature information for the first and last stages.
2Click  to move to the next sheet with results.
The CCD | Results | Balance sheet appears. This sheet displays the overall mass and energy balance for the block.
3Click  to move to the next sheet with results.
The CCD | Results | Profiles sheet appears. This sheet displays the temperature, duty, underflow, and overflow for each stage of the CCD.
4 Close the Data Browser window.
5-24 • Modeling Polymer Recovery |
Getting Started - Solids |
5In the Process Flowsheet window, right-click the CYCLONE block. From the shortcut menu, select Results.
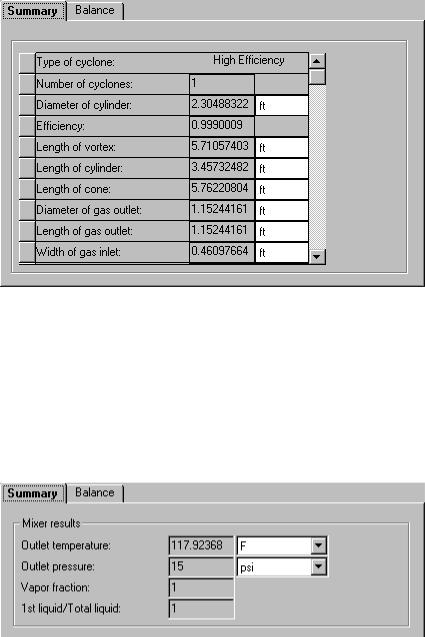
The CYCLONE | Results | Summary sheet appears. This sheet displays the calculated geometry for the cyclone.
6Click  to move to the next sheet with results.
The CYCLONE | Results | Balance sheet appears. This sheet displays the overall mass and energy balance for the block.
7Close the Data Browser window.
8In the Process Flowsheet window, right-click the DRIER block. From the shortcut menu, select Results.
The DRIER | Results | Summary sheet appears. This sheet displays the outlet thermodynamic conditions for the block.
9Click  to move to the next sheet with results.
The DRIER | Results | Balance sheet appears. This sheet displays the overall mass and energy balance for the block.
10Close the Data Browser window.
Getting Started - Solids |
Modeling Polymer Recovery • 5-25 |