

To View the Stream
Results
Running the Simulation
The Required Input Complete dialog box appears.
1Click OK to run the simulation.
The Control Panel allows you to monitor and interact with the Aspen Plus simulations calculations.
As Aspen Plus performs the simulation, status messages display in the Control Panel.
Aspen Plus reports four warnings while processing input specifications. Ignore these warnings, which are the same warnings that were generated in Simulation 2.
No further warnings are generated.
When the calculations finish, the message Results Available appears in the status area at the bottom right of the main window.
2Use the vertical scrollbar to see the messages.
3Examine the results of your run.
Examining Results
1From the Control Panel, click  .
.
The Results Summary | Run Status | Summary sheet appears, indicating that the simulation completed normally.
2Click  to access the next results sheet.
The Results Summary | Streams | Material sheet appears.
3Review the results on this sheet. Use the horizontal and vertical scrollbars to review results that are off the screen.
4In the Display field, click  and select Streams.
5At the top of each column, click  and select COOLPROD, CYC-SOL, FILT-SOL, ESP-SOL, and ESP-GAS.
4-12 • Modeling Gas-Solid Separators |
Getting Started - Solids |
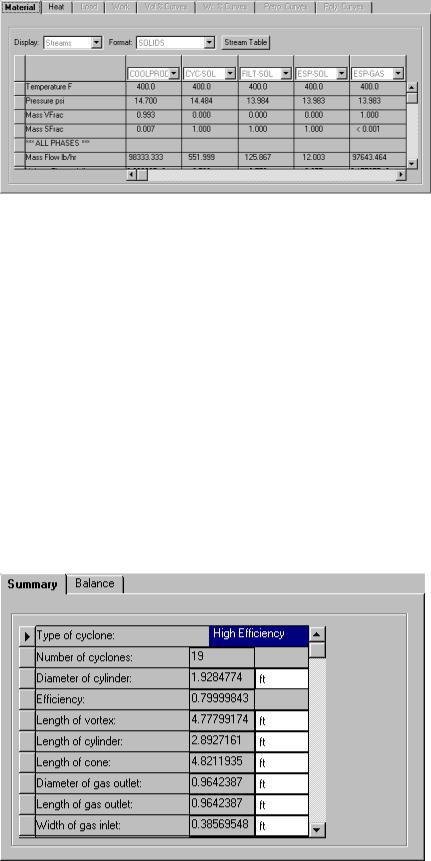
Compare the mass flow rate of ash in the streams. The cyclone removes 80% of the ash in COOLPROD. The fabric filter removes 91% of the ash not captured by the cyclone. Finally, the electrostatic precipitator captures virtually all of the remaining ash.
Compare the particle size distribution of the NCPSD substreams. The particle size distribution is a calculated result of the models. The cyclone removes the larger particles. The fabric filter removes the medium-size particles. The electrostatic precipitator removes the smaller particles.
6 Close the Data Browser window.
To View the Block There are many results forms for these blocks. You can now Results examine any results of interest to you. This example guides you
through a review of some of the simulation results.
1From the Process Flowsheet window, right-click the CYCLONE block and from the shortcut menu, select Results.
The CYCLONE | Results | Summary sheet appears. This sheet reports the calculated geometry for the cyclone.
Getting Started - Solids |
Modeling Gas-Solid Separators • 4-13 |
2Close the Data Browser window.
3From the Process Flowsheet window, right-click the BAGFILT block and from the shortcut menu, select Results.
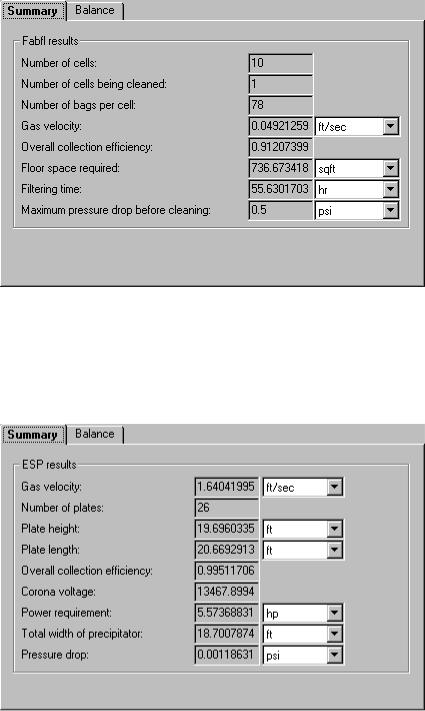
The BAG-FILT | Results | Summary sheet appears. This sheet display results from the fabric filter calculations, including gas velocity and overall collection efficiency.
4Close the Data Browser window.
5From the Process Flowsheet window, right-click the ESP block and from the shortcut menu, select Results.
The ESP | Results | Summary sheet appears. This sheet reports the geometry, the collection efficiency, and the power requirements of the electrostatic precipitator.
4-14 • Modeling Gas-Solid Separators |
Getting Started - Solids |