

To View the Stream
Results
Running the Simulation
1Click OK to run the simulation.
The Control Panel window appears, allowing you to monitor and interact with the Aspen Plus simulation calculations.
As Aspen Plus performs the analysis, status messages display in the Control Panel.
The simulation completes without warnings or errors.
When the calculations finish, the message Results Available appears in the status area at the bottom right of the main window.
2When the Simulation Run Completed message appears in the status bar, close the Control Panel window.
3Examine the results of your simulation.
Examining Simulation Results
1From the Control Panel, click  .
.
The Results Summary | Run Status | Summary sheet appears, indicating that the simulation completed normally.
2Click  to move to the next sheet with results.
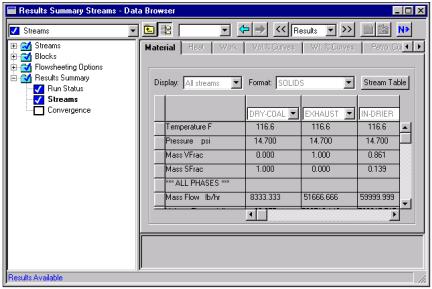
The Results Summary | Streams | Material sheet appears.
3Review the results on this sheet. Since this is a scrolling sheet, use the scrollbars to review results that are off the screen.
Getting Started - Solids |
Modeling Coal Drying • 2-25 |
Aspen Plus populates the Results Summary | Stream | Material sheet using the SOLIDS format. The SOLIDS format reports results in three sections.
The top section reports the thermodynamic variables temperature pressure, vapor fraction, and solid fraction for the stream.
The second section, beginning with ***ALL PHASES***, reports properties and component mass flow rates summed over all substreams. Examination of the component mass flow rates indicates that 1667 lb/hr of H2O are removed from the coal by the drying process.
The third section, beginning with *** SUBSTREAM NCPSD ***,
displays information that is appropriate only for the NCPSD substream. In this case, it displays the component attributes for coal, and the overall particle size distribution for the NCPSD substream. Note that the moisture in the PROXANAL is different for stream DRY-COAL and stream WET-COAL.
Stream summary results can also be displayed one substream at a time, by using the FULL format.
4In the Format field, click  and select FULL.
5Examine the results reported for the MIXED and NCPSD substreams. When you are done, return to the SOLIDS Format.
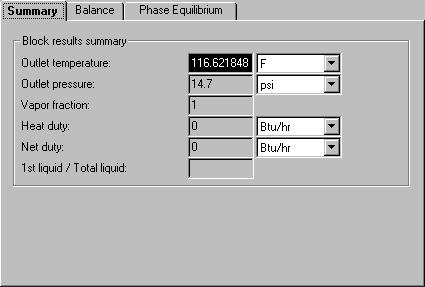
6From the Data Browser, expand the Blocks folder and select the DRY-FLSH folder.
The DRY-FLSH | Summary sheet appears. This sheet reports mixture thermodynamic properties for the block, such as outlet temperature.
2-26 • Modeling Coal Drying |
Getting Started - Solids |
To View the Block
Results
7Click  to move to the next sheet with results.
The DRY-FLSH | Results | Balance sheet appears. This sheet is used to report the overall mass and energy balance for the block.
8Click  to move to the next sheet with results.
The DRY-FLSH | Results | Phase Equilibrium sheet appears. On this sheet, Aspen Plus reports the total molar flow rate, liquid mole fractions, vapor mole fractions and K-values. In this block, there is no liquid phase, so the liquid mole fractions and K-values refer to a hypothetical liquid phase.
9Click  to move to the next sheet with results.
The DRY-FLSH | Stream Results | Material sheet appears. This is similar to the Results Summary | Streams | Material sheet, but only lists streams entering or leaving this block.
10Click  to move to the next sheet with results.
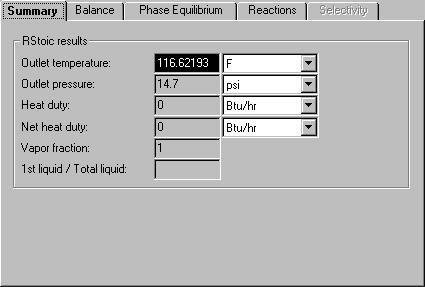
The DRY-REAC | Results | Summary sheet appears. This sheet, like the DRY-FLSH | Results | Summary sheet, displays the mixture thermodynamic results for the block, such as temperature.
11Click  to move to the next sheet with results.
The DRY-REAC | Results | Balance sheet appears. This sheet displays the mass and energy balance for the block. Because this block contains a reaction between the NCPSD substream and the MIXED substream, neither the conventional
Getting Started - Solids |
Modeling Coal Drying • 2-27 |