

Rear Panel
●
Reset
button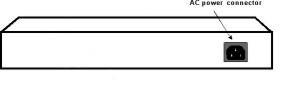
AC Power Connector
This is a three-pronged connector that supports the power cord. Plug in the female connector of the provided power cord into this connector, and the male into a power outlet. Supported input voltages range from 100~240V AC at 50~60Hz.
Reset
The Reset button is to reset all the setting back to the factory default.
Note: Be sure that you recorded the setting of your device, else all the setting will be erased when pressing the “Reset” button.
3. Installation
The site where you place the DES-1226G may greatly affect its performance. When installing, take the following into your consideration:
Install the DES-1226G in a fairly cool and dry place. See Technical Specificationsfor the acceptable temperature and humidity operating ranges.
Install the DES-1226G in a site free from strong electromagnetic field generators (such as motors), vibration, dust, and direct exposure to sunlight.
Leave at least 10cm (about 4 inches) of space at the front and rear of the hub for ventilation.
Install the DES-1226G on a sturdy, level surface that can support its weight, or in an EIA standard-size equipment rack.
When installing the Switch on a level surface, attach the rubber feet to the bottom of each device. The rubber feet cushion the hub and protect the hub case from scratching.

Attach the adhesive rubber pads to the bottom
Rack Mounting
The DES-1226G can be mounted in an EIA standard-size, 19-inch rack, which can be placed in a wiring closet with other equipments. Attach the mounting brackets to both sides of the Switch (one at each side), and secure them with the provided screws.

Use the screws provided. Then, use screws provided with the equipment rack to mount the Switch in the rack.

Mount the Switch in the rack
Connecting Network Cable
The DES-1226G supports 10/100/1000Mbps Gigabit Ethernet. It runs full/half duplex transfer mode for 10/100Mbps and full duplex transfer mode for 1000Mbps. Each port on the DES-1226G supports Auto-MDI/MDI-X. Auto-MDI/MDI-X is a feature that eliminates the need for worrying about using either a standard or crossover cable—you can use either one—and allows any port to be an uplink port.
AC Power
The DES-1226G can be used with AC power supply 100~240V AC, 50~60 Hz. The power switch is located at the rear of the unit adjacent to the AC power connector and the system fan. The switch’s power supply will adjust to the local power source automatically and may be turned on without having any or all LAN segment cables connected.
4. Configuration
Through the Web Browser you can configure the Switch such as VLAN, Trunking, QoS… etc.
With the attached Web Management Utility, you can easily discover all the Web Management Switch, assign the IP Address, changing the password and upgrading the new firmware.
Installing the Web Management Utility
The following gives instructions guiding you through the installations of the Web Management utility.
Insert the Utility CD in the CD-Rom Drive.
From the Start menu on the Windows desktop, choose Run.
In the Run dialog box, type D:\Web Management Utility\setup.exe (D:\ depends where your CD-Rom drive is located) and click OK.
Follow the on-screen instructions to install the utility.
Upon completion, go to Program Files -> web_management_utility and execute the Web Management utility. (Figure 1.)

Figure 1. Web Management Utility
The Web Management Utility was divided into four parts, Discovery List, Monitor List, Device SettingandToolbar function, for details instruction, follow the below section.
Discovery List
This is the list where you can discover all the Web management devices in the entire network.
By pressing the “Discovery”button, you can list all the Web Management devices in the discovery list.
Double click or press the “Add to monitor list”button to select a device from the Discovery List to the Monitor List.
System word definitions in the Discovery List:
MAC Address: Shows the device MAC Address.
IP Address: Shows the current IP address of the device.
Protocol version: Shows the version of the Utility protocol.
Product Name: Shows the device product name.
System Name: Shows the appointed device system name.
Location: Shows where the device is located.
Trap IP: Shows the IP where the Trap to be sent.
Subnet Mask: Shows the Subnet Mask set of the device.
Gateway: Shows the Gateway set of the device.
Monitor List
All the Web Smart Device in the Monitor List can be monitored; you can also receive the trap and show the status of the device.
System word definitions in the Monitor List:
S: Shows the system symbol of the Web-Smart device,
 represent for device system is not alive.
IP Address: Shows the current IP address of the device.
MAC Address: Shows the device MAC Address.
Protocol version: Shows the version of the Utility protocol.
Product Name: Shows the device product name.
System Name: Shows the appointed device system name.
Location: Shows where the device is located.
Trap IP: Shows the IP where the Trap to be sent.
Subnet Mask: Shows the Subnet Mask set of the device.
Gateway: Shows the Gateway set of the device.
View Trap: The Trap function can receive the events that happen from the Web Management Switch in the Monitor List.
There is a light indicator behind the “View Trap”button, when the light indicates in green, it means that there is no trap transmitted, and else when it indicates in red, it means that there is new trap transmitted, this is to remind us to view the trap. (Figure 2)
![]()
Figure 2.
When the “View Trap”button is clicked, a Trap Information window will pop out, it will show the trap information including the Symbol, Time, Device IP and the Event occured. (Figure 3)
The
symbol “![]() ”
represents the trap signal arise, this symbol will disappear after
you review and click on the event record.
”
represents the trap signal arise, this symbol will disappear after
you review and click on the event record.
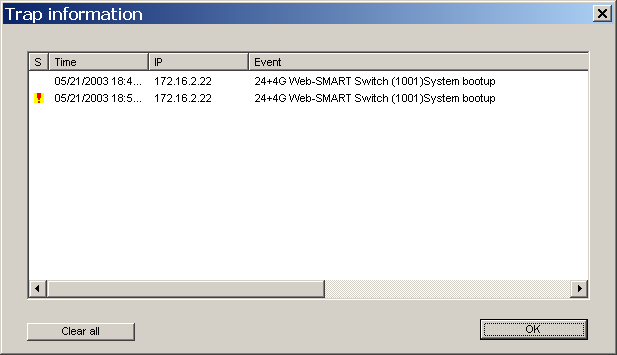
Figure 3.
Note: In order to receive Trap information, switch has to be configured with Trap IP and Trap Events in Web browser, which are available in the Trap Setting Menu (see Page 40 for detail).
Add Item: To add a device to the Monitor List manually, enter the IP Address of the device that you want to monitor.
Delete Item:To delete the device in the Monitor List.
Device Setting
You can set the device by using the function key in the Device Setting Dialog box.
Configuration Setting: In this Configuration Setting, you can set the IP Address, Subnet Mask, Gateway, Set Trap to (Trap IP Address), System name and Location.
Select the device in the Discovery list or Monitor List and press this button, then the Configuration Setting window will pop out as Figure 4, after filling up the data that you want to change, you must fill up the password and press the “Set” to process the data changed immediately.

Figure 4. Configuration Setting
Password Change:You can use this Password Change when you need to change the password, fill in the password needed in the dialog box and press“Set”button to proceed the password change immediately.
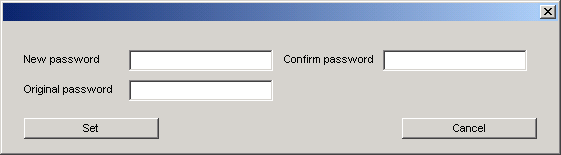
Figure 5. Password Change
Firmware Upgrade: When the device has a new function, there will be a new firmware to update the device, use this function to update.
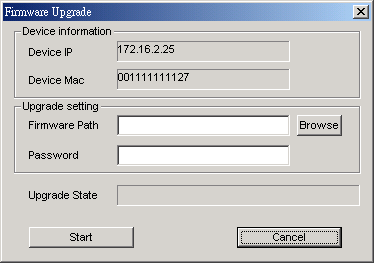
Figure 6.
Web Access: Double click the device in the Monitor List or select a device in the Monitor List and press this“Web Access”button to access the device in Web browser.
Toolbar
The toolbar in the Web Management Utility have four main tabs, File, View, Options and Help.
In the “File TAB”, there are Monitor Save, Monitor Save As, Monitor Load and Exit.
Monitor Save:To record the setting of the Monitor List to the default, when you open the Web Management Utility next time, it will auto load the default recorded setting.
Monitor Save As:To record the setting of the Monitor List in appointed filename and file path.
Monitor Load:To manually load the setting file of the Monitor List.
Exit:To exit the Web Management Utility.
In the “View TAB”, there are view log and clear log function, this function will help you to show trap setting.
View Log:To show the event of the Web Management Utility and the device.
Clear Log:to clear the log.
In the “Option TAB”, there are Refresh Time function, this function helps you to refresh the time of monitoring the device. Choose15 secs, 30 secs, 1 min, 2 min and 5 minto select the time of monitoring.
In the “Help TAB”, there is About function, it will show out the version of the Web Management Utility.