

Emergency Echocardiography
.pdfChapter 3
Echocardiography
in the Hypotensive Patient
Hypotension is a frequent scenario in unstable patients. The differential diagnosis between systolic ventricular failure and inadequate filling of the left ventricle can be challenging. This chapter offers a practical integrated echocardiographic diagnostic approach, which makes invasive assessment unnecessary in most cases. Other entities which can include hypotension as part of their clinical presentation are discussed as well. Section 3.5 is dedicated to management of cardiac tamponade, including both echocardiographic diagnosis and guiding of pericadiocenthesis.
3.1 INTRODUCTION
Persistent hypotension is defined as systolic blood pressure (BP) <90 mmHg and may reflect a shock syndrome. The following clinical features emphasize the hemodynamic impact of low BP and underline the urgency of diagnosis and treatment especially in cases with borderline-low BP values:
•Known baseline high BP values
•Sudden/rapidly evolving BP fall
•Mean BP <60 mmHg
•Clinical evidence of systemic vasoconstriction/hypoperfusion
°Cold/clammy/cyanotic extremities
°Restlessness, confusion
°Declining urinary output
°Metabolic acidosis
•Occurrence during an acute coronary syndrome
•Accompanying pulmonary congestion
55
A. Chenzbraun, Emergency Echocardiography, DOI: 10.1007/978-1-84882-336-5_3, © Springer-Verlag London Limited 2009

56 ECHOCARDIOGRAPHY IN THE HYPOTENSIVE PATIENT
Occasionally, the reason for hypotension is obvious: dehydration, bleeding, anaphylaxis, vasodilators overuse, and extreme bradycardia. Otherwise, understanding why the patient is actually hypotensive is crucial and should be addressed as soon as possible. This is where echocardiography is irreplaceable as a first-line diagnostic technique and should be able to pinpoint the mechanism of hypotension to be one of the following:
•Left ventricle (LV) systolic dysfunction
•LV underfilling
°Hypovolemia
°Right ventricle (RV) dysfunction
•Acute valvular pathology
•Tamponade
3.2 LV SYSTOLIC DYSFUNCTION AS A CAUSE OF HYPOTENSION
Chronic LV dysfunction even severe does not generally translate into acute clinical hypotension; if severe LV hypocontractility is seen in an unstable hypotensive patient, the LV impairment has to be assumed to be acute, or a precipitating/worsening factor has to be sought:
•Acute coronary syndrome
•Intravascular hypovolemia with relative ventricular underfilling
•Uncontrolled arrhythmia
•Acute nonischemic myocardial depression
°Acute myocarditis
°Recent prolonged CPR
°Severe hypoxaemia and/or acidosis
°Drug induced
■ Caor β-blockers overdose
From an echocardiographic point of view, the diagnosis of systolic dysfunction is generally a qualitative one where the degree of impairment is graded as mild, moderate, or severe based on a subjective assessment of ventricular hypokinesis. The visual assessment of ventricular hypocontractility can be supplemented by looking for additional findings as detailed below. Quantitative assessment as calculation of ejection fraction or cardiac index is not generally necessary for immediate management but can be obtained (Appendix B).
Practical tips to remember:
•Mild degrees of LV systolic dysfunction can be missed or masked by use of inotropes and vasodilators, but LV hypocontractility severe
3.3 LV SYSTOLIC DYSFUNCTION AS A CAUSE OF HYPOTENSION 57
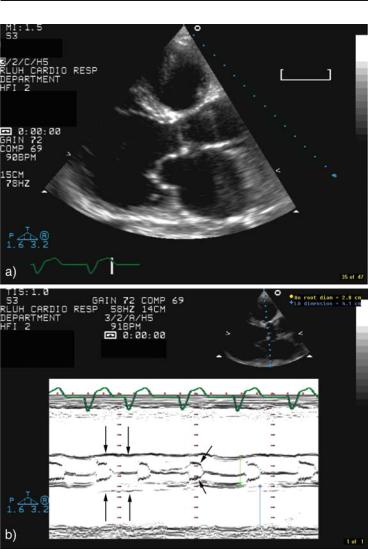
FIG. 3.1. M-mode supportive findings of severely decreased left ventricle (LV) contractility in a patient with dilated cardiomyopathy a two-dimen- sional imaging of the in parasternal long-axis view, showing a dilated, globular, and severely hypokinetic LV b M-mode scan at aortic root level. Note the flat motion (long arrows) of the aortic root secondary to the decreased stroke volume and the premature beginning of closure of the aortic valve leaflets (short arrows) reflecting the inability of the ventricle to maintain an effective flow rate throughout the ejection period.

58 ECHOCARDIOGRAPHY IN THE HYPOTENSIVE PATIENT
enough to cause hypotension or low cardiac output should be easily recognized.
•The actual degree of LV systolic impairment can be misinterpreted with:
■Poor quality images without endocardial visualization,
■Rapid/irregular heart rhythm,
■Wide LBBB,
■Ventricular paced rhythm.
•Segmental wall motion abnormalities suggest ischemic etiology, while diffuse hypokinesis is associated with cardiomyopathy or advanced valvular disease, but:
■Diffuse hypokinesis can be present in coronary artery disease patients with triple vessel disease and diffuse ischemic damage.
■Acute myocarditis can present with regional wall motion abnormalities.
•If in doubt, look for additional echocardiographic signs of severe LV systolic dysfunction:
■Reduced motion amplitude of the aortic wall,
■Early closure pattern of the aortic valve (Fig. 3.1),
■Decreased mitral annulus systolic motion:
–Amplitude <12 mm by M-mode and
–Velocity <8 cm/s by tissue Doppler.1
•If you do not feel comfortable with images’ quality, suggest:
■TEE with emphasis on transgastric views (esophageal views may be misleading due to oblique cuts) and
■Contrast echocardiography for LVO.
•Many instances of acute severe systolic dysfunction are at least partially reversible. This is true both for acute coronary syndromes after the initial stunning (especially if the patient undergoes revascularization) and for nonischemic etiologies. In fact, improvement of the systolic dysfunction after the acute event is frequent enough to warrant a repeat echocardiographic assessment at a later stage. Taking major therapeutic decisions such as suitability for aggressive therapy or need for a defibrillator or biventricular pacemaker, based on the LV contractility, assessed only once during the acute phase may be misleading.
3.3 LV UNDERFILLING AS A CAUSE OF HYPOTENSION
3.3.1 Background
Hypotension due to obvious hypovolemia such as bleeding, vomiting, or diarrhea is usually a self-evident diagnosis, which does

3.3 LV SYSTOLIC DYSFUNCTION AS A CAUSE OF HYPOTENSION 59
not require echocardiographic assessment especially in patients without a cardiac background.
A more complex situation arises when hypotension or low cardiac output occur in the setting of LV systolic dysfunction. This may reflect a combination of both pump failure and inadequate LV filling. The diseased ventricle is highly dependent on optimal end-diastolic filling to maintain systolic performance. Various acute conditions may be complicated by relative hypovolemia due to diuretics use and fluid restriction. Assessing the volemic status of hypotensive patients with LV dysfunction is one of the most frequent challenges in clinical practice. Moreover, patients with hypertension, diabetes, recent myocardial infarction, or sepsis have stiff LVs which require higher than normal end-diastolic filling pressures. In particular, for acute myocardial infarction, it has been shown using invasive measurements that a relatively high pulmonary capillary wedged pressure (PCWP) of » 15–20 mmHg may be necessary for an adequate cardiac output2 and similar recommendations exist for septic patients.3 The differential diagnosis between critical hypotension due to severe pump failure only or secondary to a combination of systolic dysfunction and relative LV underfilling is of vital importance since the latter may benefit from cautious fluid challenging. Classically, the determination of the filling status relied on invasive right heart pressures monitoring using a balloon-tipped flow-directed Swan-Ganz catheter and assuming that the measured pulmonary capillary wedged pressure reflects the left atrial pressure. However, the use of Swan-Ganz catheters requires a degree of expertise not always available and is fraught by specific potential complications. Moreover, the left-sided pressures as measured with a Swan-Ganz catheter may have a limited correlation only with the filling status since they reflect not only the absolute volume status but chamber compliance as well. In practice, we witness a continuous decline in the use of invasive hemodynamic monitoring in these patients and increasing reliance on echocardiographic assessment instead.4
3.3.2 Echocardiographic Assessment of Hypovolemia and Filling Status
The echocardiographic assessment of volemia and filling status comprises two elements (see also Appendix C):
3.3.2.1 Evaluation of Effective Central Blood Volume
This is the amount of blood present in the thoracic vessels and available for ventricular filling. The normal central blood volume

60 ECHOCARDIOGRAPHY IN THE HYPOTENSIVE PATIENT
(CBV) represents ≈ 10% of the total blood volume4 and it can be reduced either by absolute loss or by abnormal redistribution (Table 3.1). The net result of a significantly decreased CBV is a fall in ventricular preload and a possible reduction of cardiac output. The echocardiographic hallmarks of a low CBV (marked cyclic respiratory variations of the venae cavae) and underfilled LV (Fig. 3.2) are summarized in Table 3.2.
3.3.2.2 Evaluation of LV Filling Status
The LV filling depends on both the CBV and the ventricular stiffness. As detailed above, a diseased, noncompliant ventricle can be relatively underfilled even with a normal CBV. This paragraph deals with the echocardiographic assessment of the ventricular filling status using flowand tissue Doppler.
For flow-Doppler evaluation, the mitral valve diastolic flow pattern is obtained in apical 4-chamber view with the pulsed wave sample placed at mitral leaflets tips level. The resulting velocity
TABLE 3.1. Main etiologies of central blood volume (CBV) reduction.
Absolute loss
•bleeding
•dehydration
•vomiting, diarrhea
Intravascular redistribution
•sepsis
•anaphylaxis
•increased intrathoracic pressures
Third space redistribution
• Massive edema, ascites, anasarca
FIG. 3.2. Two-dimensional and Doppler findings in a patient with severe hypotension and oliguria due to hypovolemia. (a) Small (3.7 cm) enddiastolic diameter, (b) end-systolic cavity obliteration, and (c) E/A ratio markedly <1 (see text below).

3.3 LV SYSTOLIC DYSFUNCTION AS A CAUSE OF HYPOTENSION 61
TABLE 3.2. Main echocardiographic findings in hypovolemic patients.
Small, hyperdynamic heart
E/A < 1 pattern
Small (<20 mm) IVC with >50% respiratory diameter variations Increased (>60%) respiratory variations in the diameter of SVC moni
tored by TEE in mechanically ventilated patients4
aCan be obscured by tachycardia and fusion of E and A waves
waveform has an early peak (E) at the time of the early filling phase and an end-diastolic one (A) following the atrial contraction (Fig. 1.4). The velocities reflect the instantaneous atrioventricular gradient at any given time; the areas (time-velocities integrals) of the E and A components reflect the relative volumetric filling in early and late diastole. In young healthy individuals, the peak velocity and velocity-time integral are bigger for the E component reflecting vigorous relaxation and physiological early-diastolic filling preponderance. With age, the E/A peak velocities ratio reverses leading to an E/A ratio <1 which reflects impaired relaxation and a greater contribution of the atrial contraction to overall ventricular filling; within certain limits, this is an age-dependent physiological process. A similar reversal occurs with acute or chronic myocardial damage such as ischemic heart disease, cardiomyopathy, or hypertrophic states since active relaxation is impaired in all these cases even before systolic impairment occurs. However, for atrial contribution to become predominant, atrial contraction has to be mechanically effective, that is, the patient has to be in sinus rhythm and the end-diastolic filling pressures have to be relatively low. An apparently normal E/A >1 ratio in a patient with LV systolic dysfunction or organic heart disease is unexpected and suggests increased late-diastolic pressures with subsequent failure of the atrial contribution to filling (Fig. 3.3). This “pseudonormalization” of the E/A ratio has long been described to occur at a range of LVEDP values ≥15 mmHg.5 The deceleration time will be also decreased in these cases, reflective of a rapid cessation of early filling due to abrupt rise in the intraventricular pressures. In a more extreme variant, the E wave will be high and brisk with a markedly reduced deceleration time (<140 ms) and a diminutive A wave: this is known as a restrictive pattern and suggests very high filling pressures. A distinction has to be made between the chronic restrictive pattern in patients with restrictive cardiomyopathy and the possibly transient restrictive pattern (restrictive physiology) in patients with systolic dysfunction and fluid overload. The discussion in this chapter refers mainly to acute assessment of the filling status in unstable patients. For a summary of echocardiographic assessment of diastolic function, see Appendix C.

62 ECHOCARDIOGRAPHY IN THE HYPOTENSIVE PATIENT
FIG. 3.3. Flowand tissue-Doppler filling patterns in a hypotensive patient with severely decreased left ventricle (LV) systolic contractility. The E/A ratio = 1.6. The patient is unlikely to benefit from fluid challenge. In this clinical context, TDI is not routinely necessary to confirm raised filling pressures, unless the use of E/A ratio is not practical (see Limitations in text). In this case, the E/E′ ratio was 25, confirming elevated diastolic pressures. a Pulsed wave flow-Doppler with the sample volume at the tips of the mitral valve. b TissueDoppler with the sample volume at the septal side of the mitral annulus.

3.4 RV DYSFUNCTION AS A CAUSE OF HYPOTENSION 63
•In practical terms, faced with a clinically hypotensive patient:
°If E/A < 1 (Fig. 3.2c), assume relative hypovolemia even in the presence of systolic dysfunction.
°If E/A > 1(Fig. 3.3), hypovolemia is less likely.
•Limitations: this straightforward assessment is not usable with:
°Rapid or slow heart rates
°Mitral valve disease
°Nonsinus rhythm
°Recent atrial fibrillation: It may be a limitation even when the patient is in sinus rhythm since it can be followed by periods of atrial stunning which will result in small A velocities irrespective of the filling pressures.
These limitations may be partially circumvented by the use of tissue Doppler6 as explained in Sect. 1.5. A high-velocity E wave on the mitral valve Doppler flow velocity signal should be matched in normal individuals by a vigorous E¢ wave on the tissue Doppler signal at mitral annulus level since both reflect forceful relaxation. With pseudonormalization due to increased diastolic pressures, the E wave velocity increases to reflect the high instantaneous LA to LV gradient after mitral valve opening but the actual LV expansion will be less forceful and E¢ wave velocity actually decreases (Fig. 3.3).
An E/E¢ ratio more than 15 in this context is definitely indicative of high filling pressures while a ratio of 8–15 is less specific and E/E¢ less than 8 does not support the diagnosis.
Either the lateral or the medial aspect of the mitral annulus can be used, though using the medial aspect may increase sensitivity.
A simple step-by-step approach to assess the filling status in hypotensive patients is outlined in Fig. 3.4.
The Doppler patterns provide a snapshot of the hemodynamic status of the patient at the time of the study. A restrictive looking pattern may change to a low pressures one after good diuresis, so repeat Doppler studies offer a simple, noninvasive way to monitor changes in patients filling status (Fig. 3.5).
3.4 RV DYSFUNCTION AS A CAUSE OF HYPOTENSION
Severe RV failure can induce hypotension or low cardiac output due to underfilling of the LV.
The clinical picture will be of right heart failure and hypotension and the echocardiographic picture will include an enlarged, hypokinetic RV, and possibly a hyperdynamic LV.
RV contractility is more difficult to assess than LV contractility but severe cases should be recognized, especially since they are

64 ECHOCARDIOGRAPHY IN THE HYPOTENSIVE PATIENT
FIG. 3.4. Quick algorithm to assess filling status and the need for volume challenge using mitral valve flowand tissue-Doppler patterns. The E/E¢ ratio is necessary when E/A ratio cannot be used or in borderline cases.
associated with RV enlargement as well (Fig. 3.6). Also, as for the LV, a reduced tricuspid annulus velocity (<8 cm/s) supports the diagnosis of RV dysfunction.7 An important issue is to differentiate between an RV failing because of primary acute RV pathology (e.g., acute inferior + RV myocardial infarction) and an RV failing because of an acute rise in pulmonary artery pressure, that is, acute cor pulmonale such as pulmonary embolism. Besides the overall clinical picture, the following echocardiographic data can help in the differential diagnosis (Table 3.3).
3.5 TAMPONADE AS A CAUSE OF HYPOTENSION
Rapid accumulation of even a moderate amount of pericardial fluid or slow accumulation of a large amount can bring about a situation of restricted ventricular filling with high filling pressures and decreased cardiac output. This represents cardiac tamponade which, when full-blown, will present as hypotension with pulsus paradoxus, possibly syncope, dyspnea, tachycardia, and clinical evidence of peripheral hypoperfusion including decreased urinary output and metabolic acidosis.
3.5.1 Echocardiographic Diagnostic of Tamponade
This diagnostic implies:
•Demonstration of pericardial fluid
•Demonstration of tamponade physiology