

Афганистан - Опиум (2014)
.pdfIslamic Republic of Afghanistan
Ministry of Counter Narcotics
Afghanistan
Opium Survey 2014
Cultivation and Production
NOVEMBER 2014

Afghanistan Opium Survey 2014
ABBREVIATIONS
AGE |
Anti-Government elements |
ANP |
Afghan National Police |
CNPA |
Counter Narcotics Police of Afghanistan |
GLE |
Governor-led eradication |
ICMP |
Illicit Crop Monitoring Programme (UNODC) |
ISAF |
International Security Assistance Force |
MCN |
Ministry of Counter-Narcotics |
UNODC |
United Nations Office on Drugs and Crime |
ACKNOWLEDGEMENTS
The following organizations and individuals contributed to the implementation of the Afghanistan Opium Survey and to the preparation of this report:
Ministry of Counter-Narcotics
Mohammad Ibrahim Azhar (Deputy Minister), Haroon Rashid Sherzad (Deputy Minister), Mir Abdullah Sadat (Director of Narcotics Survey Directorate), Saraj Ahmad (Deputy Director of Narcotics Survey Directorate), Nasir Ahmad (Deputy Director of Narcotics Survey Directorate), Mohammad Ajmal Sultani (Statistical data analyst), Sayed Najibullah Ahmadi (Economic Specialist), Mohammad Hakim Hayat (GIS & Remote Sensing Analyst), Shabir Ahmad (GIS & Remote Sensing Analyst), Sayed Shahensha Sadat (Database quality controller), Mujtaba (Data Entry Clerk), Mustafa (Data Entry Clerk), Fazel Karim Alimi (Admin/Finance Assistant) and Hamida Hussaini (Administrative Officer).
Survey Coordinators: Sayed Eshaq Masumi (Central Region), Abdullah Jan (Eastern Region), Abdul Latif Ehsan (Western Region), Fida Mohammad (Northern Region), Mohammed Ishaq Anderabi (North-eastern Region) and Khalil Ahmad Noori (Southern Region).
United Nations Office on Drugs and Crime (Kabul)
Ashita Mittal (Deputy Representative, Programme), Devashish Dhar (International Project Coordinator), Abdul Manan Ahmadzai (Senior Survey Officer), Noor Mohammad Sadiq (Database developer).
Remote Sensing Analysts: Ahmad Jawid Ghiasee and Sayed Mehdi Sadat.
Survey Coordinators: Abdul Basir Basiret (Eastern Region), Bashir Ahmad Shakir (Southern Region), Sayd Ghawash Nayer (Western Region), Sayed Emran Mehrwarz (North-eastern Region), Rahimullah Omar (Central Region), Hashmatullah Atsek (Northern Region).
Provincial Coordinators: Mohammad Alam Ghalib (Eastern Region), Altaf Hussain Joya (Northeastern Region), Lutfurhaman Lutfi (Northern Region).
United Nations Office on Drugs and Crime (Vienna)
Jean-Luc Lemahieu (Director, Division for Policy Analysis and Public Affairs), Angela Me (Chief, Research and Trend Analysis Branch), Chloe Carpentier (Chief, Statistics and Surveys Section), Coen Bussink (GIS & Remote Sensing Expert), Irmgard Zeiler (Statistician), Kristina Kuttnig (Public Information Assistant), Jonathan Gibbons (Editor), Justice Tettey (Chief, Laboratory and Scientific Section), Yen-Ling Wong (Laboratory and Scientific Section).
The implementation of the survey would not have been possible without the dedicated work of the field surveyors, who often faced difficult security conditions.
The MCN/UNODC Illicit Crop Monitoring activities in Afghanistan were made possible by financial contributions from the Governments of Germany, Norway, the United Kingdom of Great Britain and Northern Ireland, and the United States of America.
2

|
Afghanistan Opium Survey 2014 |
|
Contents |
|
|
CONTENTS..................................................................................................................................... |
3 |
|
LIST OF TABLES .......................................................................................................................... |
5 |
|
KEY FINDINGS ............................................................................................................................. |
6 |
|
FACT SHEET AFGHANISTAN OPIUM SURVEY 2014 .......................................................... |
7 |
|
1 |
INTRODUCTION........................................................................................................ |
11 |
2 |
OPIUM CULTIVATION ............................................................................................ |
12 |
2.1 |
NATIONAL AND REGIONAL OPIUM CULTIVATION TRENDS................................. |
12 |
2.2 |
REGIONAL BREAKDOWN ............................................................................................... |
16 |
3 |
ERADICATION........................................................................................................... |
25 |
3.1 |
POPPY ERADICATION DECREASED BY 63% IN 2014 ................................................ |
25 |
3.2QUALITY CONTROL OF REPORTED ERADICATION WITH SATELLITE IMAGES 30
4 |
POTENTIAL OPIUM YIELD AND PRODUCTION .............................................. |
31 |
4.1 |
POTENTIAL OPIUM YIELD AND PRODUCTION INCREASED IN 2014 .................... |
31 |
4.2 |
POTENTIAL HEROIN PRODUCTION IN AFGHANISTAN ........................................... |
35 |
5 |
OPIUM PRICES AND FARM-GATE VALUE OF OPIUM ................................... |
43 |
5.1 |
OPIUM PRICES................................................................................................................... |
43 |
5.2 |
FARM-GATE VALUE OF OPIUM PRODUCTION .......................................................... |
46 |
6 |
METHODOLOGY....................................................................................................... |
47 |
6.1 |
ESTIMATION OF AREA UNDER OPIUM CULTIVATION............................................ |
47 |
6.2 |
SATELLITE IMAGE INTERPRETATION ........................................................................ |
52 |
6.3 |
OPIUM YIELD AND PRODUCTION ................................................................................ |
57 |
6.4 |
VERIFICATION OF GOVERNOR-LED ERADICATION (GLE)..................................... |
59 |
6.5AVERAGE FARM-GATE PRICE AND FARM-GATE VALUE OF OPIUM
PRODUCTION .................................................................................................................... |
59 |
ANNEX I: OPIUM POPPY CULTIVATION PER PROVINCE, 2002-2013 (HECTARES) 60 |
|
ANNEX II: INDICATIVE DISTRICT LEVEL ESTIMATES OF OPIUM CULTIVATION, |
|
2002-2014 (HECTARES).............................................................................................................. |
61 |
ANNEX III: ERADICATION FIGURES, BY DISTRICT (2014)............................................ |
67 |
3

Afghanistan Opium Survey 2014 |
|
LIST OF FIGURES |
|
Figure 1: Opium cultivation in Afghanistan, 1994-2014 (Hectares)................................................. |
12 |
Figure 2: Opium cultivation in Nangarhar province, 1994-2014 (Hectares)................................... |
17 |
Figure 3: Opium cultivation in Laghman, Kunar, Nuristan and Kapisa provinces, 1994-2014 |
|
(Hectares)...................................................................................................................................... |
17 |
Figure 4: Opium cultivation in Badakhshan province, 1994-2014 (Hectares) ................................ |
18 |
Figure 5: Opium cultivation in the Northern region, 2004-2014 (Hectares) ................................... |
20 |
Figure 6: Opium cultivation in Zabul province, 2002-2014 .............................................................. |
21 |
Figure 7: Opium cultivation in Hilmand, Kandahar and Uruzgan provinces, 2004-2014 |
|
(Hectares)...................................................................................................................................... |
22 |
Figure 8: Opium cultivation in Badghis province, 2004-2014 (Hectares)........................................ |
23 |
Figure 9: Opium cultivation in Farah province, 1994-2014 (Hectares) ........................................... |
24 |
Figure 10: Percentage of total opium poppy eradication, by province, 2013-2014 ......................... |
27 |
Figure 11: Area of opium poppy eradication, by different methods, 2013-2014 (Percentage of |
|
total) .............................................................................................................................................. |
28 |
Figure 12: Area of opium poppy eradication, per month, 2013-2014 (Percentage of total)........... |
28 |
Figure 13: Potential opium production in Afghanistan, 1997-2014 (Tons) ..................................... |
34 |
Figure 14: Morphine content (%) of all samples analysed between 2000 and 2012, with linear |
|
trend line....................................................................................................................................... |
36 |
Figure 15: Average morphine content (%) in Afghan samples of oven-dry opium gum, 2000-2012. |
|
....................................................................................................................................................... |
36 |
Figure 16: Simplified flow chart illustrating the main stages of processing pure heroin base from |
|
opium. ........................................................................................................................................... |
38 |
Figure 17: Photographs of yield survey 2014 ..................................................................................... |
42 |
Figure 18: Regional average price of dry opium reported by traders, January 2005 to August |
|
2014 (US dollars per kilogram)................................................................................................... |
44 |
Figure 19: Monthly prices of dry opium in Kandahar and Nangarhar province, as collected from |
|
March 1997 to August 2014 (US dollars per kilogram) ............................................................ |
45 |
Figure 20: Farm-gate value of opium production in Afghanistan, 2008-2013 (Million US dollars) |
|
....................................................................................................................................................... |
46 |
Figure 21: Spectral reflectance of opium poppy and other crops .................................................... |
53 |
Figure 22: Image classification methodology for estimating opium cultivation area ..................... |
53 |
Figure 23: Use of geo-referenced ground photos for image interpretation ..................................... |
54 |
Figure 24: Use of aerial photos for image interpretation .................................................................. |
55 |
Figure 25: Advantage of two-dated images, Kabul and Kandahar, 2009........................................ |
56 |
4

Afghanistan Opium Survey 2014 |
|
List of Tables |
|
Table 1: Regional distribution of opium cultivation, 2013-2014 (Hectares).................................... |
13 |
Table 2: Number of provinces by opium cultivation trends, 2006-2014 .......................................... |
14 |
Table 3: Main opium-cultivating provinces in Afghanistan, 2007-2014 (Hectares) ....................... |
14 |
Table 4: Opium cultivation (2010-2014) and eradication (2013-2014) in Afghanistan (Hectares) 15 |
|
Table 5: Opium cultivation and eradication in the Central region, 2011-2014 (Hectares) ............ |
16 |
Table 6: Opium cultivation and eradication in the Eastern region, 2011-2014 (Hectares) ............ |
16 |
Table 7: Opium cultivation and eradication in the North-eastern region, 2011-2014 (Hectares) . 18 |
|
Table 8: Opium cultivation and eradication in the Northern region, 2011-2014 (Hectares) ......... |
19 |
Table 9: Opium cultivation and eradication in the Southern region, 2011-2014 (Hectares) ......... |
20 |
Table 10: Poppy cultivation inside and outside the former Hilmand “Food Zone”, 2012-2014 .... |
21 |
Table 11: Opium cultivation and eradication in the Western region, 2011-2014 (Hectares) ......... |
23 |
Table 12: Governor-led eradication, by province, 2014 .................................................................... |
26 |
Table 13: Governor-led eradication, 2013-2014 (Hectares and percentage change) ...................... |
26 |
Table 14: Poppy eradication and cultivation in Afghanistan, 2007-2014 (Hectares)...................... |
27 |
Table 15: Start and end dates of Governor-led eradication (GLE), 2014........................................ |
29 |
Table 16: Opium yield, by region, 2013-2014 (Kilograms per hectare) ........................................... |
31 |
Table 17: Opium production in Afghanistan 2009-2014, by province (Tons) ................................. |
33 |
Table 18: Potential opium production, by region, 2013-2014 (Tons) ............................................... |
34 |
Table 19: Potential opium production, by region, with ranges, 2014 (Tons)................................... |
34 |
Table 20: Conversion ratios of opium to pure heroin base corresponding to various morphine |
|
contents and a laboratory efficiency of 34% (Kilograms of raw opium needed to produce a |
|
kilogram of pure heroin base)..................................................................................................... |
39 |
Table 21: Updated conversion ratio of opium to pure heroin base (Kilograms of raw opium |
|
needed to produce a kilogram of pure heroin base).................................................................. |
39 |
Table 22: Heroin purities at the wholesale level, as reported by selected countries ....................... |
40 |
Table 23: Amount of opium needed to produce a kilogram of heroin base of export quality (52% |
|
purity) with opium of 12.3% morphine content and 34% laboratory efficiency (Kilograms |
|
of raw opium needed to produce a kilogram of pure heroin base) .......................................... |
40 |
Table 24: Potential heroin production from Afghan opium, 2014 ................................................... |
41 |
Table 25: Regional farm-gate prices of dry opium at harvest time, reported by farmers through |
|
the price-monitoring system, 2013-2014 (US dollars per kilogram) ........................................ |
43 |
Table 26: Dry opium prices reported by traders, by region, August 2013-August 2014 (US |
|
dollars per kilogram) ................................................................................................................... |
44 |
Table 27: Area estimation method, by province, 2014 ...................................................................... |
47 |
Table 28: Sample size, agricultural land and sampling ratio, by province, 2014............................ |
48 |
Table 29: Area estimates of sample provinces with 95% confidence interval, 2014 (Hectares) .... |
51 |
Table 30: Regional opium yield values with 95% confidence intervals, 2014 (Kilograms per |
|
hectare) ......................................................................................................................................... |
57 |
Table 31: Yield survey villages and fields surveyed (all data), 2009-2014 ....................................... |
58 |
Table 32: Proportions of opiate seizures in Afghanistan and neighbouring countries (Percentage) |
|
....................................................................................................................................................... |
59 |
5

Afghanistan Opium Survey 2014
Key Findings
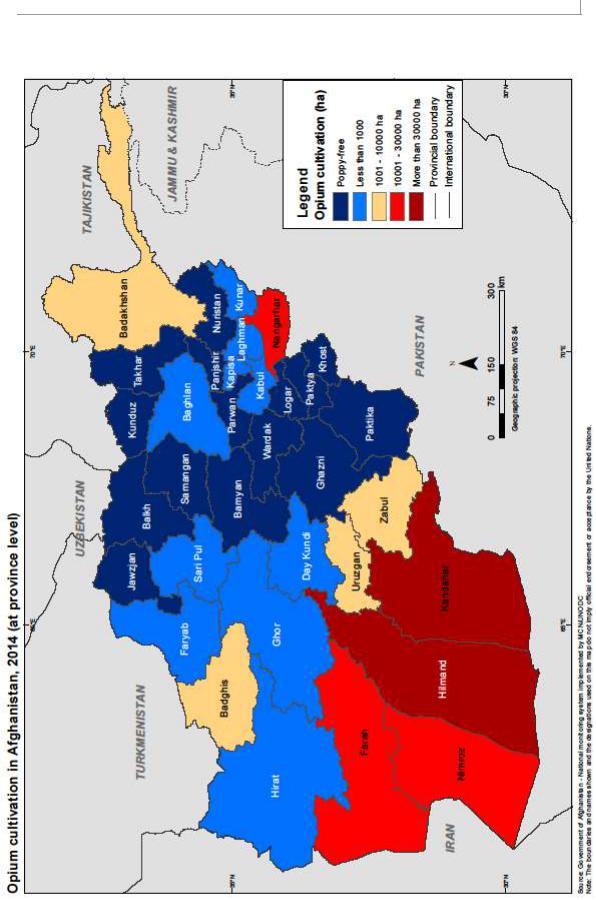
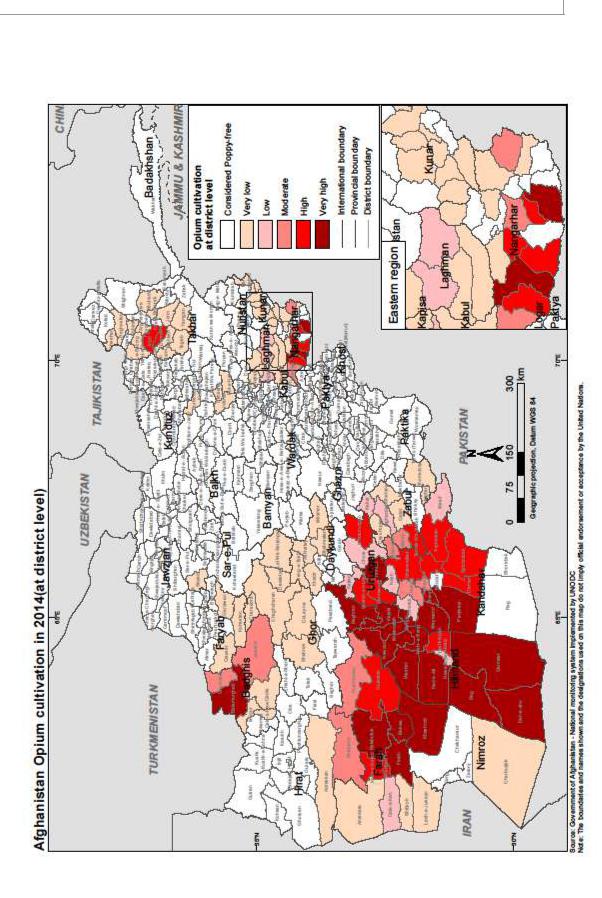
The total area under opium poppy cultivation in Afghanistan was estimated at 224,000 hectares in 2014, a 7% increase from the previous year.
The vast majority (89%) of opium cultivation took place in nine provinces in
Afghanistan’s Southern and Western regions, which include the country’s most insecure provinces.
Hilmand remained Afghanistan’s major opium-cultivating province, followed by Kandahar, Farah, and Nangarhar.
Opium cultivation increased in most of the main poppy-cultivating provinces, but stabilized in Hilmand itself (+3%).
Interestingly, differing trends could be observed in Hilmand. Inside the former “Food Zone” (an alternative livelihood programme), opium cultivation increased by 13% in 2014 (to 41,089 hectares from 36,244 hectares in 2013). However, outside the former Food Zone, where the increases in poppy cultivation seen in previous years were mainly achieved through artificial irrigation, the area under poppy cultivation decreased slightly.
Total eradication of opium poppy decreased by 63% in 2014, to 2,692 hectares.
Average opium yield amounted to 28.7 kilograms per hectare in 2014, which was 9% more than in 2013 (26.3 kilograms per hectare).
Opium yields in the Southern region, which drive overall production, increased by 27%, from 23.2 kilograms per hectare in 2013 to 29.5 kilograms per hectare in 2014. However, yields in the Southern region were still at relatively low levels in comparison to their levels prior to 2010.
Potential opium production was estimated at 6,400 tons in 2014, an increase of 17% from its 2013 level (5,500 tons). This increase can be mainly attributed to a strong increase in production in the Southern region, where yields increased by 27% (from 23.2 kilograms per hectare in 2013 to 29.5 kilograms per hectare in 2014).
Accounting for 69% of national production, the Southern region continued to produce the vast majority of opium in Afghanistan. With 16% of national production, the Western region was the country’s second most important opium-producing region in 2014.
At US$ 0.85 billion, or the equivalent of roughly 4% of Afghanistan’s estimated GDP, the farm-gate value of opium production decreased by 13% in 2014.
In 2014, opium prices decreased in all regions of Afghanistan. One probable reason for the decrease was an increase in supply due to an increase in production.
Based on recent data on the morphine content of Afghan opium, the heroin conversion ratio, which describes the amount of opium needed to produce a kilogram of heroin, has been updated. For converting opium to pure heroin base, a ratio of 18.5:1 is estimated; for heroin of export quality (impure heroin of 52% purity), a ratio of 9.6:1 is estimated. These ratios replace the former ratio of 7:1 for converting opium to heroin of unknown purity.
6

|
|
|
|
|
Afghanistan Opium Survey 2014 |
|
|
|||
Fact Sheet Afghanistan Opium Survey 20141 |
|
|
|
|
|
|
|
|||
|
|
2013 |
|
|
Change from |
|
|
2014 |
|
|
|
|
|
|
2013 |
|
|
|
|
||
|
|
|
|
|
|
|
|
|
|
|
|
|
|
|
|
|
|
|
|
|
|
Net opium poppy cultivation (after |
|
209,000 ha |
7% |
|
|
224,000 ha |
||||
eradication) in hectares |
(173,000 - 238,000) |
|
|
(200,000 - 250,500) |
|
|||||
|
|
|
|
|
||||||
|
|
|
|
|
|
|
|
|||
Number of poppy-free provinces2 |
15 |
|
0 |
|
15 |
|
|
|||
|
|
|
|
|
|
|
|
|
|
|
Number of provinces affected by poppy |
19 |
|
0 |
|
19 |
|
|
|||
cultivation3 |
|
|
|
|
||||||
|
|
|
|
|
|
|
||||
Eradication |
|
7,348 ha |
-63% |
|
|
2,692 ha |
||||
|
|
|
|
|
|
|
|
|
|
|
Average opium yield (weighted by |
|
26.3 kg/ha |
9% |
|
|
28.7 kg/ha |
||||
cultivation) |
|
|
|
|||||||
|
|
|
|
|
|
|
|
|
|
|
|
|
|
|
|
|
|
||||
Potential production of opium4 |
|
5,500 tons |
17% |
|
|
6,400 tons |
||||
|
(4,500 - 6,500) |
|
|
|
|
(5,100 - 7,800) |
|
|||
|
|
|
|
|
|
|
|
|
|
|
Average farm-gate price (weighted by |
|
|
|
|
|
|
|
|
|
|
production) of fresh opium at harvest |
|
US$ 143/kg |
-20% |
|
|
US$ 114/kg |
||||
time |
|
|
|
|
|
|
|
|
|
|
Average farm-gate price (weighted by |
|
US$ 172/kg |
-23% |
|
|
US$ 133/kg |
||||
production) of dry opium at harvest time |
|
|
|
|||||||
|
|
|
|
|
|
|
|
|
|
|
|
|
|
|
|
|
|
|
|
|
|
Total farm-gate value of opium |
|
US$ 0.95 billion |
-10% |
|
|
US$ 0.85 billion |
||||
production |
|
|
|
|||||||
|
|
|
|
|
|
|
|
|
|
|
1Numbers in brackets indicate the upper and lower bounds of the estimation range.
2Poppy-free provinces are those estimated to contain less than 100 hectares of opium cultivation.
3Provinces estimated to contain more than 100 hectares of opium cultivation.
4Refers to oven-dry opium.
7
Afghanistan Opium Survey 2014
8
Afghanistan Opium Survey 2014
9

Afghanistan Opium Survey 2014
10