

Афганистан - Опиум (2014)
.pdfAfghanistan Opium Survey 2014
4.2.4Estimation of 2014 potential heroin production with updated heroin
conversion ratio
Apart from morphine content, none of the factors in the opium-to-heroin estimation chain are well researched. The use of an average laboratory efficiency of 34% for the estimation of the conversion ratio of opium to pure heroin base is based on very little evidence, as only one study is available. Even less is known about the average purity of heroin produced in Afghanistan. The following has therefore to be considered as a rough estimate and more as an indication of the order of magnitude than as a precise measurement.
Based on information from 2011-2013 on the distribution of opium, morphine and heroin seizures in Afghanistan and neighbouring countries, and assuming a 52% purity of heroin of export quality, it can be estimated that out of every 100 kilograms of opium, 62 kilograms are converted into heroin of export quality and 38 kilograms are left unprocessed.32
The following table shows potential production of pure heroin and of heroin of export quality if 62% of potential opium production is converted to heroin and if all opium is converted to heroin.
Table 24: Potential heroin production from Afghan opium, 2014
|
|
If 62% of potential |
|
If total potential opium |
|
|
|
opium production |
|
production converted |
|
|
|
converted (tons) |
|
(tons) |
|
|
Pure heroin base |
210 |
|
350 |
|
|
(160-270) |
|
(260-440) |
|
|
|
|
|
|
||
|
Heroin of export quality |
410 |
|
670 |
|
|
(52% purity) |
(350-470) |
|
(560-760) |
|
|
|
|
|
|
|
|
Unprocessed opium |
2,450 |
|
- |
|
|
(1,960-2,970) |
|
|
||
|
|
|
|
|
A ratio of 18.5:1 (17.5:1 – 19.6:1) is used for converting opium to pure heroin base. For converting opium to 52% pure heroin, 9.6 kilograms (9.1 to 10.2 kilograms) of opium are assumed to be needed.
32 In 2013, it was estimated that 54% of opium production was converted to heroin of unknown purity. The change in percentage is mainly caused by the update of the conversion ratio of opium to heroin, as the distribution between opium and morphine/heroin seizures remained stable.
41

Afghanistan Opium Survey 2014
Figure 17: Photographs of yield survey 2014
Yield survey in Kabul province (Central region), 2014
Yield survey in Hilmand province (Southern region), 2014
Yield survey in Farah province (Western region), 2014
42

Afghanistan Opium Survey 2014
5 Opium prices and farm-gate value of opium
5.1 Opium prices
Opium prices remained high in 2014 but decreased in all regions of Afghanistan, making 2014 the third year to show a decreasing trend since the price hike caused by the 2010 poppy disease.
MCN/UNODC has monitored opium prices in selected provinces of Afghanistan on a monthly basis since 1994 (18 provinces as of September 2011). In 2008/2009, opium prices were at a low level but increased after that, most noticeably in the Eastern, Southern and Western regions, before reaching a maximum in 2011 after the unusually poor harvest caused by a disease of the opium poppy.
In 2011, opium prices started to decrease around harvest time in some regions, but remained volatile and at a higher level than in any year since 2005 (in absolute terms, not adjusted for inflation). This decrease can be explained by the relatively good 2011 harvest, since when reported opium prices have shown a decreasing trend in all regions, with an overall decrease of 23% between 2013 July and 2014 July. Dry opium prices reported by traders showed the same decreasing trend in all regions, with an overall decrease of 29% in the same period.
Table 25: Regional farm-gate prices of dry opium at harvest time, reported by farmers through the price-monitoring system, 2013-2014 (US dollars per kilogram)
|
Region |
|
|
Average dry opium |
|
|
Average dry opium |
|
|
Change 2013- |
|
|
|
|
price (US$/kg) 2013 |
|
|
Price (US$/kg) 2014 |
|
|
2014 (%) |
|
|
|
|
|
|
|
|
|
|
|
|||
|
|
|
|
|
|
|
|
|
|
|
|
Central |
221 |
|
142 |
|
-36% |
|
|||||
|
|
|
|
|
|
|
|||||
Eastern |
171 |
|
113 |
|
-34% |
|
|||||
|
|
|
|
|
|
|
|||||
North-eastern |
89 |
|
60 |
|
-33% |
|
|||||
|
|
|
|
|
|
|
|||||
Northern |
109 |
|
112 |
|
3% |
|
|||||
|
|
|
|
|
|
|
|||||
Southern |
161 |
|
129 |
|
-20% |
|
|||||
|
|
|
|
|
|
|
|||||
Western |
209 |
|
178 |
|
-15% |
|
|||||
|
|
|
|
|
|
|
|
|
|
||
|
National average weighted by |
|
|
172 |
|
|
133 |
|
|
-23% |
|
|
production* |
|
|
|
|
|
|
|
|||
|
|
|
|
|
|
|
|
|
|
|
|
|
|
|
|
|
|
|
|
|
|
|
|
43

Afghanistan Opium Survey 2014
Figure 18: Regional average price of dry opium reported by traders, January 2005 to August 2014 (US dollars per kilogram)
Price in (US$/Kg)
400
350
300
250
200
150
100
50
0
05 05 05 05 05 05 06 06 06 06 06 06 07 07 07 07 07 07 08 08 08 08 08 08 09 09 09 09 09 09 10 10 10 10 10 10 11 11 11 11 11 11 12 12 12 12 12 12 13 13 13 13 13 13 14 14 14 14 |
|||||||||||||||||||||||||||||
- - - |
- - - - - |
- - - - - |
- - - - - |
- - - - - |
- - - - - |
- - - - - |
- - - - - |
- - - - - |
- - - - - |
||||||||||||||||||||
May |
Sep Nov |
May |
Sep Nov |
May |
Sep Nov |
May |
Sep Nov |
May |
Sep Nov |
May |
Sep Nov |
May |
Sep Nov |
May |
Sep Nov |
May |
Sep Nov |
May |
|||||||||||
Jan Mar Jul- |
Jan Mar Jul- |
Jan Mar Jul- |
Jan Mar Jul- |
Jan Mar Jul- |
Jan Mar Jul- |
Jan Mar Jul- |
Jan Mar Jul- |
Jan Mar Jul- |
Jan Mar Jul- |
||||||||||||||||||||
|
|
|
|
|
|
|
|
|
|
|
|
|
|
|
|
|
|
|
|
|
|
|
|||||||
|
|
|
|
Eastern |
|
|
|
Southern |
|
|
Western |
|
|
|
North-eastern |
|
|
Northern |
|
|
|
|
|||||||
|
|
|
|
|
|
|
|
|
|
|
|
|
|
|
|
|
|
||||||||||||
|
|
|
|
|
|
|
|
|
|
|
|
|
|
|
|
|
|
|
|
|
|
|
|
|
|
|
|
|
|
Source: MCN/UNODC Monthly Price Monitoring System.
Table 26: Dry opium prices reported by traders, by region, August 2013-August 2014
(US dollars per kilogram)
|
|
|
|
Regional |
|
|
Regional |
|
|
|
|
|
|
|
|
average price |
|
|
average price |
|
|
Change |
|
|
|
|
|
(US$/kg) |
|
|
(US$/kg) |
|
|
|
|
|
Region |
|
|
|
|
|
|
2013-2014 |
|
||
|
|
|
August-2013 |
|
|
August-2014 |
|
|
|
||
|
|
|
|
|
|
|
|
(%) |
|
||
|
|
|
|
|
|
|
|
|
|
|
|
|
|
|
|
Trader |
|
|
Trader |
|
|
|
|
|
|
|
|
|
|
|
|
|
|
|
|
Eastern region (Kunar, Laghman, Nangarhar) |
145 |
|
129 |
|
-11% |
|
|||||
|
|
|
|
|
|
|
|||||
Southern region (Hilmand, Kandahar) |
163 |
|
146 |
|
-10% |
|
|||||
|
|
|
|
|
|
|
|||||
Western region (Badghis, Farah, Ghor, Hirat, Nimroz) |
192 |
|
210 |
|
9% |
|
|||||
|
|
|
|
|
|
|
|||||
North-eastern region (Badakhshan, Kunduz, Takhar) |
107 |
|
89 |
|
-17% |
|
|||||
|
|
|
|
|
|
|
|||||
Northern region (Balkh, Faryab, Kunduz) |
112 |
|
112 |
|
0% |
|
|||||
|
|
|
|
|
|
|
|||||
|
Average |
|
|
144 |
|
|
137 |
|
|
-5% |
|
|
|
|
|
|
|
|
|
|
|
|
|
44
Afghanistan Opium Survey 2014
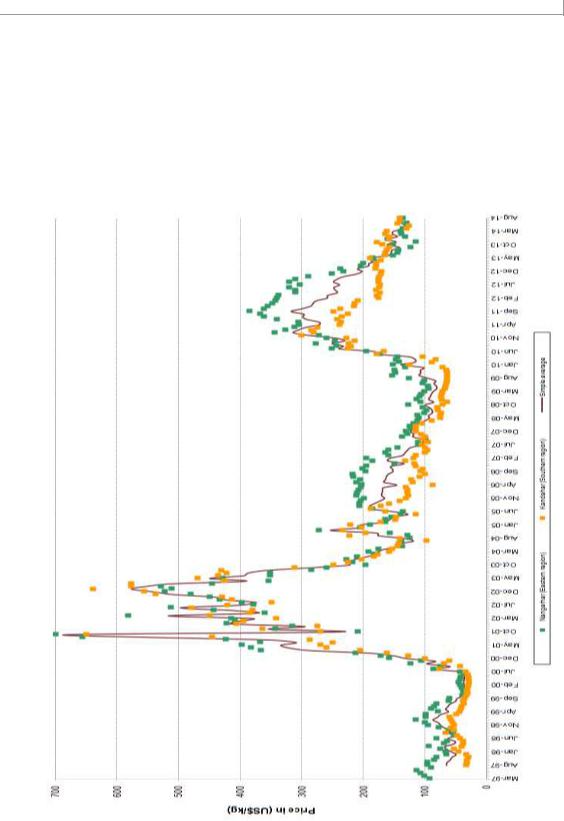
Figure 19: Monthly prices of dry opium in Kandahar and Nangarhar province, as collected from March 1997 to August 2014 (US dollars per kilogram)
Source: MCN/UNODC Monthly Price Monitoring System.
45

Afghanistan Opium Survey 2014
5.2 Farm-gate value of opium production
Amounting to US$ 853 million (US$ 680-1,030 million), the farm-gate value of opium production in 2014 decreased by 13% from its 2013 level. The decrease in farm-gate value was mainly due to the 23% price decrease.
Farmers in Hilmand, the country’s largest opium-producing province, earned some US$ 394 million, which was equivalent to 46% of the total farm-gate value of opium production in Afghanistan in 2014; a decrease of 13% from 2013 (US$ 945 million).
Figure 20: Farm-gate value of opium production in Afghanistan, 2008-2013 (Million US dollars)
Figures for 2008 and 2009 were recalculated from the revised opium production estimates, see MCN/UNODC Afghanistan Opium Survey 2012. Ranges were calculated proportionally to the previously published estimate.
46

Afghanistan Opium Survey 2014
6 Methodology
This chapter covers various methodological aspects regarding survey design and estimation procedure.
6.1 Estimation of area under opium cultivation
Remote sensing methodologies have been used by UNODC since 2002 to monitor the extent of opium cultivation in Afghanistan. Changes in the location of opium poppy cultivation and the increased security difficulties involved in accessing the area under scrutiny require continuous improvements of the sampling designs applied.
A sampling approach is used to cover those provinces where most of the poppy is found, whereas a targeted approach is used in provinces with a low level of opium cultivation. “Targeted approach” means that a certain area of a province is fully covered by satellite imagery.
In 2014, out of 34 provinces in Afghanistan, 11 were sampled and 11 were targeted. The remaining 12 provinces were considered to be poppy-free33 based on information from the field. These provinces were not covered by the remote sensing survey, but were covered by the village survey.
Table 27: Area estimation method, by province, 2014
Region |
|
Targeted approach |
|
Sampling approach |
|
Village survey only |
|
|
|
|
|
|
Ghazni, Khost, Logar, |
Central |
|
Kabul |
|
|
|
Paktya, Panjshir, Parwan, |
|
|
|
|
|
|
Wardak, Paktika |
|
|
|
|
|
|
|
Eastern |
|
Kapisa, Laghman, |
|
Kunar, Nangarhar |
|
Nuristan |
|
Nuristan |
|
|
|||
|
|
|
|
|
|
|
|
|
|
|
|
|
|
Northern |
|
Baghlan, Balkh, Faryab, |
|
|
|
Bamyan, Samangan |
|
Jawzjan, Sari-Pul |
|
|
|
||
|
|
|
|
|
|
|
North-eastern |
|
Takhar |
|
Badakhshan |
|
Kunduz |
|
|
|
|
|
|
|
Southern |
|
|
|
Day Kundi, Hilmand, |
|
|
|
|
|
Kandahar, Uruzgan, Zabul |
|
|
|
|
|
|
|
|
|
|
|
|
|
|
|
|
|
Western |
|
Ghor, Hirat |
|
Badghis, Farah, Nimroz |
|
|
|
|
|
|
|
|
|
6.1.1Area estimation based on sampling methods and targeted approaches
6.1.1.1Sampling frame
The area available for agriculture was updated based on Landsat 8 ETM images and DMC images. The total estimated agricultural area in Afghanistan in 2014 amounted to 78,753.04 km2. The sampling frame was established by extracting the area of land potentially available for opium cultivation in 11 provinces. This area was divided into regular 10 km by 10 km grids, which constituted the sampling frame. The final sampling frame, from which the satellite images were randomly selected, consisted of 1,463 cells in 11 provinces. In the case of images that cut across provincial boundaries, only the part falling into a particular province was considered to be in that province.
The area available for agriculture in the sampling frame covers irrigated and rain-fed land. The total area in the 11 provinces was 23,563 km2, which is equivalent to 30% of all potential agricultural land in Afghanistan. Potential land refers to all land available for cultivation and also includes land that is currently fallow.
Cells containing less than 1 km2 of potential agricultural land were excluded from the sampling frame in order to reduce the likelihood of choosing cells with very little arable land. In total, the exclusions represented less than 2% of the total potential agricultural land.
33 Note that more than these 12 provinces turned out to be poppy-free in the satellite survey, because less than 100 hectares of opium cultivation was detected.
47

Afghanistan Opium Survey 2014
In 2014, high-resolution satellite images were acquired for 163 sampled locations 10 km by 10 km in size, covering a total of 11 provinces and 65 locations, for the 11 target provinces in Afghanistan.
Table 28: Sample size, agricultural land and sampling ratio, by province, 2014
|
Total arable land |
|
|
% of selected |
Arable land in |
Sample size (% of |
|
Province |
Total |
Selected |
cells over total |
arable land in |
|||
(km2) |
selected cells |
||||||
|
|
|
cells |
selected cells) |
|||
|
|
|
|
|
|||
|
|
# cells |
# cells |
|
(km2) |
|
|
Badakhshan |
3,983 |
130 |
16 |
12% |
587 |
15% |
|
|
|
|
|
|
|
|
|
Badghis |
6,515 |
180 |
15 |
8% |
808 |
12% |
|
|
|
|
|
|
|
|
|
Day Kundi* |
585 |
140 |
8 |
6% |
55 |
9% |
|
|
|
|
|
|
|
|
|
Farah |
1,868 |
187 |
16 |
9% |
146 |
8% |
|
|
|
|
|
|
|
|
|
Hilmand |
3,872 |
199 |
40 |
20% |
927 |
24% |
|
|
|
|
|
|
|
|
|
Kandahar* |
2,938 |
214 |
22 |
10% |
165 |
6% |
|
|
|
|
|
|
|
|
|
Kunar |
240 |
57 |
9 |
16% |
51 |
21% |
|
|
|
|
|
|
|
|
|
Nangarhar |
804 |
59 |
9 |
15% |
126 |
16% |
|
|
|
|
|
|
|
|
|
Nimroz |
948 |
68 |
10 |
15% |
176 |
19% |
|
|
|
|
|
|
|
|
|
Uruzgan* |
770 |
84 |
10 |
12% |
93 |
12% |
|
|
|
|
|
|
|
|
|
Zabul* |
1,040 |
145 |
8 |
6% |
43 |
4% |
|
|
|
|
|
|
|
|
|
Total |
23,563 |
1,463 |
163 |
11% |
3177 |
13% |
|
|
|
|
|
|
|
|
* The sampling locations were changed or newly introduced in these provinces.
The sample size (meaning the number of images acquired in each province) was approximately proportional to the square root of the area of potential agricultural land. This allocation methodology is one form of compromise between the appropriate allocations for producing national estimates and for producing provincial estimates. A minimum number of eight sample cells was set. The total number of images was constrained by cost considerations and the maximum number of images that the satellite provider could handle given the limited time window for each image.
The same image locations as in 2013 were used in 2014 for 7 out of the 11 sampled provinces. To account for the dynamics of poppy cultivation and the re-allocation of Gizab district from Day Kundi to Uruzgan, the provinces of Day Kundi, Kandahar, Uruzgan and Zabul were re-sampled.
In greater detail, the following methods were used:
In the provinces of Day Kundi, Farah, Hilmand, Kandahar, Nimroz, Uruzgan and Zabul, the study area (“frame”) was divided into compact geographical strata of approximately equal area by applying a clustering algorithm (“k-means”) in the statistical software R. In each stratum, two sampling locations were selected by simple random sampling. This method ensured a good geographical coverage by sampling locations while allowing for an unbiased estimation of the variance. In Hilmand and Nimroz, the area was additionally separated in two substrata: in Hilmand, this accounted for the lower poppy cultivation density in the former “Food Zone”; in Nimroz, it accounted for the high concentration of poppy cultivation in Dilaram district. This allowed the provision of two separate poppy estimates in Hilmand: one for the total area under cultivation in the province; and one for the area under cultivation within the former (2012) Food Zone. Gizab district was targeted.
In Badakhshan Nangarhar and Kunar provinces, a one-stage systematic random sampling approach was employed in which a sampling rule was applied that ensured good geographic coverage. Starting from a randomly chosen cell, every kth element from then onwards was chosen, where k is determined by the number of cells in the frame and the desired sample size (the actual sample size might differ slightly). To avoid adjacent cells, every other line was skipped.
48

Afghanistan Opium Survey 2014
In Nangarhar province, the districts Dara-e-Nur, Kuzkunar, Kama, Behsud, Jalalabad and partially Surkhrod were excluded from the frame.
In the remaining provinces, a historically grown, non-random sample was used. It is also planned to apply a new sampling strategy in these provinces in 2015.
6.1.2Area estimation in sampled provinces
The estimation of the extent of opium poppy cultivation is a ratio estimate for each of the provinces, using potential agricultural land as an auxiliary variable. The national estimate was obtained by adding up the provincial estimates in what is known as a separate ratio estimate.
The Hansen-Hurwitz estimator is one method of estimating the extent of opium poppy cultivation when the probability of selecting sampling units is not equal.
An unbiased estimate of the area of opium poppy cultivation, Ak, within province k:
|
|
Rk |
nk |
|
Ak |
|
Pi Ri |
||
n |
||||
|
|
i 1 |
||
|
|
k |
where nk is the number of satellite image locations within the province.
Pi is the area of poppy cultivation in image i.
Ri is the area of land potentially available for poppy cultivation (risk area) in image i.
Rs is the total potential land available for poppy cultivation (risk area) from the sampling frame in province k.
In the newly sampled provinces with equal inclusion probability, a slightly different ratio estimate that uses agricultural area as regressor was used. An unbiased estimate of the area of opium poppy cultivation, Ak, within province k
Ak nk Pi nkRs
i 1 |
Ri |
|
|
|
i 1 |
with the same notation, as above.
49

Afghanistan Opium Survey 2014
50