

Афганистан - Опиум (2014)
.pdfAfghanistan Opium Survey 2014
6.1.2.1Uncertainty
In Day Kundi, Farah, Hilmand, Kandahar, Nimroz, Uruzgan and Zabul, the confidence intervals were calculated following statistical practice.34
In all remaining provinces where no unbiased estimator for the variance was available, confidence intervals were calculated using the bootstrap method with 100,000 iterations. Bootstrapping consists of re-sampling with replacements from the original sample. After each iteration, the area under cultivation is estimated. After 100,000 iterations a distribution of cultivation areas can be observed and the 95% confidence interval is derived by using the 2.5 and 97.5 percentiles.
In Badakhshan the lower confidence interval was calculated by summing up the poppy in the sample and subtract eradicated area.
Table 29: Area estimates of sample provinces with 95% confidence interval, 2014 (Hectares)
|
Point estimate |
Lower bound |
Upper bound |
Province |
(Hectares) |
(Hectares) |
(Hectares) |
Badakhshan |
4,204 |
1,269 |
11,225 |
|
|
|
|
Badghis |
5,721 |
1,171 |
13,619 |
|
|
|
|
Day Kundi |
587 |
192 |
841 |
|
|
|
|
Farah |
27,513 |
13,722 |
41,305 |
|
|
|
|
Hilmand |
103,240 |
91,026 |
114,063 |
|
|
|
|
Kandahar |
33,713 |
24,850 |
42,712 |
|
|
|
|
Kunar |
754 |
346 |
1,467 |
|
|
|
|
Nangarhar |
18,227 |
8,690 |
26,634 |
|
|
|
|
Nimroz |
14,584 |
10,420 |
18,744 |
|
|
|
|
Uruzgan |
9,277 |
2,803 |
18,705 |
|
|
|
|
Zabul |
2,894 |
668 |
5,145 |
|
|
|
|
Target provinces |
3,623 |
NA |
NA |
National |
224,337 |
196,443 |
246,805 |
National (rounded) |
224,000 |
200,000 |
200,500 |
|
|
|
|
To express the uncertainty associated with the national area estimation, which includes the provinces covered by the targeted approach and the sample provinces, but excludes provinces with an estimate of less than 100 hectares (which are considered “poppy-free” and not counted), a range was calculated by adding the poppy area figures of the target provinces to the upper and lower limits of the 95% confidence interval at the national level.
6.1.3Area estimation in target provinces
The consensus view of those working in Afghanistan was that the MCN/UNODC surveillance system developed in the provinces can identify sites where poppy was grown, with further inputs being obtained from the survey of village headmen. Fieldworkers visited potential poppy-growing sites to confirm the situation and provided GPS references for the sites. If geographical clusters of sites were identified, targeted satellite images were obtained to measure the areas involved. The total poppy area of a target province is equal to the poppy area measured on the imagery without any further calculation. For a list of provinces for which the target approach was used see Table 4.
In provinces where satellite images were targeted, the estimated area under opium cultivation is not affected by sampling errors, although they may be affected by the omission of areas with very little cultivation. Area estimates of target provinces should therefore be considered as a minimum estimate.
34 See, e.g. Cochran, W. G., Sampling techniques, John Wiley & Sons (2007).
51

Afghanistan Opium Survey 2014
6.1.4District level estimation
District level results are indicative only. A combination of different methods is used. If districts are covered by sampled cells, the average value of these cells is used. In the case of districts where sampled cells were not available, two methods were used to calculate district estimates. If the agricultural area of a district with a sample grid extended into a neighbouring district(s) without interruption, the poppy proportion of the sample grid was also used for the neighbouring district(s). For districts with isolated, non-contiguous agricultural areas, the average poppy proportion of the province was applied. The methodology and sample was not designed to produce results at the district level.
6.1.5Accuracy assessment
Due to the difficult security situation in many parts of Afghanistan, which prevented surveyors from carrying GPS and mapping equipment, an insufficient number of ground segments could be visited in order to conduct a systematic accuracy assessment.
6.1.6Estimation of the net cultivation area
The area figure presented is the net harvestable opium poppy cultivation area. The effect of poppy eradication activities was taken into account based on data from the eradication verification survey, which provides exact GPS coordinates of all eradicated fields supplemented with additional information. The gross cultivation areas would be the net cultivation plus eradication.
In provinces where the poppy area is estimated with a sampling approach, the first step is to calculate the gross poppy cultivation area. The total area eradicated in those provinces is then deducted from the mid-point estimate of the provincial cultivation estimate to obtain the net cultivation area. If eradication activities were carried out after the date of the image acquisition, no adjustment is necessary as the poppy present in the image reflects the gross poppy area. If eradication activities were carried out in a sample block before the date of the image acquisition, the area interpreted as poppy would not reflect the gross area. Therefore, the eradicated fields are added to the interpreted fields. The adjusted poppy area figure for the block is then used for the provincial estimate.
In provinces where the poppy areas is estimated with a targeted approach (census), eradication activities that happened before the date of the image acquisition are already reflected, as these fields no longer appear as poppy in the image. Fields that were eradicated after the date of the images acquisition are simply deleted.
6.2 Satellite image interpretation
6.2.1Acquisition of satellite images
The acquisition of satellite images at the appropriate growth stage of the opium poppy is key to the successful identification of opium poppy fields on satellite images. Satellite data is collected at two stages: the pre-harvest (flowering) stage and the post-harvest (post-lancing) stage. In recent years, detailed information on the crop growth cycle of each district has been collected in the form of a phenological chart, which is useful for deciding on appropriate dates for satellite data acquisition. First-dated images of the Southern, Eastern and Western regions are collected during March and April due to the early cultivation and maturity of crops in those regions. The crop growth cycle begins later as one goes northward. Images of the North and North-eastern region are acquired during May, June and July. Second-dated satellite images are collected approximately two months after the first images are collected.
The normal time window for satellite data acquisition is one month, depending on the scheduled passing of satellite and weather conditions. The time window for first-dated image acquisition begins at the full flowering stage and continues through the capsule stage. Second-dated image acquisition begins towards the end of the lancing stage and continues until the opium poppy fields are ploughed. Images acquired in the middle of the prescribed time window facilitate optimum discrimination between opium poppy and other crops.
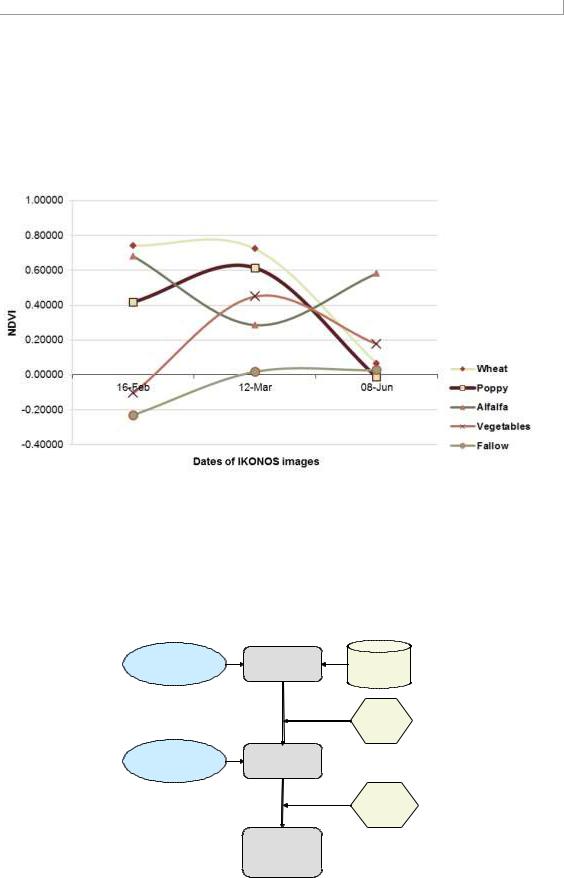
The figure below illustrates the spectral characteristics (Normalized Difference Vegetation Index; NDVI) of opium poppy and other crops between February and June. Wheat and opium poppy
52
Afghanistan Opium Survey 2014
have the same growth cycle between March and June, as illustrated. The spectral differences between those two crops are more pronounced in February, which marks the beginning of the capsule stage of the crop in this example. Poppy fields are ploughed immediately after the harvest, whereas wheat fields are not. That is why two-dated images (pre-harvest and post-harvest) are collected for the same location.
Figure 21: Spectral reflectance of opium poppy and other crops
The figure above illustrates the growth cycles of opium poppy, wheat and clover from February to June, with the help of ground photographs. Note that maximum visual discrimination between opium poppy and other crops is possible during the flowering/capsule stage and after capsule lancing. The different phenological stages described above are shown in the figure on the previous page (field photographs of opium poppy, wheat and clover on different dates).
Figure 22: Image classification methodology for estimating opium cultivation area
Pre-harvest |
Visual |
Ground |
|
|
|
image |
interpretation |
truth data |
|
|
|
|
|
Quality |
|
|
check |
Post-harvest |
Validation of |
|
image |
interpretation |
|
|
|
Quality |
|
|
check |
|
Opium |
|
|
poppy area |
|
|
estimation |
|
6.2.2Interpretation of opium cultivation from satellite images
First-dated images were acquired during the flowering or capsule stage and second-dated images were acquired after the opium harvest. For example, wheat appears mostly in bright red on the
53
Afghanistan Opium Survey 2014
first date image in false colour composite (full coverage with vegetation appears in red; bare soil in grey/green), while opium poppy fields are shown in tones of pink. Although there can be some confusion between opium poppy and wheat in the first-dated images, the acquisition of seconddated images makes it possible to distinguish opium poppy from other crops, because the opium poppy crop has been harvested and the fields appear in grey/green.
Visual interpretation was used to delineate opium poppy fields by interpreting IKONOS images covering a 10 km by 10 km area. Ortho-rectified IKONOS, QUICKBIRD, WORLD-VIEW2 and GEO-EYE images of 1 m resolution and 0.5 m resolution (PAN-sharpened) were used for this purpose. Opium poppy was initially identified using first-dated high resolution images. Ground truth information collected in the form of segment maps and GPS points was also useful in identifying opium poppy fields. The interpretation based on first-dated images was improved using patterns of observation in second-dated images. Aerial photographs of the poppy fields were acquired using helicopters in the provinces of Kandahar and Hilmand during the eradication season, as well as in Kabul, Kapisa, Kunar, Laghman and Nangarhar provinces during the flowering and capsule stages. These photographs were tagged by latitude and longitude and facilitated to locate the poppy areas on satellite images, and were very helpful in confirming the poppy areas in the satellite images. Poppy field boundaries in 2012 were delineated by an onscreen digitization method.
6.2.2.1Band combination for opium poppy identification
Two kinds of band combination were used to detect opium poppy. True-colour combination (blue, green, red) was used in areas where land use is dominated by opium (for example, Hilmand and Kandahar) and in cases where images were obtained during the flowering and lancing stages of opium poppy. False-colour combination (infra-red, red, green) was used in almost all cases. Analysts used both combinations simultaneously to optimize discrimination between opium poppy and other crops.
Some of the images could not be acquired at the appropriate time due to weather conditions and/or the time at which the satellite passed. The delayed acquisition of images makes it difficult to detect opium poppy, since fields may be at the senescence stage due to the lancing of capsules and can therefore be confused with fallow fields. In such cases, second-dated images are often useful in confirming opium poppy fields, since harvest patterns are different for wheat and opium poppy.
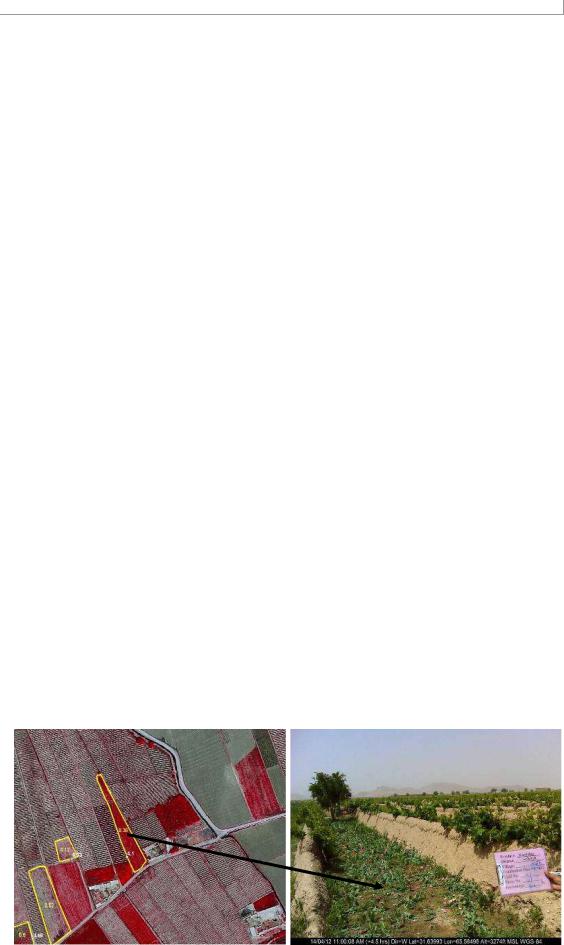
6.2.2.2Ground reference information
Ground reference data were collected in the form of GPS points, field photographs and aerial photographs. Some 1,854 GPS points of poppy fields, supported with pictures, were collected from the provinces of Takhar, Sari Pul, Baghlan, Balkh, Faryab, Kapisa.
GPS point data were superimposed over the ortho-rectified satellite images to facilitate identification of poppy fields during visual interpretation.
Figure 23: Use of geo-referenced ground photos for image interpretation
54
Afghanistan Opium Survey 2014
Satellite image (infra-red) |
Field photograph (natural colour) |
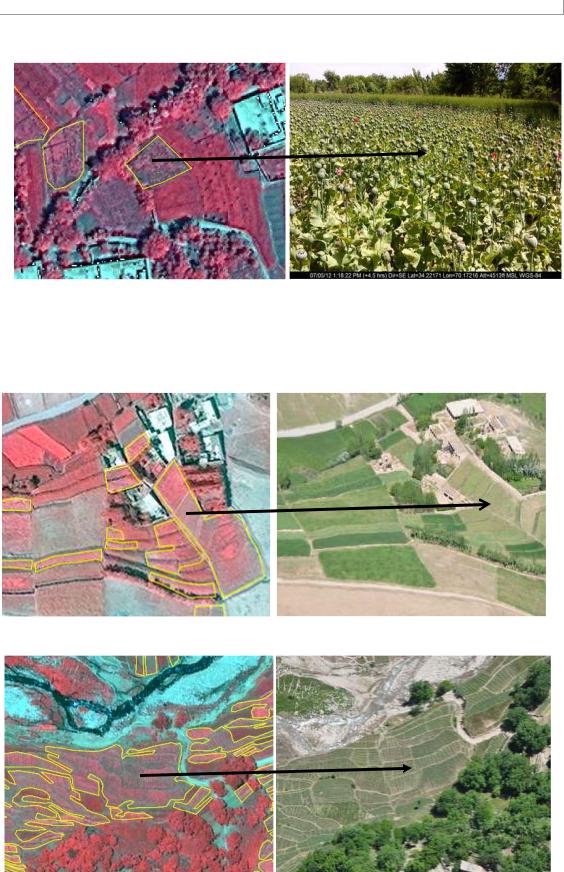
Natural colour aerial photographs acquired from helicopters were co-related with the satellite images to identify poppy from other crops, as shown below.
Figure 24: Use of aerial photos for image interpretation
Satellite image (infra-red) |
Aerial photograph (natural colour) |
6.2.2.3Advantage of two-dated images
Visual interpretation of single-dated very high-resolution images was a relatively easy task in Hilmand, Kandahar, Uruzgan, Farah and Nimroz provinces. This was due to larger field sizes and timely acquisition of the images. Interpretation in target provinces Nangarhar, Laghman, Kunar, Kabul, Kapisa, Hirat, Ghor, Baghlan, Faryab and Badakhshan was easy with the help of GPS
55
Afghanistan Opium Survey 2014
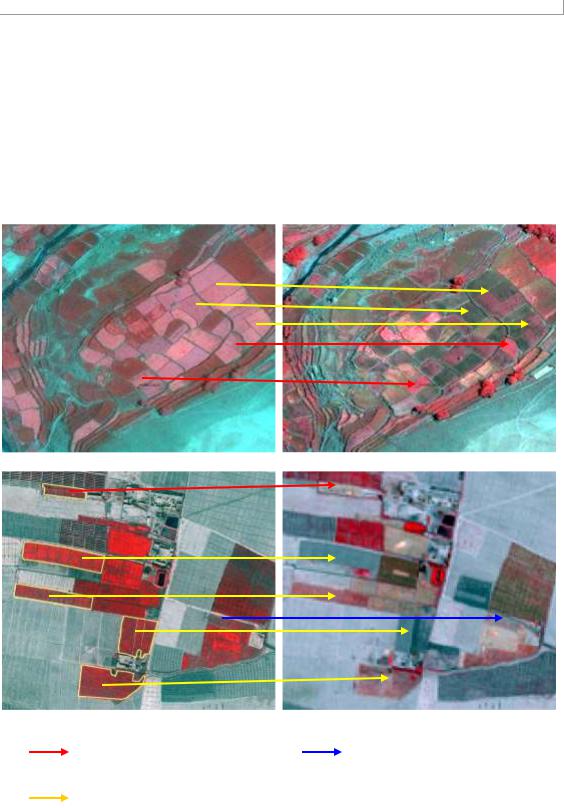
points and aerial photographs. Interpretation of images in Badghis and Zabul was more difficult since the spectral signatures of opium poppy were not as clear as in Hilmand, Kandahar, Uruzgan and Nangarhar. The second-dated images were useful to distinguish poppy from barley, wheat and grapes in certain provinces, namely Kabul, Kandahar and Nangarhar, particularly where the firstdated images were acquired late during the senescence stage. The second-dated (post-harvest) images were therefore useful in confirming whether the opium poppy on the first-dated images had been correctly identified. Image acquisition at two different times (preand post-harvest) is thus proven to be essential in such cases.
Figure 25: Advantage of two-dated images, Kabul and Kandahar, 2009
Pre-harvest image |
Post-harvest image |
Non-poppy field |
Poppy field missed in |
identified as poppy |
first-dated image |
Poppy fields confirmed with second-dated image
6.2.2.4Quality control
A quality control mechanism was applied to the image interpretation process, with each analyst’s work being checked by two other experts. Both first-dated and second-dated images were crosschecked.
All fields determined as likely to be under opium cultivation (potential opium poppy fields) were delineated on the basis of the interpretation of first-dated satellite imagery. In some cases a second-dated image was acquired for the purpose of confirmation. The corrections involved a few commissions and omissions.
56

Afghanistan Opium Survey 2014
6.3 Opium yield and production
6.3.1Estimating opium yield
The relationship between poppy capsule volume per square metre and dry opium yield is used to estimate opium production.35 It takes the form of a non-rectangular hyperbola.
Non-rectangular hyperbola formula for opium yield as function of capsule volume: Y = [(VC + 1495) – ((VC + 1495)2 – 395.259 VC)0.5] / 1.795
where
Y = Dry opium gum yield (kg/ha), and
VC = Mature capsule volume (cm3/m2).
In the yield survey, data on the number of yield capsules per plot and capsule volume are collected. The survey follows the procedure established in the UNODC Guidelines for Yield Assessment.
An imaginary transect was drawn on each surveyed field, along which three one-metre square plots were selected. In each plot, the number of flower buds, flowers, immature capsules and mature capsules that were expected to yield opium were counted, and the diameter and height of 10 to 15 opium-yielding capsules were measured with a calliper. The capsule volume per square metre was calculated with these data and entered into the formula for the yield calculation. Each plot thus provided one yield observation. The simple average of the three plots in a field is the field yield. The simple average of all fields in a region is the regional yield. A range was calculated to express the uncertainty of the yield estimate due to sampling with the 95% confidence interval.
Table 30: Regional opium yield values with 95% confidence intervals, 2014 (Kilograms per hectare)
|
REGION |
|
|
Best estimate |
|
|
Lower bound |
|
|
Upper bound |
|
|
|
|
|
|
|
|
|
|
|
|
|
|
Central |
48.5 |
|
43.6 |
|
53.5 |
|
||||
|
|
|
|
|
|
|
|
||||
|
Eastern |
39.6 |
|
28.3 |
|
50.8 |
|
||||
|
|
|
|
|
|
|
|
||||
|
North-eastern |
38.2 |
|
34.1 |
|
42.4 |
|
||||
|
|
|
|
|
|
|
|
||||
|
Northern |
34.5 |
|
27.1 |
|
41.9 |
|
||||
|
|
|
|
|
|
|
|
||||
|
Southern |
29.5 |
|
25.0 |
|
34.0 |
|
||||
|
|
|
|
|
|
|
|
||||
|
Western |
20.4 |
|
16.9 |
|
23.9 |
|
||||
|
|
|
|
|
|
|
|
|
|
|
|
|
National weighted by |
|
|
28.7 |
|
|
23.8 |
|
|
33.6 |
|
|
opium cultivation |
|
|
|
|
|
|
|
|||
|
|
|
|
|
|
|
|
|
|
|
|
|
|
|
|
|
|
|
|
|
|
|
|
6.3.2Changes to the yield survey and data quality
Since 2012, the yield survey has been significantly reduced in comparison to previous years. Due to the increasingly difficult security situation, only fields where it was possible to complete the survey without time pressure were visited. Furthermore, training was improved and surveyors worked in pairs rather than alone. The survey is therefore no longer statistically representative.
To further enhance data quality, data quality checks developed with external experts were applied. The statistical tests developed in 201136 were applied to the capsule measurements, i.e. to the values reported regarding height and diameter, and thus the resulting capsule volumes. Regarding the number of capsules contributing to yield per plot, no systematic tests are available.
35UNODC Guidelines for yield assessment of opium gum and coca leaf from brief field visits, UN New York, 2001, ST/NAR/33. See also UNODC (2003): Limited opium yield assessment surveys. Technical report: Observations and findings. Guidance for future activities. In: Scientific and Technical Notes, SCITEC/19, December 2003.
36See MCN/UNODC Afghanistan Opium Survey 201, December 2011, page 95.
57

Afghanistan Opium Survey 2014
The results showed that data continued to be of a high quality. In 2014, only data collected in one single village in Badakhsan (3 fields) had to be excluded. MCN and UNODC continue to work on improving the yield surveys.
Table 31: Yield survey villages and fields surveyed (all data), 2009-2014
|
2009 |
2010 |
2011 |
2012 |
2013 |
2014 |
|
|
|
|
|
|
|
Number of villages |
248 |
240 |
232 |
41 |
48 |
45 |
|
|
|
|
|
|
|
Number of fields (max. 3 per village) |
699 |
685 |
685 |
114 |
142 |
134 |
|
|
|
|
|
|
|
Number of plots (3 per field) |
2,415 |
2,040 |
2,055 |
342 |
426 |
401 |
|
|
|
|
|
|
|
Number of capsules measured |
26,901 |
20,474 |
20,769 |
3,211 |
4,009 |
3,474 |
|
|
|
|
|
|
|
6.3.3Estimating opium production
Opium production was calculated by the estimated regional area under opium cultivation being multiplied by the corresponding regional opium yield. All opium estimates in this report are expressed in oven-dry opium equivalent, i.e. the opium is assumed to contain 0% moisture. The same figure expressed in air-dry opium, i.e. opium under “normal” conditions as traded, would be higher as such air-dry opium contains some moisture.
The point estimates and uncertainties of the opium production estimate due to sampling of the area under poppy cultivation and yield can be expressed as ap ± a and yp ± y, respectively, where the uncertainty is determined from the 95% confidence intervals.
These uncertainties will impact on the estimate of production (pp ± p, or equivalently expressed as the range (pp - p , pp+ p)), where the best estimate pp = ap yp, such that
p
p p
|
|
|
|
|
|
|
|
|
|
1 |
|
|
|
|
|
2 |
|
|
|
|
2 |
|
|
|
a |
|
|
y |
2 |
||||||
|
|
|
|
|
|
||||||
|
|
|
|
|
|
|
|
|
|
||
|
a |
|
|
|
y |
|
|
|
|||
|
|
p |
|
|
|
p |
|
||||
|
|
|
|
|
|
|
|
||||
|
|
|
|
|
|
|
|
|
|
||
expresses the error in production, p , resulting from uncertainty in the estimates for cultivation area and yield.
For targeted regions there is no sampling error in the area under cultivation. In such cases, the error in production relates only to the uncertainty in the yield and is given by p = pp y / yp.
6.3.4Estimating heroin production
The proportion of opium converted into morphine and heroin was derived from seizure data in Afghanistan and its neighbouring countries. A three-year average of all reported amounts was taken. In order to estimate the share of opium converted to heroin, all heroin and morphine seizures are converted into opium equivalents by applying the opium to heroin conversion ratio for heroin of export quality.
As seizures are often driven by pure chance and seizure data have some inherent uncertainties, changes should be interpreted with caution. Information from the CNPA laboratory indicates that not all assumed seizures of heroin turn out to actually contain heroin, or they contain heroin in combination with various other substances.37 This is rather typical for seizures and not specific only to Afghanistan.
37 Counter Narcotics Police of Afghanistan, Forensic Laboratory/UNODC (2008): Laboratory Information Bulletin 12/2008 (LIB IV/2008). http://www.unodc.org/pdf/scientific/LIB%20IV-2008_Kabul-.pdf.
58

Afghanistan Opium Survey 2014
Table 32: Proportions of opiate seizures in Afghanistan and neighbouring countries
(Percentage)
|
Distribution |
|
|
2010 |
|
|
2011 |
|
|
2012 |
|
|
Average 2010-2012 weighted by |
|
|
|
|
|
|
|
|
|
|
amounts seized |
|
||||
|
|
|
|
|
|
|
|
|
|
|
|
|
|
|
|
Opium |
63% |
|
50% |
|
41% |
|
52% |
|
|||||
|
|
|
|
|
|
|
|
|
|
|
|
|
|
|
|
Heroin and morphine |
37% |
|
50% |
|
59% |
|
48% |
|
|||||
|
combined |
|
|
|
|
|||||||||
|
|
|
|
|
|
|
|
|
|
|
|
|
||
6.4 Verification of Governor-led eradication (GLE)
UNODC/MCN has improved field-based verification activities since 2010 by enhancing the control mechanism. The areas verified by eradication verifiers were randomly checked by the team leader and UNODC/MCN survey coordinators for validation of the reported figures. A total of 124 eradication verifiers were trained in eradication verification techniques and deployed in a phased manner to provinces where eradication activities were envisaged. The eradication verifiers were part of the eradication teams led by the respective provincial governor. Verifiers reported to the office of Provincial Governors in the last week of February 2013.
Verification methodology for GLE:
Eradication verifiers were part of the Governor-led eradication teams.
The verifiers took measurements of each eradicated field by their pace length, converted them into metres and calculated the area in jerib (1 jerib=2000 m2), collected field coordinates using new GPS cameras and took photographs.
The verifiers drew sketch maps of each field as a reference for area calculations.
The verification-reporting officers in Kabul obtained the provisional data from the verifiers by telephone (mobile/satellite phones) and updated the database on a daily basis.
The verifiers filled in hardcopy survey forms and submitted them to UNODC regional offices. The forms were then sent to the Kabul office for data entry. Quality control was undertaken by MCN/UNODC survey coordinators at the regional level. Eradicated fields were revisited randomly by team leaders and MCN/UNODC survey coordinators to check the accuracy of the reports. Further validation of the results was done using data obtained through helicopter flights, as well as from satellite imagery, to calculate the final area of eradicated poppy fields wherever possible.
In Hilmand province, the area calculations of the eradicated poppy fields was facilitated by calculating the area of fields automatically using a standard template in Excel file, thus avoiding manual calculation errors at the field level.
MCN/UNODC published periodical reports on a weekly basis to inform stakeholders of eradication activities. The eradication figures provided in these reports were considered provisional until they were finalized based on field checks and/or checks based on the satellite image interpretation.
6.5Average farm-gate price and farm-gate value of opium
production
Since 2009, farm-gate prices at harvest time have been derived from the opium price monitoring system and refer to the month when opium harvesting actually took place in the different regions of the country, which is thought to reflect opium prices at harvest time better. To calculate the national average price, regional price averages were weighted by regional opium production. The opium price in the Central region was calculated from the annual village survey, as there is no monthly opium price monitoring in that region.
The farm-gate value of opium production is the product of potential opium production at the national level multiplied by the weighted average farm-gate price of dry opium at harvest time. The upper and lower limits of the range of the farm-gate value were determined by using the upper and lower opium production estimate.
59
Afghanistan Opium Survey 2014
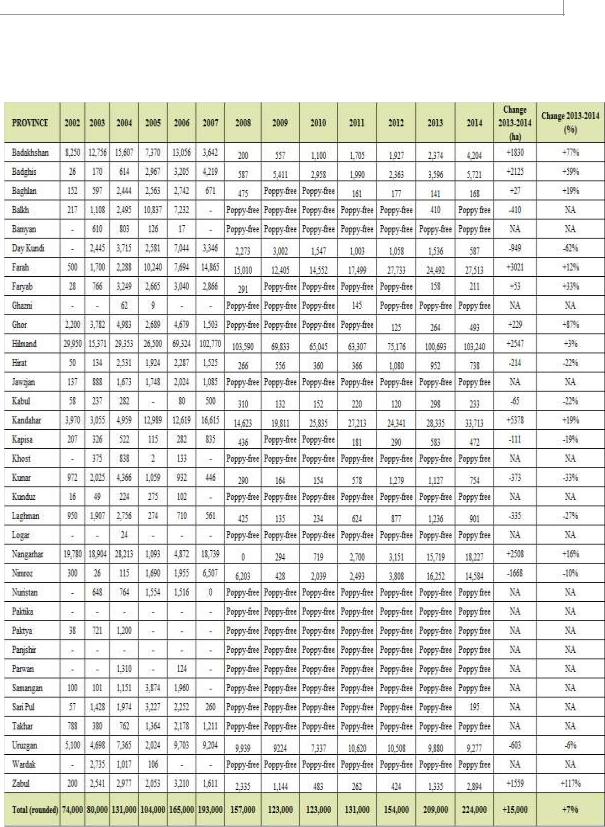
ANNEX I: OPIUM POPPY CULTIVATION PER PROVINCE, 2002-2013 (HECTARES)
60