

Accounting For Dummies, 4th edition
.pdf100 Part II: Figuring Out Financial Statements
Note: Figure 5-1 is not — I repeat not — a balance sheet. The balance sheet for this business is presented later in the chapter (see Figure 5-2). Businesses do not report a summary of changes in assets, liabilities, and owners’ equity such as the one that I show in Figure 5-1 (although personally I think that such a summary would be helpful to users of financial reports). The purpose of Figure 5-1 is to leave a trail of how the three major types of transactions during the year change the assets, liabilities, and owner’s equity accounts of the business during the year.
The 2009 income statement of the business in the example is shown in Figure 4-1 in Chapter 4. You may want to flip back to this financial statement. On sales revenue of $26 million, the business earned $1.69 million bottom-line profit (net income) for the year. The sales and expense transactions of the business during the year plus the allied transactions connected with sales and expenses cause the changes shown in the operating activities column
in Figure 5-1. You can see in Figure 5-1 that the $1.69 million net income has increased the business’s owners’ equity–retained earnings by the same amount.
The operating activities column in Figure 5-1 is worth lingering over for a few moments because the financial outcomes of making profit are seen in this column. In my experience, most people see a profit number, such as the $1.69 million in this example, and stop thinking any further about the financial outcomes of making the profit. This is like going to a movie because you like its title, but you don’t know anything about the plot and characters. You probably noticed that the $1,515,000 increase in cash in this column differs from the $1,690,000 net income figure for the year. That’s because the cash effect of making profit (which includes the allied transactions connected with sales and expenses) is almost always different than the net income amount for the year. Chapter 6 on cash flows explains this difference.
The summary of changes presented in Figure 5-1 gives a sense of the balance sheet in motion, or how the business got from the start of the year to the end of the year. It’s very important to have a good sense of how transactions propel the balance sheet. A summary of balance sheet changes, such as shown in Figure 5-1, can be helpful to business managers who plan and control changes in the assets and liabilities of the business. They need a clear understanding of how the two basic types of transactions change assets and liabilities. Also, Figure 5-1 provides a useful platform for the statement of cash flows, which I explain in Chapter 6.
Presenting a Balance Sheet
Figure 5-2 presents a two-year, comparative balance sheet for the business example that I introduce in Chapter 4. The balance sheet is at the close of business, December 31, 2008 and 2009. In most cases financial statements are not completed and released until a few weeks after the balance sheet date.
Chapter 5: Reporting Assets, Liabilities, and Owners’ Equity 101
Therefore, by the time you would read this financial statement it’s already out of date, because the business has continued to engage in transactions since December 31, 2009. (Managers of a business get internal financial statements much sooner.) When substantial changes have occurred in the interim, a business should disclose these developments in its financial report.
When a business does not release its annual financial report within a few weeks after the close of its fiscal year, you should be alarmed. There are reasons for such a delay, and the reasons are all bad. One reason might be that the business’s accounting system is not functioning well and the controller (chief accounting officer) has to do a lot of work at year-end to get the accounts up to date and accurate for preparing the financial statements. Another reason is that the business is facing serious problems and can’t decide on how to account for the problems. Perhaps a business may be delaying the reporting of bad news. Or the business may have a serious dispute with its independent CPA auditor that has not been resolved (see Chapter 15 where I explain audits).
Figure 5-2:
The balance sheets of a business at the end of its two most recent years.
Typical Business, Inc.
Statement of Financial Condition
at December 31, 2008 and 2009
(Dollar amounts in thousands)
Assets |
|
|
2008 |
|
2009 |
Cash |
$2,275 |
|
$2,165 |
||
Accounts receivable |
$2,150 |
|
$2,600 |
||
Inventory |
$2,725 |
|
$3,450 |
||
Prepaid expenses |
$525 |
|
$600 |
||
Current assets |
$7,675 |
|
$8,815 |
||
Property, plant, and equipment |
$11,175 |
|
$12,450 |
||
Accumulated depreciation |
($5,640) |
|
($6,415) |
||
Net of depreciation |
$5,535 |
|
$6,035 |
||
Total assets |
$13,210 |
|
$14,850 |
||
|
|
|
|
|
|
Liabilities and Owners’ Equity |
|
|
2008 |
|
2009 |
Accounts payable |
$640 |
|
$765 |
||
Accrued expenses payable |
$750 |
|
$900 |
||
Income tax payable |
$90 |
|
$115 |
||
Short-term notes payable |
$2,150 |
|
$2,250 |
||
Current liabilities |
$3,630 |
|
$4,030 |
||
Long-term notes payable |
$3,850 |
|
$4,000 |
||
Owners’ equity: |
|
|
|
||
Invested capital |
$3,100 |
|
$3,250 |
||
Retained earnings |
$2,630 |
|
$3,570 |
||
Total owners’ equity |
$5,730 |
|
$6,820 |
||
Total liabilities and owners’ equity |
$13,210 |
|
$14,850 |
||
|
|
|
|
|
|
102 Part II: Figuring Out Financial Statements
In reading through a balance sheet such as the one shown in Figure 5-2, you may notice that it doesn’t have a punch line like the income statement does. The income statement’s punch line is the net income line, which is rarely humorous to the business itself but can cause some snickers among analysts. You can’t look at just one item on the balance sheet, murmur an appreciative “ah-ha,” and rush home to watch the game. You have to read the whole thing (sigh) and make comparisons among the items. Chapters 13 and 17 offer more information on interpreting financial statements.
Notice in Figure 5-2 that the beginning and ending balances in the assets, liabilities, and owner’s equity accounts are the same as in Figure 5-1. The balance sheet in Figure 5-2 discloses the original cost of the company’s fixed assets and the accumulated depreciation recorded over the years since acquisition of the assets, which is standard practice. (Figure 5-1 presents only the net book value of its fixed assets, which equals original cost minus accumulated depreciation.)
The balance sheet is unlike the income and cash flow statements, which report flows over a period of time (such as sales revenue that is the cumulative amount of all sales during the period). The balance sheet presents the balances (amounts) of a company’s assets, liabilities, and owners’ equity at an instant in time. Notice the two quite different meanings of the term balance. As used in balance sheet, the term refers to the equality of the two opposing sides of a business — total assets on the one side and total liabilities and owners’ equity on the other side, like a scale with equal weights on both sides. In contrast, the balance of an account (asset, liability, owners’ equity, revenue, and expense) refers to the amount in the account after recording increases and decreases in the account — the net amount after all additions and subtractions have been entered. Usually, the meaning of the term is clear in context.
An accountant can prepare a balance sheet at any time that a manager wants to know how things stand financially. Some businesses — particularly financial institutions such as banks, mutual funds, and securities brokers — need balance sheets at the end of each day, in order to track their day-to-day financial situation. For most businesses, however, balance sheets are prepared only at the end of each month, quarter, and year. A balance sheet is always prepared at the close of business on the last day of the profit period. In other words, the balance sheet should be in sync with the income statement.
Kicking balance sheets out into the real world
The statement of financial condition, or balance sheet, shown earlier in Figure 5-2 is about as lean and mean as you’ll ever read. In the real world many businesses are fat and complex. Also, I should make clear that
Figure 5-2 shows the content and format for an external balance sheet, which
Chapter 5: Reporting Assets, Liabilities, and Owners’ Equity 103
means a balance sheet that is included in a financial report released outside a business to its owners and creditors. Balance sheets that stay within a business can be quite different.
Internal balance sheets
For internal reporting of financial condition to managers, balance sheets include much more detail, either in the body of the financial statement itself or, more likely, in supporting schedules. For example, just one cash account is shown in Figure 5-2, but the chief financial officer of a business needs to know the balances on deposit in each of the business’s checking accounts.
As another example, the balance sheet shown in Figure 5-2 includes just one total amount for accounts receivable, but managers need details on which customers owe money and whether any major amounts are past due. Greater detail allows for better control, analysis, and decision-making. Internal balance sheets and their supporting schedules should provide all the detail that managers need to make good business decisions. See Chapter 14 for more detail on how business managers use financial reports.
External balance sheets
Balance sheets presented in external financial reports (which go out to investors and lenders) do not include much more detail than the balance sheet shown in Figure 5-2. However, external balance sheets must classify (or group together) short-term assets and liabilities. For this reason, external balance sheets are referred to as classified balance sheets.
Let me make clear that the CIA does not vet balance sheets to keep secrets from being disclosed that would harm national security. The term classified, when applied to a balance sheet, does not mean restricted or top secret; rather, the term means that assets and liabilities are sorted into basic classes, or groups, for external reporting. Classifying certain assets and liabilities into current categories is done mainly to help readers of a balance sheet more easily compare current assets with current liabilities for the purpose of judging the short-term solvency of a business.
Judging solvency
Solvency refers to the ability of a business to pay its liabilities on time. Delays in paying liabilities on time can cause very serious problems for a business. In extreme cases, a business can be thrown into involuntary bankruptcy. Even the threat of bankruptcy can cause serious disruptions in the normal operations of a business, and profit performance is bound to suffer. If current liabilities become too high relative to current assets — which constitute the first line of defense for paying current liabilities — managers should move quickly to resolve the problem. A perceived shortage of current assets relative to current liabilities could ring alarm bells in the minds of the company’s creditors and owners.

104 Part II: Figuring Out Financial Statements
Therefore, notice in Figure 5-2 the following groupings (dollar amounts refer to year-end 2009):
The first four asset accounts (cash, accounts receivable, inventory, and prepaid expenses) are added to give the $8,815,000 subtotal for current assets.
The first four liability accounts (accounts payable, accrued expenses payable, income tax payable, and short-term notes payable) are added to give the $4.03 million subtotal for current liabilities.
The total interest-bearing debt of the business is separated between $2.25 million in short-term notes payable and $4 million in long-term notes payable. (In Figure 5-1, only one total amount for all interest-bearing debt is given, which is $6.25 million.)
The following sections offer more detail about current assets and liabilities.
Current (short-term) assets
Short-term, or current, assets include:
Cash
Marketable securities that can be immediately converted into cash
Assets converted into cash within one operating cycle
The operating cycle refers to the repetitive process of putting cash into inventory, holding products in inventory until they are sold, selling products on credit (which generates accounts receivable), and collecting the receivables in cash. In other words, the operating cycle is the “from cash — through inventory and accounts receivable — back to cash” sequence. The operating cycles of businesses vary from a few weeks to several months, depending on how long inventory is held before being sold and how long it takes to collect cash from sales made on credit.
Current (short-term) liabilities
Short-term, or current, liabilities include non-interest-bearing liabilities that arise from the operating (sales and expense) activities of the business. A typical business keeps many accounts for these liabilities — a separate account for each vendor, for instance. In an external balance sheet you usually find only three or four operating liabilities, and they are not labeled as non-interest-bearing. It is assumed that the reader knows that these operating liabilities don’t bear interest (unless the liability is seriously overdue and the creditor has started charging interest because of the delay in paying the liability).

Chapter 5: Reporting Assets, Liabilities, and Owners’ Equity 105
The balance sheet example shown in Figure 5-2 discloses three operating liabilities: accounts payable, accrued expenses payable, and income tax payable. Be warned that the terminology for these short-term operating liabilities varies from business to business.
In addition to operating liabilities, interest-bearing notes payable that have maturity dates one year or less from the balance sheet date are included in the current liabilities section. The current liabilities section may also include certain other liabilities that must be paid in the short run (which are too varied and technical to discuss here).
Current ratio
The sources of cash for paying current liabilities are the company’s current assets. That is, current assets are the first source of money to pay current liabilities when these liabilities come due. Remember that current assets consist of cash and assets that will be converted into cash in the short run. To size up current assets against total current liabilities, the current ratio is calculated. Using information from the company’s balance sheet (refer to Figure 5-2), you compute its year-end 2009 current ratio as follows:
$8,815,000 current assets ÷ $4,030,000 current liabilities = 2.2 current ratio
Generally, businesses do not provide their current ratio on the face of their balance sheets or in the footnotes to their financial statements — they leave it to the reader to calculate this number. On the other hand, many businesses present a financial highlights section in their financial report, which often includes the current ratio.
Folklore has it that a company’s current ratio should be at least 2.0. However, business managers know that an acceptable current ratio depends a great deal on general practices in the industry for short-term borrowing. Some businesses do well with a current ratio less than 2.0, so take the 2.0 benchmark with a grain of salt. A lower current ratio does not necessarily mean that the business won’t be able to pay its short-term (current) liabilities on time. Chapters 13 and 17 explain solvency in more detail.
Preparing multiyear statements
The three primary financial statements of a business, including the balance sheet, are generally reported in a twoor three-year comparative format. To give you a sense of comparative financial statements, I present a two-year comparative format for the balance sheet in Figure 5-2. Twoor three-year comparative financial statements are de rigueur in filings with the Securities
106 Part II: Figuring Out Financial Statements
and Exchange Commission (SEC). Public companies have no choice, but private businesses are not under the SEC’s jurisdiction. Generally accepted accounting principles (GAAP) favor presenting comparative financial statements for two or more years, but I’ve seen financial reports of private businesses that do not present information for prior years.
The main reason for presenting twoor three-year comparative financial statements is for trend analysis. The business’s managers, as well as its outside investors and creditors, are extremely interested in the general trend of sales, profit margins, ratio of debt to equity, and many other vital signs of the business. Slippage in the ratio of gross margin to sales from year to year, for example, is a very serious matter.
Coupling the Income Statement
and Balance Sheet
Chapter 4 explains that sales and expense transactions change certain assets and liabilities of a business (which are summarized in Figure 5-1). Even in the relatively straightforward business example introduced in Chapter 4, we see that cash and four other assets are involved, and three liabilities are involved in the profit-making activities of a business. I explore these key interconnections between revenue and expenses and the assets and liabilities of a business here. It turns out that the profit-making activities of a business shape a large part of its balance sheet.
Figure 5-3 shows the vital links between sales revenue and expenses and the assets and liabilities that are driven by these profit-seeking activities. Please note that I do not include cash in Figure 5-3. Sooner or later, sales and expenses flow through cash; cash is the pivotal asset of every business. Chapter 6 examines cash flows and the financial statement that reports the cash flows of a business. Here I focus on the non-cash assets of a business, as well as its liabilities and owners’ equity accounts that are directly affected by sales and expenses. You may be anxious to examine cash flows, but as we say in Iowa, “Hold your horses.” I’ll get to cash in Chapter 6.
The income statement in Figure 5-3 continues the same business example I introduce in Chapter 4. It’s the same income statement but with one modification. Notice that the depreciation expense for the year is taken out of selling, general, and administrative expenses. We need to see depreciation expense on a separate line.
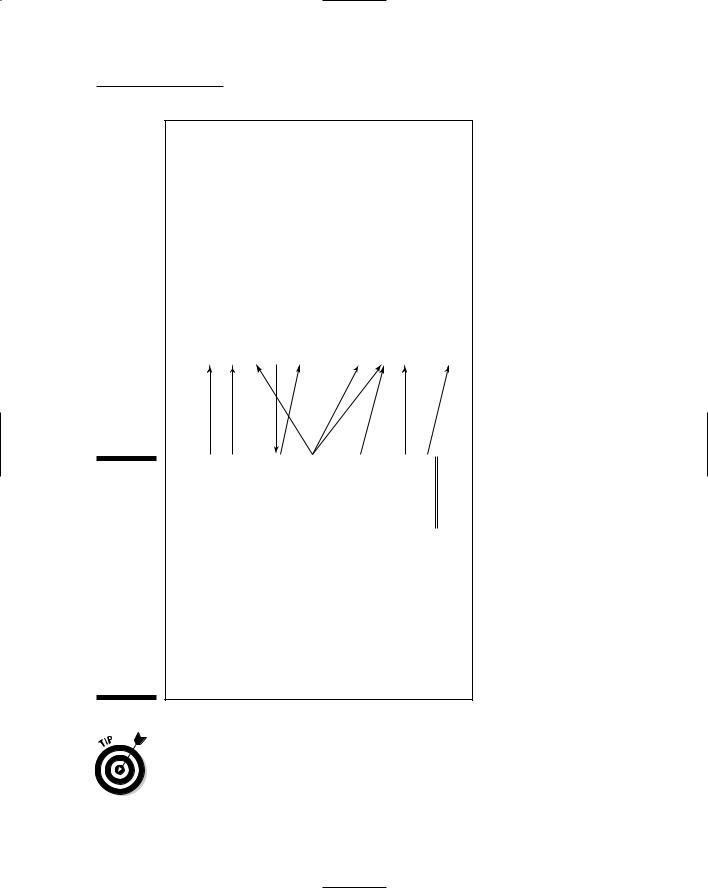
Figure 5-3:
The connections between sales revenue and expenses and the noncash assets and liabilities driven by these profitmaking activities.
Chapter 5: Reporting Assets, Liabilities, and Owners’ Equity 107
|
$2,600,000 |
$3,450,000 |
$600,000 |
$12,450,000 |
($6,415,000) |
|
$765,000 |
$900,000 |
$115,000 |
|
|
Non-Cash Assets |
Accounts receivable |
Inventory |
Prepaid expenses |
Fixed assets, at original cost |
Accumulated depreciation |
Liabilities |
Accounts payable |
Accrued expenses payable |
Income tax payable |
Owners‘ Equity |
Retained earnings |
|
$26,000,000 |
14,300,000 |
|
$11,700,000 |
775,000 |
7,925,000 |
|
$3,000,000 |
400,000 |
|
$2,600,000 |
910,000 |
|
$1,690,000 |
Income Statement |
Sales revenue |
Cost of goods sold expense |
|
Gross margin |
Depreciation expense |
Selling, general, and administrative expenses |
|
Operating earnings |
Interest expense |
|
Earnings before income tax |
Income tax expense |
|
Net income |
|
|
|
|
Figure 5-3 highlights the key connections between particular assets and liabilities and sales revenue and expenses. Business managers need a good understanding of these connections to control assets and liabilities. And outside investors and creditors should understand these connections to interpret the financial statements of a business (see Chapters 13 and 17).

108 Part II: Figuring Out Financial Statements
Turning over assets
Assets should be turned over, or put to use, by making sales. The higher the turnover — the more times the assets are used, and then replaced — the better, because every sale is a profit-making opportunity. The asset turnover ratio compares annual sales revenue with total assets. In our business example, the company’s asset turnover ratio is computed as follows for the year 2009 (using relevant data from Figures 5-2 and 5-3):
$26,000,000 annual sales revenue ÷ $14,850,000 total assets = 1.75 asset turnover ratio
Some industries are very capital-intensive, which means that they have low asset turnover ratios; they need a lot of assets to support their sales. For example, gas and electric utilities are capital-intensive. Many retailers, on the other hand, do not need a lot of assets to make sales. Their asset turnover ratios are relatively high; their annual sales are three, four, or five times their assets. Our business example that has a 1.75 asset turnover ratio falls in the broad middle range of businesses that sell products.
Sizing up assets and liabilities
Although the business example I use in this chapter is hypothetical, I didn’t make up the numbers at random. For the example, I use a modest-sized business that has $26 million in annual sales revenue. The other numbers in its income statement and balance sheet are realistic relative to each other. I assume that the business earns 45 percent gross margin ($11.7 million gross margin ÷ $26 million sales revenue = 45 percent), which means its cost of goods sold expense is 55 percent of sales revenue. The sizes of particular assets and liabilities compared with their relevant income statement numbers vary from industry to industry, and even from business to business in the same industry.
Based on its history and operating policies, the managers of a business can estimate what the size of each asset and liability should be, which provide very useful control benchmarks against which the actual balances of the assets and liabilities are compared, to spot any serious deviations. In other words, assets (and liabilities, too) can be too high or too low relative to the sales revenue and expenses that drive them, and these deviations can cause problems that managers should try to correct.
For example, based on the credit terms extended to its customers and the company’s actual policies regarding how aggressively it acts in collecting past-due receivables, a manager determines the range for the proper, or within-the-boundaries, balance of accounts receivable. This figure is the control benchmark. If the actual balance is reasonably close to this control
Chapter 5: Reporting Assets, Liabilities, and Owners’ Equity 109
benchmark, accounts receivable is under control. If not, the manager should investigate why accounts receivable is smaller or larger than it should be.
The following sections discuss the relative sizes of the assets and liabilities in the balance sheet that result from sales and expenses (for the fiscal year 2009). The sales and expenses are the drivers, or causes, of the assets and liabilities. If a business earned profit simply by investing in stocks and bonds, it would not need all the various assets and liabilities explained in this chapter. Such a business — a mutual fund, for example — would have just one income-producing asset: investments in securities. This chapter focuses on businesses that sell products on credit.
Sales revenue and accounts receivable
In Figure 5-3 annual sales revenue for the year 2009 is $26 million. The yearend accounts receivable is one-tenth of this, or $2.6 million. The average customer’s credit period is roughly 36 days: 365 days in the year times the 10 percent ratio of ending accounts receivable balance to annual sales revenue. Of course, some customers’ balances are past 36 days, and some are quite new; you want to focus on the average. The key question is whether a customer credit period averaging 36 days is reasonable.
Suppose that the business offers all customers a 30-day credit period, which is fairly common in business-to-business selling (although not for a retailer selling to individual consumers). The relatively small deviation of about 6 days (36 days average credit period versus 30 days normal credit terms) probably is not a significant cause for concern. But suppose that, at the end of the period, the accounts receivable had been $3.9 million, which is 15 percent of annual sales, or about a 55-day average credit period. Such an abnormally high balance should raise a red flag; the responsible manager should look into the reasons for the abnormally high accounts receivable balance. Perhaps several customers are seriously late in paying and should not be extended new credit until they pay up.
Cost of goods sold expense and inventory
In Figure 5-3 the cost of goods sold expense for the year 2009 is $14.3 million. The year-end inventory is $3.45 million, or about 24 percent. In rough terms, the average product’s inventory holding period is 88 days — 365 days in the year times the 24 percent ratio of ending inventory to annual cost of goods sold. Of course, some products may remain in inventory longer than the 88-day average, and some products may sell in a much shorter period than 88 days. You need to focus on the overall average. Is an 88-day average inventory holding period reasonable?