

Fin management materials / 4 P4AFM-Session06_j08
.pdfSESSION 06 – ADVANCED INVESTMENT APPRAISAL
Tax relief on loan interest |
|
|
|
|
|
|
|
Gross value of loan |
|
= $(180,000 + 3,673) |
|
||||
|
|
= $183,673 |
|
|
|
||
Annual repayments |
|
= |
|
$183,673 |
|
|
|
|
|
3yr a.f.@10% |
|
||||
|
|
= |
|
$183,673 |
|
|
|
|
|
2.487 |
|
|
|
||
|
|
|
|
|
|
||
|
|
= $73,853 |
|
|
|
||
Loan schedule |
|
|
|
|
|
|
|
|
Opening |
Interest |
Repay- |
Closing |
|||
|
balance |
|
|
|
ment |
balance |
|
|
$ |
|
$ |
$ |
$ |
||
Year 1 |
183,673 |
18,367 |
73,853 |
128,187 |
|||
Year 2 |
128,187 |
12,819 |
73,853 |
67,153 |
|||
Year 3 |
67,153 |
6,715 |
73,853 |
15 |
|||
(difference due to rounding)
Tax relief at 35% on interest (one year’s delay)
|
Cash |
10% |
PV |
|
$ |
factor |
$ |
Year 2 |
6,428 |
0.826 |
5,309 |
Year 3 |
4,487 |
0.751 |
3,370 |
Year 4 |
2,350 |
0.683 |
1,605 |
|
|
|
_______ |
|
|
|
10,284 |
|
|
|
_______ |
Adjusted Present Value |
|
|
|
|
|
|
$ |
Base NPV |
|
|
20,552 |
Issue costs |
|
|
(12,193) |
Tax shield |
|
|
10,284 |
|
|
|
_______ |
Project APV |
|
|
18,643 |
|
|
|
_______ |
0621

SESSION 06 – ADVANCED INVESTMENT APPRAISAL
Solution 2
Let |
a be the proportion invested in project A. |
|||
|
|
b be the proportion invested in project B. |
||
Subject to the constraints: |
|
|
||
Year 0 |
20,000a + 40,000b |
≤ |
40,000 |
|
Year 1 |
40,000a + 20,000b |
≤ |
50,000 |
|
Year 2 |
60,000a |
≤ |
40,000 |
|
0 |
≤ a ≤ 1 |
|
|
|
0 |
≤ b ≤ 1 |
|
|
|
The objective function:
Maximise NPV = 44,280a + 31,940b (W )
WORKING
NPV of projects
Time |
DF @ 10% |
Project A |
|
Project B |
|
|
|
Cash flow |
PV |
Cash flow |
PV |
|
|
$ |
$ |
$ |
$ |
0 |
1.00 |
(20,000) |
(20,000) |
(40,000) |
(40,000) |
1 |
0.909 |
(40,000) |
(36,360) |
(20,000) |
(18,180) |
2 |
0.826 |
(60,000) |
(49,560) |
− |
− |
3 |
0.751 |
200,000 |
150,200 |
120,000 |
90,120 |
|
|
|
_______ |
|
_______ |
|
|
|
44,280 |
|
31,940 |
|
|
|
_______ |
|
_______ |
0622
|
|
|
SESSION 06 – ADVANCED INVESTMENT APPRAISAL |
|
|
|
|
||
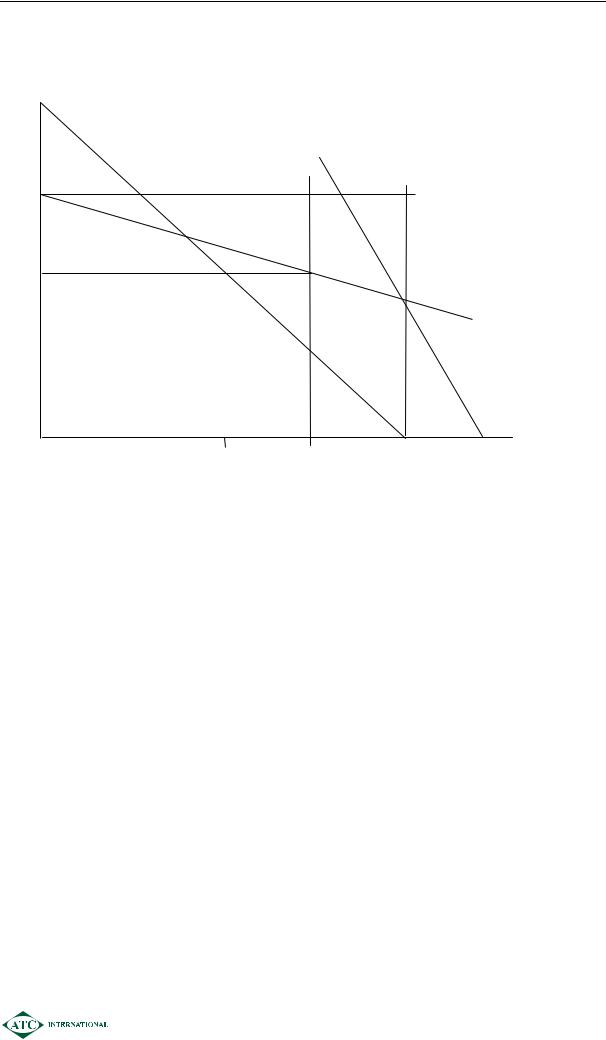
Graph |
|
|
||
|
x |
|
|
|
|
|
|
||
|
|
objective |
|
|
b |
|
|
40,000a + 20,000b ≤ 50,000 |
|
|
|
|||
1 |
x |
|
b = 1 |
|
20,000a + 40,000b = 40,000 |
||||
|
|
|||
|
|
|
O |
|
0.5 |
|
|
x a = 1 |
|
|
|
|
||
|
|
|
60,000a = 40,000 |
|
|
x |
|
x |
0.5 |
0.67 |
1 |
a |
To plot the objective function set it equal to (say) $44,280
44,280a + 31,940b = 44,280
when |
a = 0 |
b = 1.386 |
when |
b = 0 |
a = 1 |
Optimal solution
From the graph the objective function would appear to be maximised at point O. Reading off from the graph, this would comprise 2/3 of project A and 2/3 of project B.
0623

SESSION 06 – ADVANCED INVESTMENT APPRAISAL
Solution 3
T0 |
T1 |
T2 |
T3 |
T4 |
(34,000) |
7600 |
16,500 |
13,000 |
6,600 |
Future value of first year cash flow = 7600 × 1.083 = 9574
Future value of second year cash flow = 16500 × 1.082 = 19245
Future value of third year cash flow = 13000 × 1.08 = 14040
Total future value = 9574 + 19245 + 14040 + 6600 = 49459
MIRR = 4 3400049459 -1 = 9.82%
Solution 4
(a)
T0 |
T1 |
T2 |
T3 |
T4 |
|
(34,000) |
7600 |
16,500 |
13,000 |
6,600 |
|
Present Value |
7037 |
14146 |
10320 |
4851 |
|
Total present value of recovery phase = 36354 |
|
||||
Recovery = |
34000 |
× 4 = 3.73 years |
|
|
|
36354 |
|
|
|||
|
|
|
|
|
|
(b)
|
T1 |
T2 |
T3 |
T4 |
|
|
7600 |
16,500 |
13,000 |
6,600 |
|
Present Value |
7037 |
14146 |
10320 |
4851 |
Total = 36354 |
7037/36354 = |
0.194 |
0.389 |
0.284 |
0.133 |
Total = 1 |
Duration = (0.194) + (0.389×2) + (0.284×3) + (0.133×4)
= 2.356 years
0624

SESSION 06 – ADVANCED INVESTMENT APPRAISAL
Solution 5
(a)
The volatility attached to the NPV indicates that there are (z) standard deviations between the expected net present value and zero:
Z = |
1.964 |
- 0 |
= 1.9255 |
1.02 |
|
||
|
|
|
From the published tables this gives an area of approximately 0.473 i.e. a probability of 0.5- 0.475 = 2.7%
(b)
At the 95% confidence level z = 1.645.
VAR = 1.645 × 1.02 × √10 = $5.3m
VAR (99% confidence) = 2.33 × 1.02 × √10 = $7.51m
0625

SESSION 06 – ADVANCED INVESTMENT APPRAISAL
0626