Книги по МРТ КТ на английском языке / MRI for Orthopaedic Surgeons Khanna ed 2010
.pdf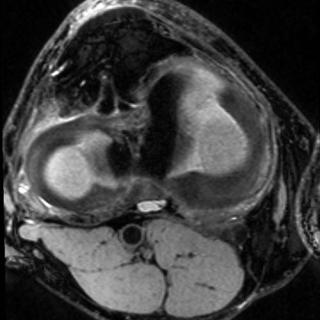 B
B
 B
B
 B
B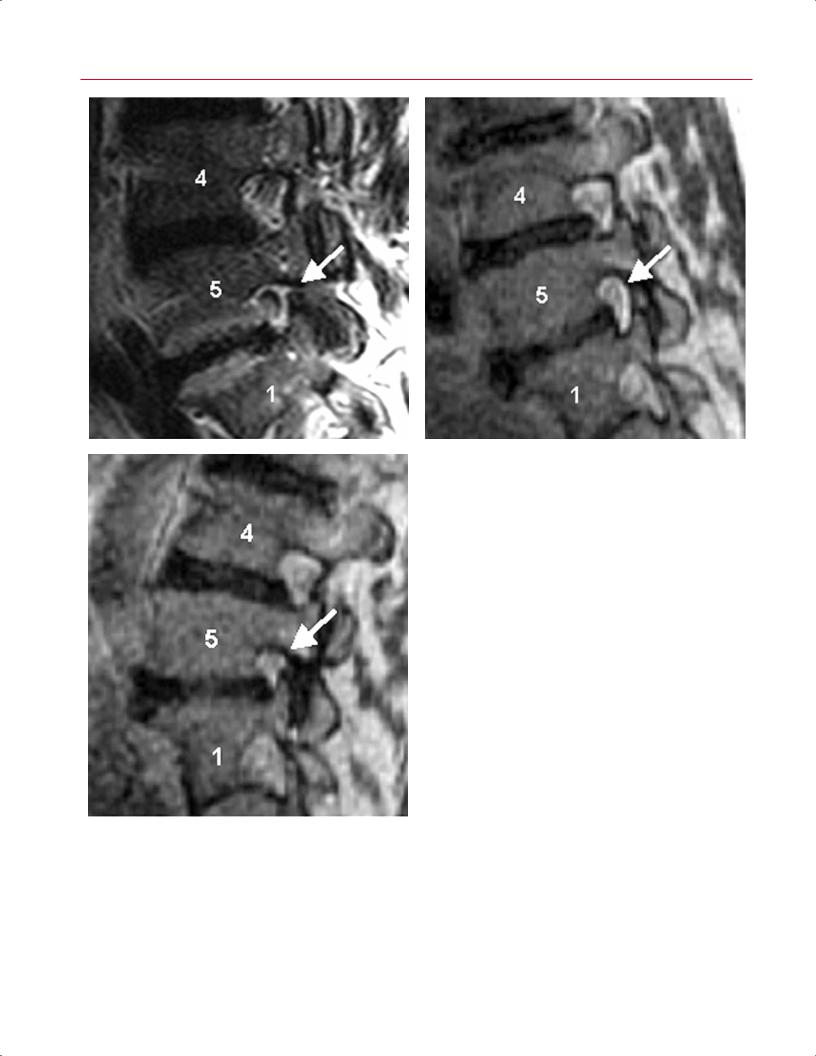
404 V Special Considerations
A B
|
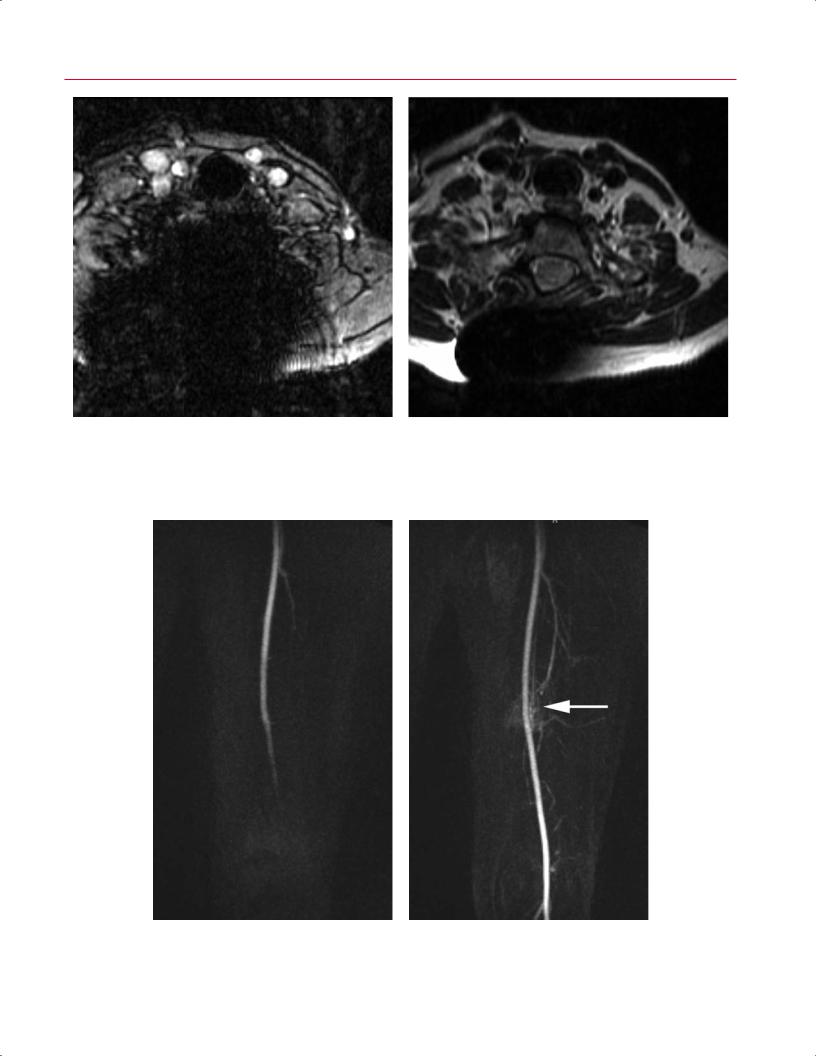
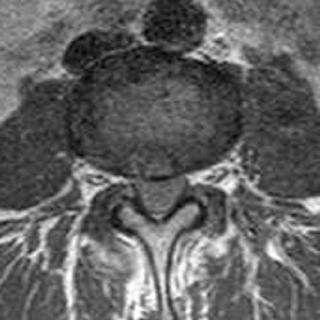
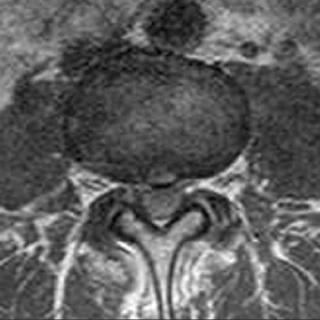
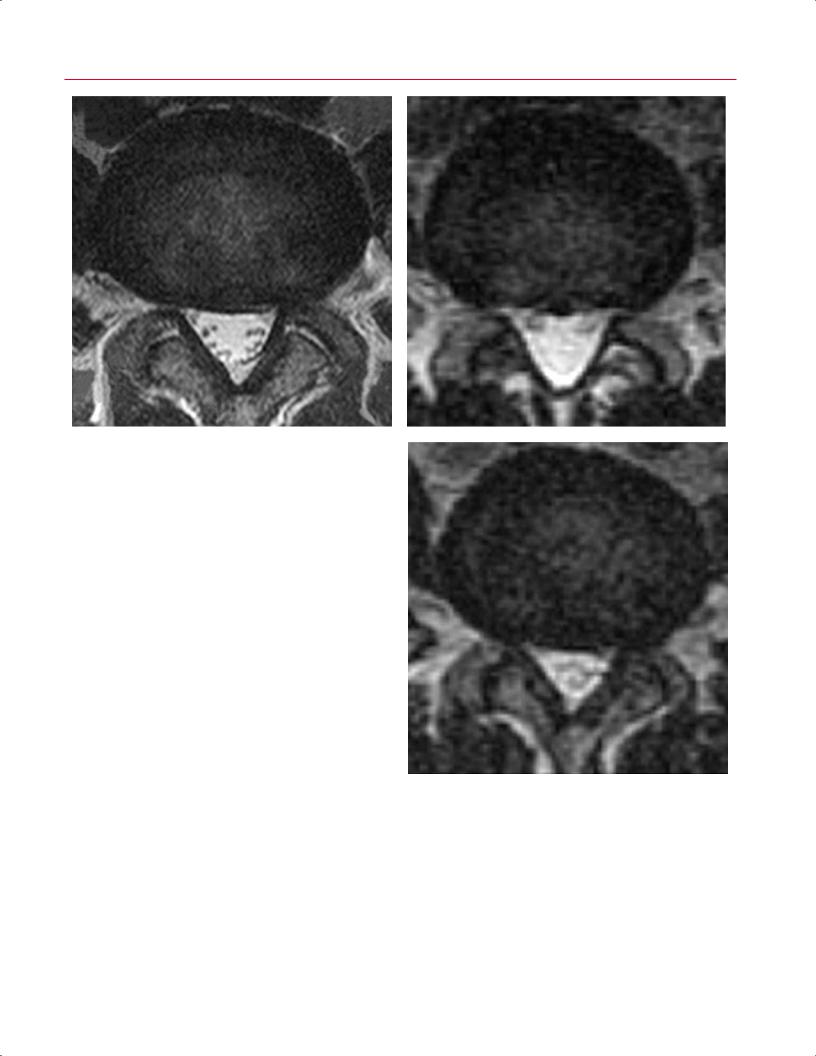
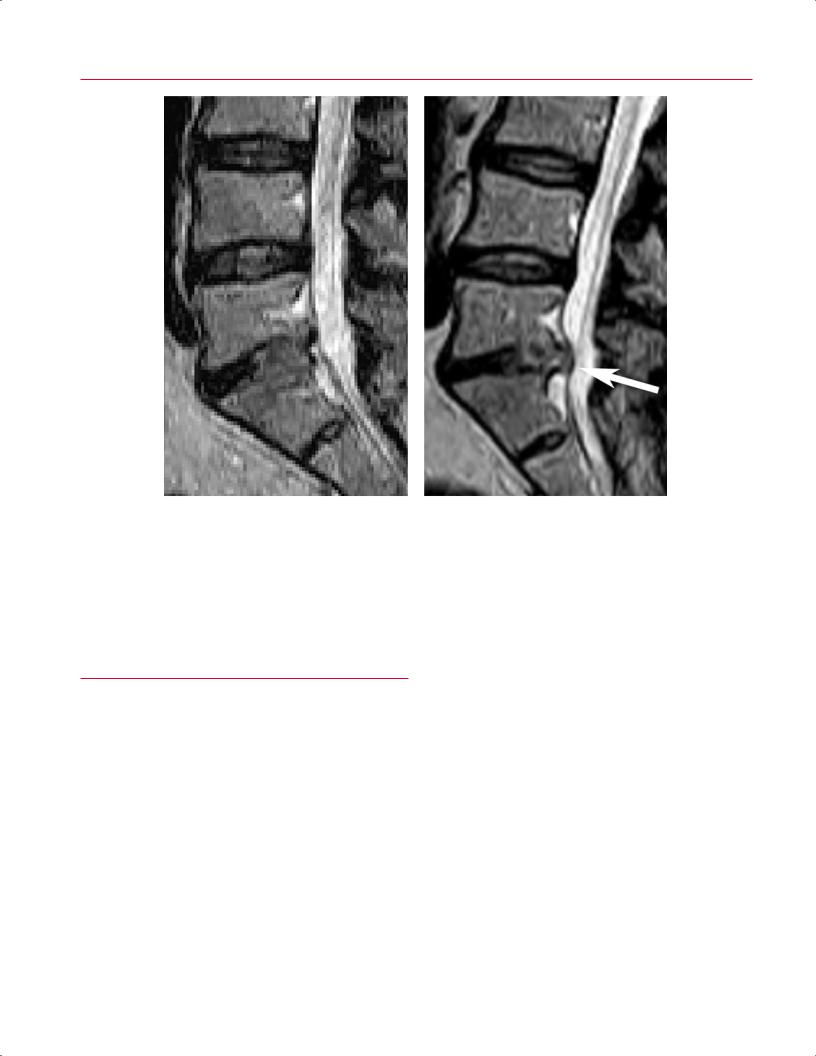
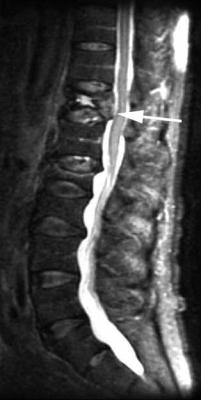
Fig. 16.9 Load-bearing spine imaging: seated positional paradigm. |
|
These sagittal (A–C) and axial (D–F) T2-weighted images were ob- |
|
tained in a specially designed vertically open 0.5-T MRI scanner (Gen- |
|
eral Electric Medical Systems). The patient was seated and images |
|
were acquired in neutral (A,D), flexion (B,E), and extension (C,F) |
|
positions. (A) The L5-S1 foramen shows a slight foraminal stenosis |
|
with deformity of the epidural fat (arrow) on the conventional image. |
|
(B) This image obtained with the patient in seated flexion shows im- |
|
provement with increased epidural fat surrounding the exiting nerve |
|
(arrow). (C) This image obtained with the patient in seated extension |
|
shows a marked foraminal stenosis at the L5-S1 foramen with epi- |
C |
dural fat only partially surrounding the nerve root present (arrow). |
(Continued on page 405) |
restrict spontaneous di usion of water; the degree of |
helpful for characterizing soft-tissue tumors because of the |
di usion can then be imaged to di erentiate benign from |
inherent contrast from high water di usion in muscle. Dif- |
malignant processes in the musculoskeletal system. This |
fusion-weighted imaging can also di erentiate malignant |
technique can show the extent of tumor necrosis and is |
from benign vertebral compression fractures because a be- |
used to di erentiate tumor recurrence from posttreatment |
nign fracture exhibits greater di usion and bone marrow |
signal changes. Di usion-weighted imaging is especially |
edema.20 |
16 Advanced Techniques in Musculoskeletal MRI 405
D E
Fig. 16.9 (Continued) The cross-sectional area of the dural sac in- |
|
creased from 150 mm2 in the supine position (D) to 170 mm2 in |
|
upright (seated) flexion (E) and decreased to 110 mm2 in upright |
|
(seated) extension (F). These images reveal that spinal canal and neu- |
|
ral canal dimensions are position dependent. (Courtesy of Dominik |
|
Weishaupt, MD, Institute of Diagnostic Radiology, University Hospital, |
F |
Zurich, Switzerland.) |
MR spectroscopy can assess the malignant potential of a ing by defining regions of a tumor with early enhancement.
lesion by evaluating its metabolic constituents. Because it |
Commercially available software then provides spectro- |
represents an element of cell membranes, choline is present |
scopic data, whereby the relative amount of choline within |
to a greater degree in malignant lesions, serving as a marker |
a region of interest is measured at a peak of 3.2 ppm. MR- |
for increased cell turnover.21 MR spectroscopy can be used to |
spectroscopy-based studies have shown that pathologically |
measure relative quantities of choline, which requires select- |
proven malignant lesions contain a significantly greater |
ing a volumetric region of interest. Each region of interest |
amount of choline than adjacent tissue.22,23 MR spectros- |
can be located with dynamic gadolinium-enhanced imag- |
copy, therefore, has the potential to provide a noninvasive |
 B
B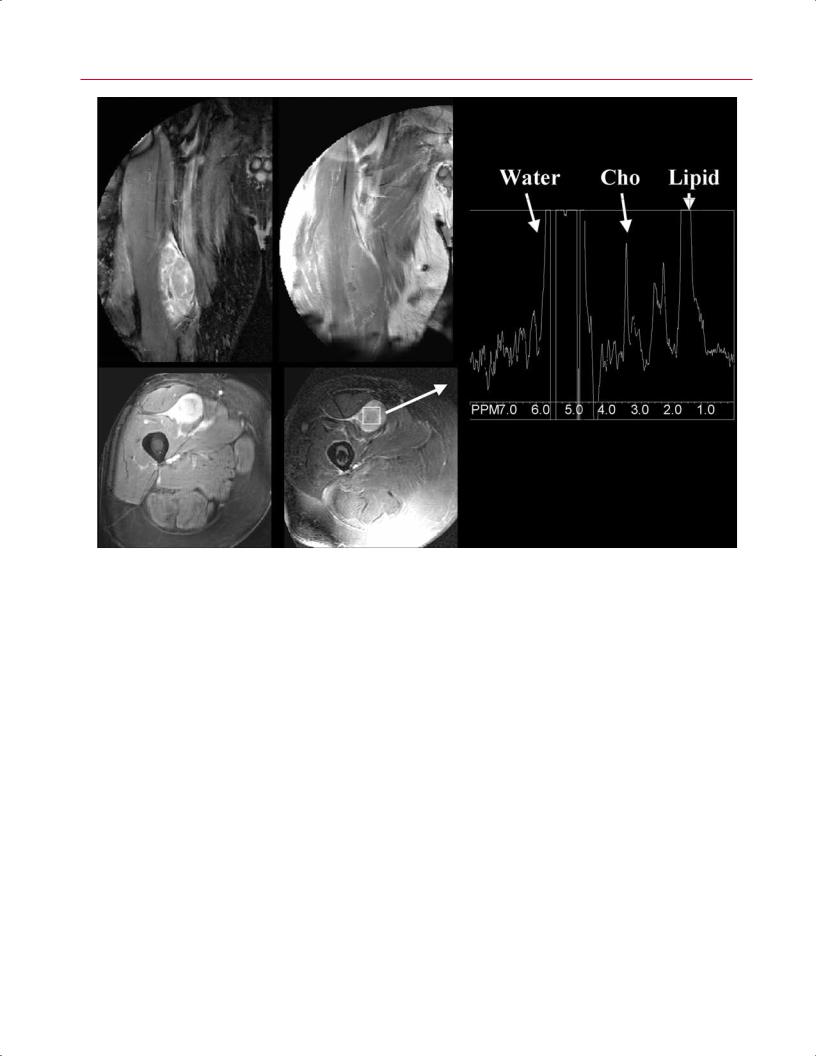
408 V Special Considerations
E
A, B
C, D |
|
Fig. 16.12 For this 58-year-old man presenting with a palpable right- |
90 degrees) shows that the mass enhanced after contrast adminis- |
thigh soft-tissue mass, imaging-guided percutaneous biopsy with |
tration. (D) An axial FS gradient-echo T2-weighted image (2886/100 |
needle aspiration and core biopsies revealed a myofibroblastic lesion |
ms) shows mass with placement of 2 × 2 × 2 mL voxel over lesion. |
of uncertain malignant potential, possibly representing fibromatosis, |
(E) A corresponding single-voxel point-resolved MR spectroscopy |
schwannoma, or a low-grade sarcoma. Histology favored a diagno- |
(2000/144 ms) shows a discrete choline (Cho) peak in the lesion, with |
sis of low-grade sarcoma; MR spectroscopy results highly favored |
a choline signal-to-noise ratio of 18.6, indicating malignancy. Final |
malignancy. (A) A coronal inversion recovery STIR image (TR/TE, |
pathology after resection showed a low-grade sarcoma. (From Fayad |
2462/100 ms; inversion time, 200 ms) of the right thigh shows an |
LM, Barker PB, Jacobs MA, Eng J, Weber KL, Kulesza P, Bluemke DA. |
ovoid heterogeneous mass. (B) A coronal SE T1-weighted image |
Characterization of musculoskeletal lesions on 3-T proton MR spec- |
(690/15 ms) of the same mass for comparison. (C) An axial gradient- |
troscopy. AJR Am J Roentgenol 2007;188:1513-1520. Reprinted by |
echo contrast-enhanced T1-weighted image (8.7/4.3 ms; flip angle, |
permission.) |
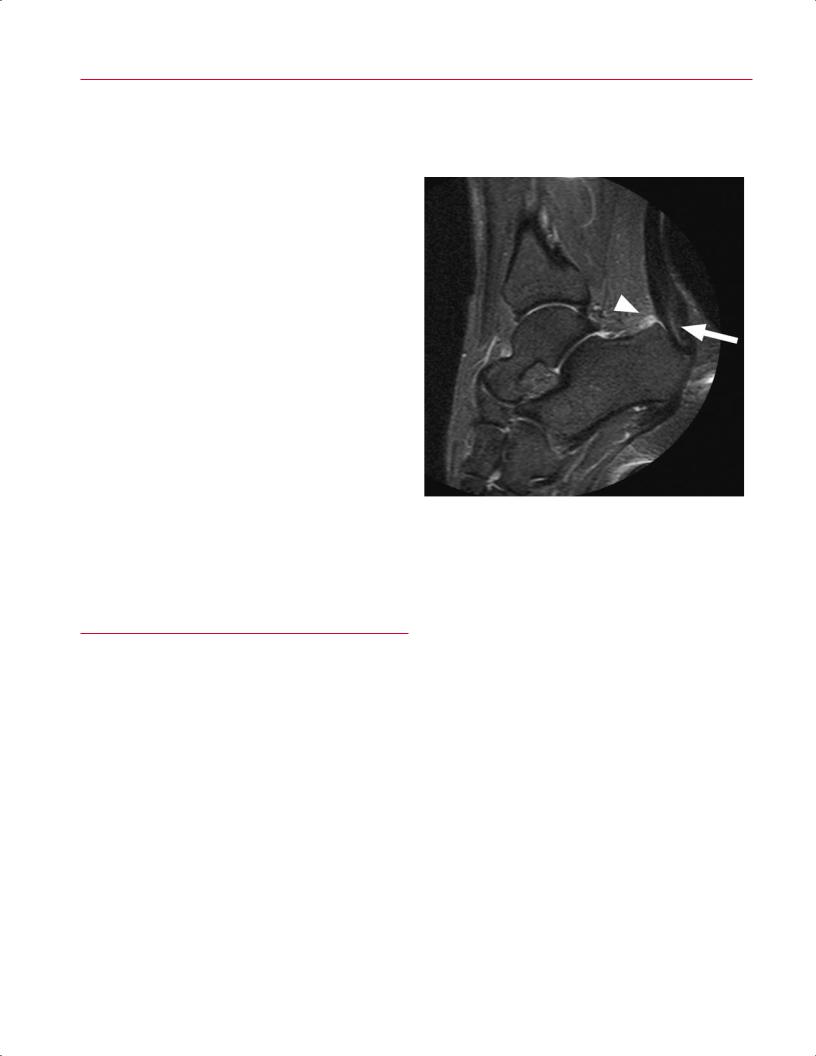
fracture, and osteonecrosis), and for the assessment of malig- |
ionizing radiation. Although initially di cult to perform |
|
nancy,31,32 and it o ers superior image quality, given minor |
because of the large fields of view, technical advances, in- |
|
modifications to conventional pulse sequences. MRI serves |
cluding high magnetic field strengths, have made MR angi- |
|
as an extremely useful problem-solving technique in the |
ography practical for a variety of clinical uses. |
|
presence of metallic hardware, particularly when clinical |
With MR angiography, feeding arteries and draining |
|
suspicion is high and radiography is negative or equivocal |
veins can be clearly seen for vascular malformations, aid- |
|
(Fig. 16.13). |
ing surgical or endovascular planning. Additionally, MR an- |
|
|
|
giography can reliably define tumor vascularity and vessel |
|
|
invasion,33 and it is also useful for the detection of arterial |
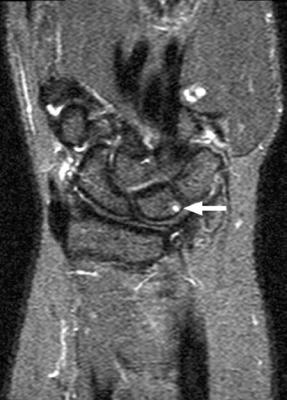
■ MR Angiography and Venography |
dissection and pseudoaneurysms, particularly in the set- |
|
|
|
|
|
|
ting of craniocervical trauma. MR angiography is especially |
MR angiography is a useful technique for defining vascular |
helpful for the evaluation of the peripheral vascular system |
|
anatomy throughout the musculoskeletal system without |
and has replaced conventional diagnostic angiography of |
|