Книги по МРТ КТ на английском языке / MRI for Orthopaedic Surgeons Khanna ed 2010
.pdf

 B
B
|
11 The Lumbar and Thoracic Spine 307 |
|
|
|
|
Based on the type of surgery performed and the clinical sce- |
neous track may be seen with gadolinium enhancement. |
|
nario, the spine surgeon and radiologist can use MRI (and |
After 6 months, all of the acute postoperative changes sec- |
|
other imaging modalities) to evaluate for various postsurgi- |
ondary to hemorrhage and edema usually have resolved.93 |
|
cal findings. |
The remaining scar tissue shows low to intermediate signal |
|
|
intensity on T1-weighted imaging and hypointensity on T2- |
|
After Decompression without |
weighted imaging. |
|
Instrumentation/Fusion |
Unfortunately, recurrent disc herniation is a relatively |
|
|
common occurrence after surgery for a lumbar disc hernia- |
|
Almost all decompressive procedures in the lumbar spine are |
tion. The reported range for the incidence of recurrent disc |
|
performed via a posterior approach. These procedures in- |
herniation is from 2% to 18%, and a large recent meta-anal- |
|
clude a midline laminectomy and bilateral foraminotomies, |
ysis has indicated the rate is 7% in patients who undergo |
|
hemilaminotomy with foraminotomy, and hemilaminotomy |
limited discectomy and 3.5% in patients who undergo ag- |
|
with discectomy. In most cases, careful review of the sagit- |
gressive discectomy.97 Another recent series found the in- |
|
tal and axial images permits determination of the extent of |
cidence of recurrent lumbar disc herniation to be 7.1%.98 |
|
bone removal during previous surgery(ies). Specifically, one |
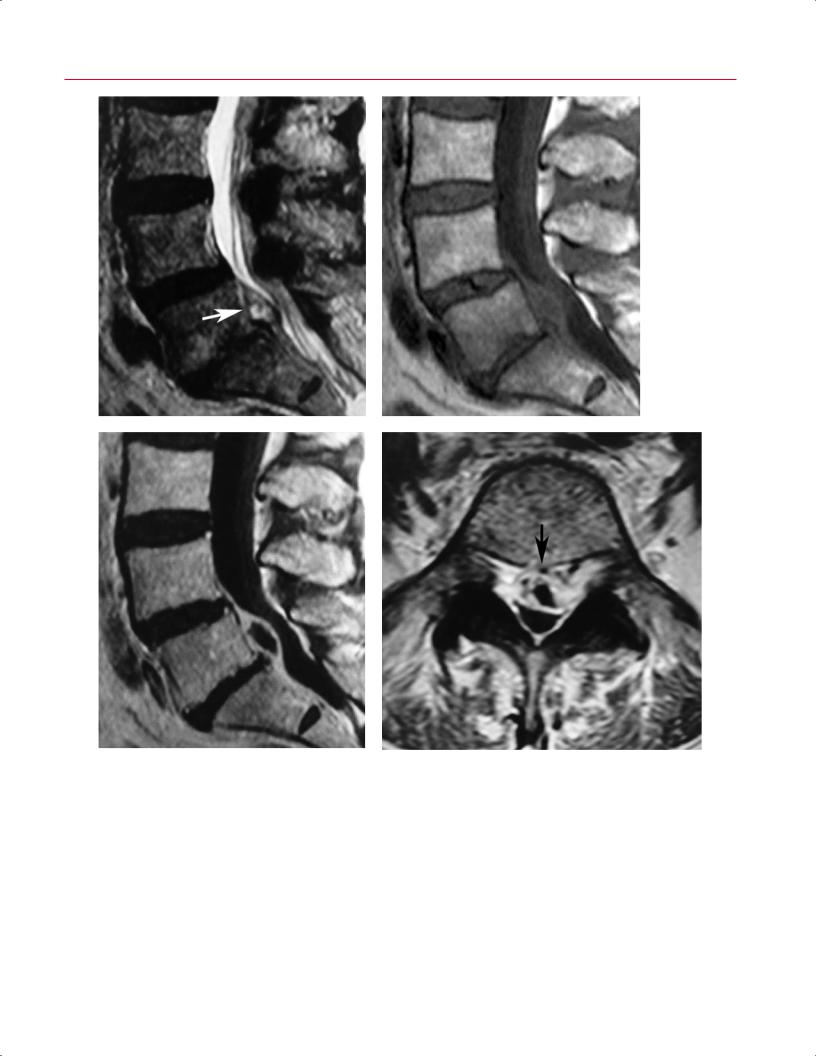
MRI can be used to di erentiate recurrent disc herniation |
|
should review the sagittal and axial T2-weighted images, fol- |
from scar tissue.99–103 The importance of making the dif- |
|
low the contour of the thecal sac, and look for focal areas of |
ferentiation between recurrent disc herniation and scar |
|
posterior expansion of the thecal sac or for regions of com- |
tissue or epidural fibrosis lies in the fact that outcomes |
|
pression of the thecal sac by scar tissue or recurrent/residual |
for revision surgery for recurrent disc herniation are sub- |
|
disc fragments. The axial T1-weighted images (which show |
stantially better than surgery for patients with only scar |
|
more osseous detail than do T2-weighted images) should be |
tissue and no recurrent disc herniation.104–108 MRI in pa- |
|
carefully reviewed for areas of postsurgical absence of the |
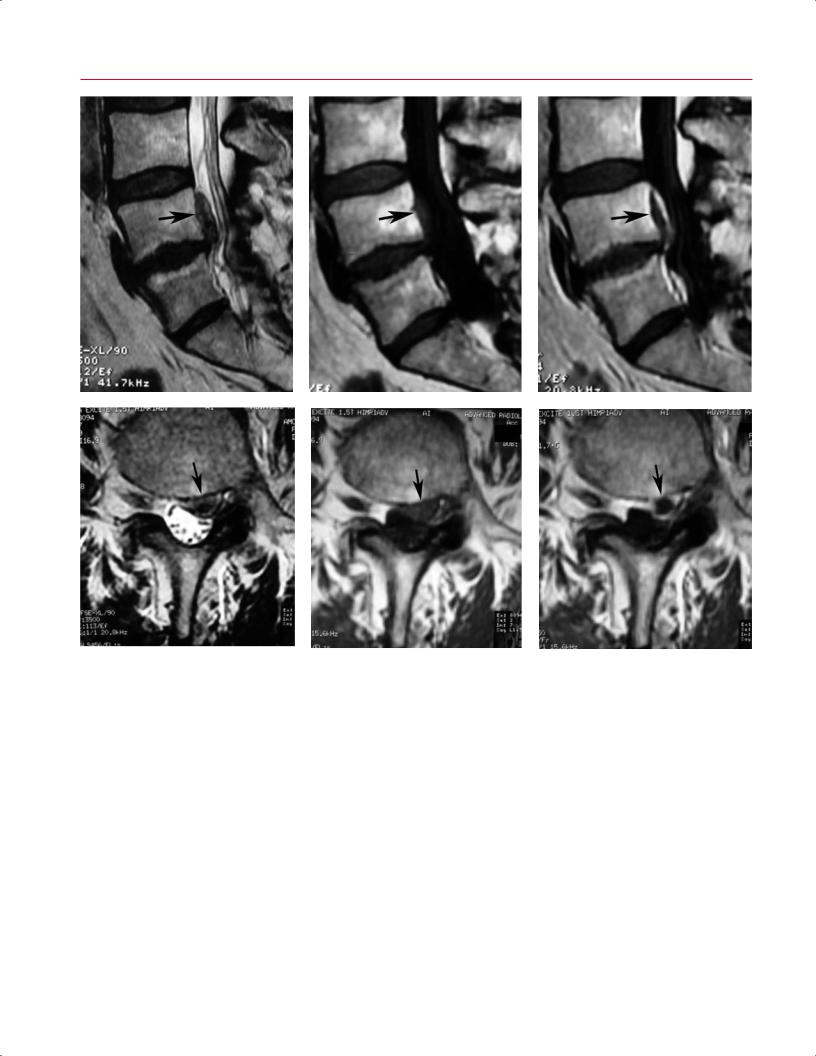
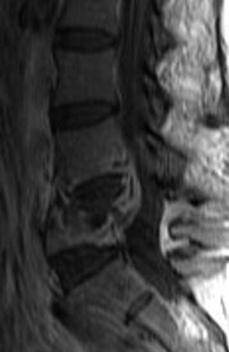
tients with recurrent disc herniation shows a focal extra- |
|
osseous structures. If additional information may benefit |
dural lesion, typically in the posterolateral or lateral recess |
|
the surgeon for preoperative planning, CT imaging may be |
region, that has peripheral enhancement with a central |
|
considered. |
area of nonenhancement on postgadolinium T1-weighted |
|
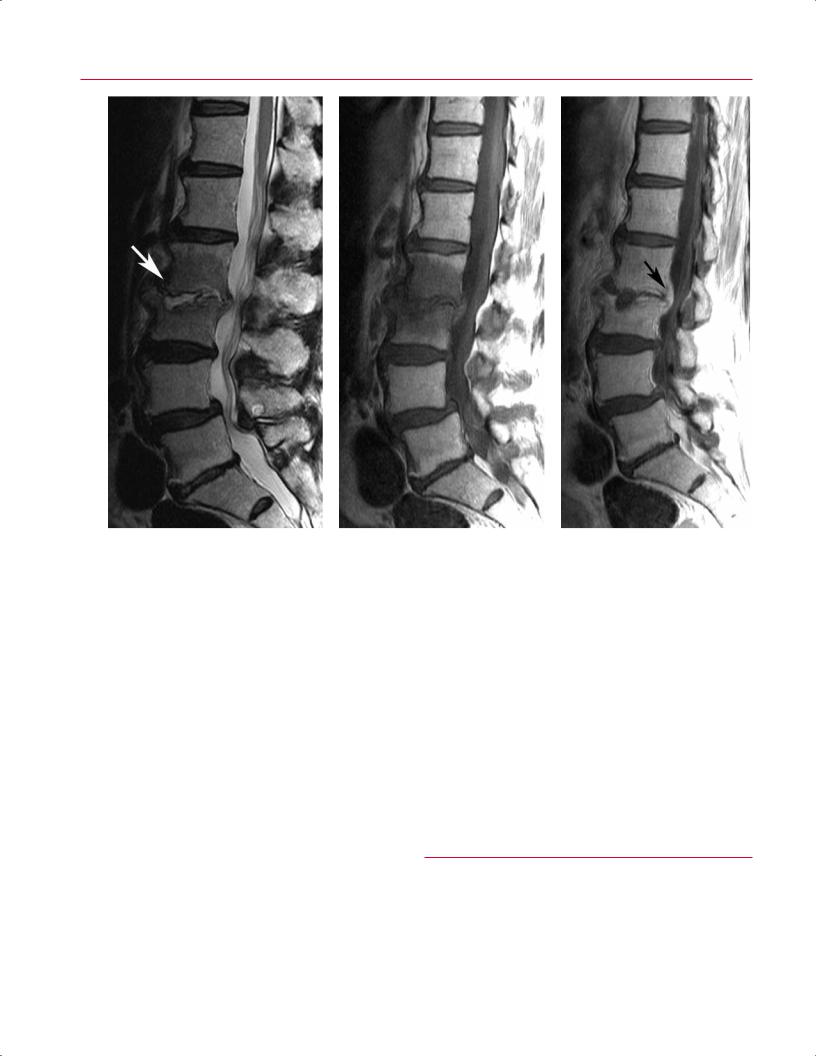
After discectomy, specific changes may be noted around |
images (Fig. 11.45). Conversely, patients with epidu- |
|
the a ected area, depending on the length of time between |
ral fibrosis show uniform enhancement of the epidural |
|
surgery and the imaging study. At the level of the disc, a |
tissue. |
|
high signal intensity band extending from the nucleus |
|
|
pulposus to the side of annular disruption may be appreci- |
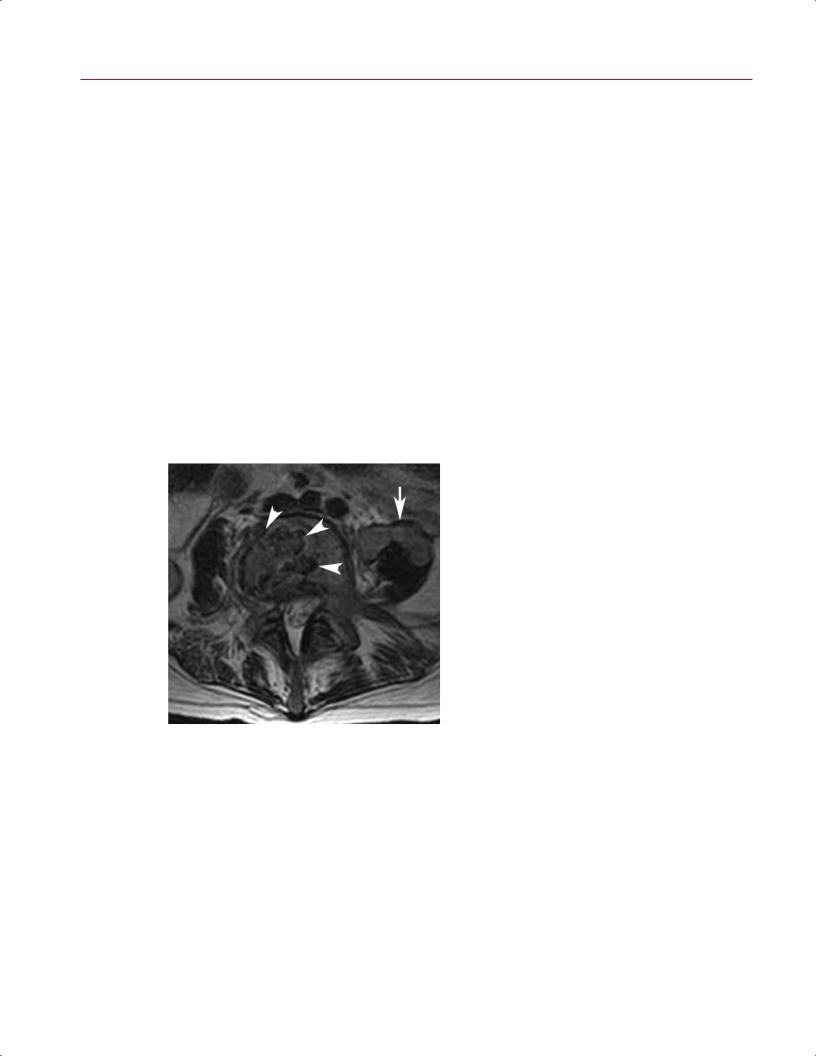
After Instrumentation/Fusion |
|
ated on T2-weighted images up to 2 months after surgery. |
Stainless steel implants are considered superparamagnetic |
|
Annular enhancement may also be seen. There also may |
||
be a component of disc height loss, depending on the ag- |
and produce the greatest degree of image degradation sec- |
|
gressiveness of the discectomy. T1-weighted images show |
ondary to magnetic susceptibility artifacts.104 Titanium and |
|
increased soft tissue within the anterior epidural space im- |
tantalum spinal implants, which are not superparamagnetic, |
|
mediately after surgery; an epidural mass e ect is observed |
produce less artifact than does stainless steel. Even with con- |
|
in 80% of patients.93 Anterior epidural soft-tissue edema |
ventional T2-weighted and T1-weighted pulse sequences, |
|
with disruption of the posterior annular margin second- |
the central canal can be adequately visualized in patients |
|
ary to disc curettage can mimic the appearance of disc her- |
with titanium pedicle screws. These images can allow for |
|
niation. It can take from 2 to 6 months after surgery for a |
the detection of postoperative fluid collections (such as |
|
normal signal to return.94,95 One should use caution when |
hematoma, seroma, pseudomeningocele, and abscess) and |
|
evaluating MRI studies in the first 6 weeks after surgery |
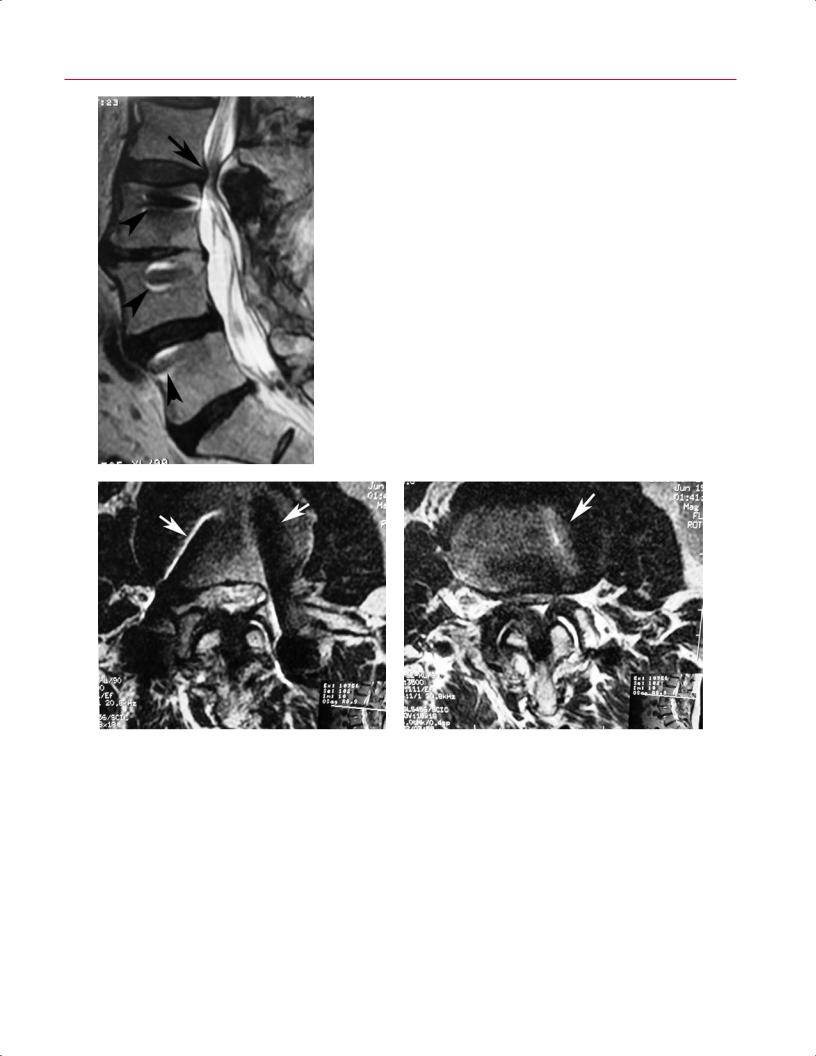
can even accurately show the degree of thecal sac compres- |
|
because there may be a large amount of tissue disruption |
sion from these fluid collections. In addition, the degree of |
|
and edema, producing a mass e ect on the anterior thecal |
adjacent level stenosis at levels above and below an instru- |
|
sac. |
mented lumbar fusion can be seen well on sagittal and axial |
|
Nerve root enhancement secondary to breakdown of |
T2-weighted images (Fig. 11.46). |
|
the blood–nerve barrier is another common finding in the |
The position of interbody fusion devices (such as those |
|
immediate postoperative period. This enhancement de- |
placed for transforaminal lumbar interbody fusion, poste- |
|
creases by 3 months after surgery and is virtually gone by |
rior lumbar interbody fusion, and anterior lumbar inter- |
|
6 months.93,96 Posterior soft-tissue changes continue to be |
body fusion) can also be assessed by MRI. These devices |
|
seen up to 3 months after surgery. These changes include |
should be located within the confines of the interbody |
|
disruption and edema of the paraspinal muscles with low |
space, and the posterior aspect of the interbody device |
|
signal intensity on T1-weighted images and high signal |
after a transforaminal or posterior lumbar interbody fu- |
|
intensity on T2-weighted images. An enhancing subcuta- |
sion procedure should be positioned within the posterior |
|