Книги по МРТ КТ на английском языке / MRI for Orthopaedic Surgeons Khanna ed 2010
.pdf
252 IV Spine
A 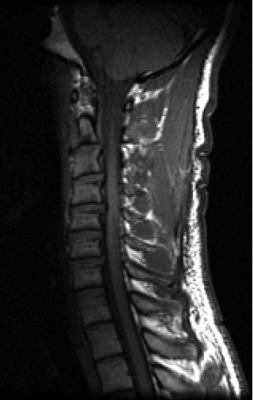 B
B
|
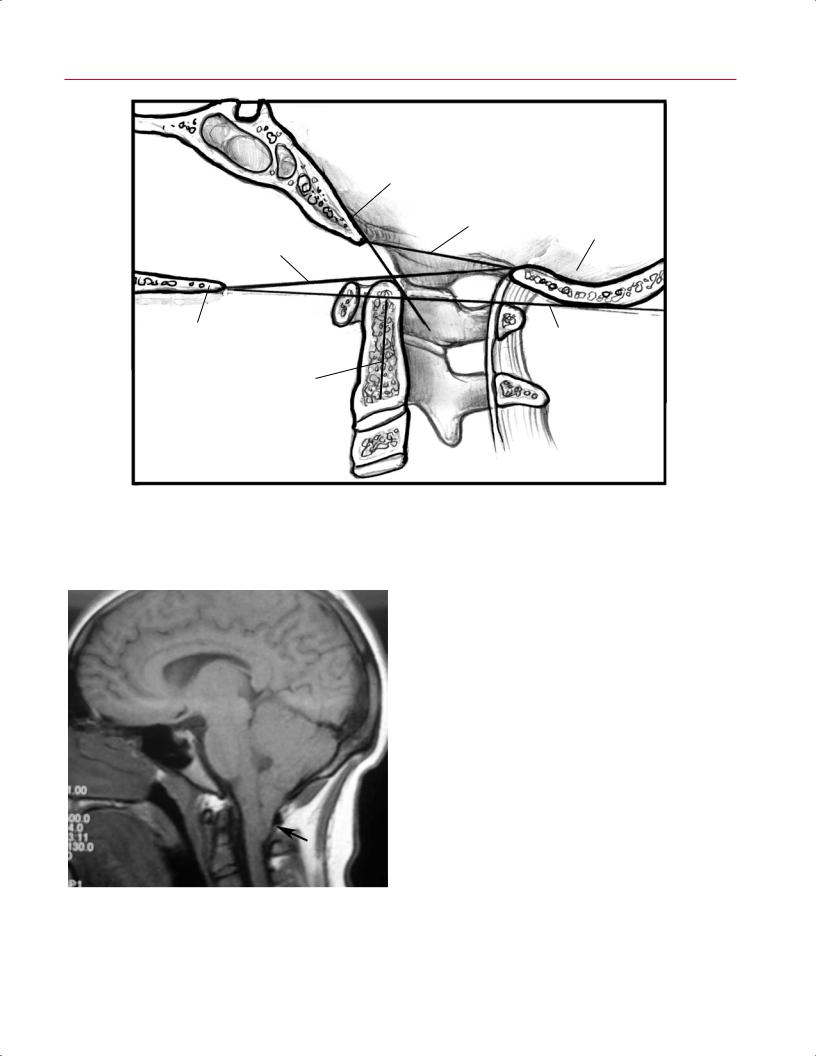
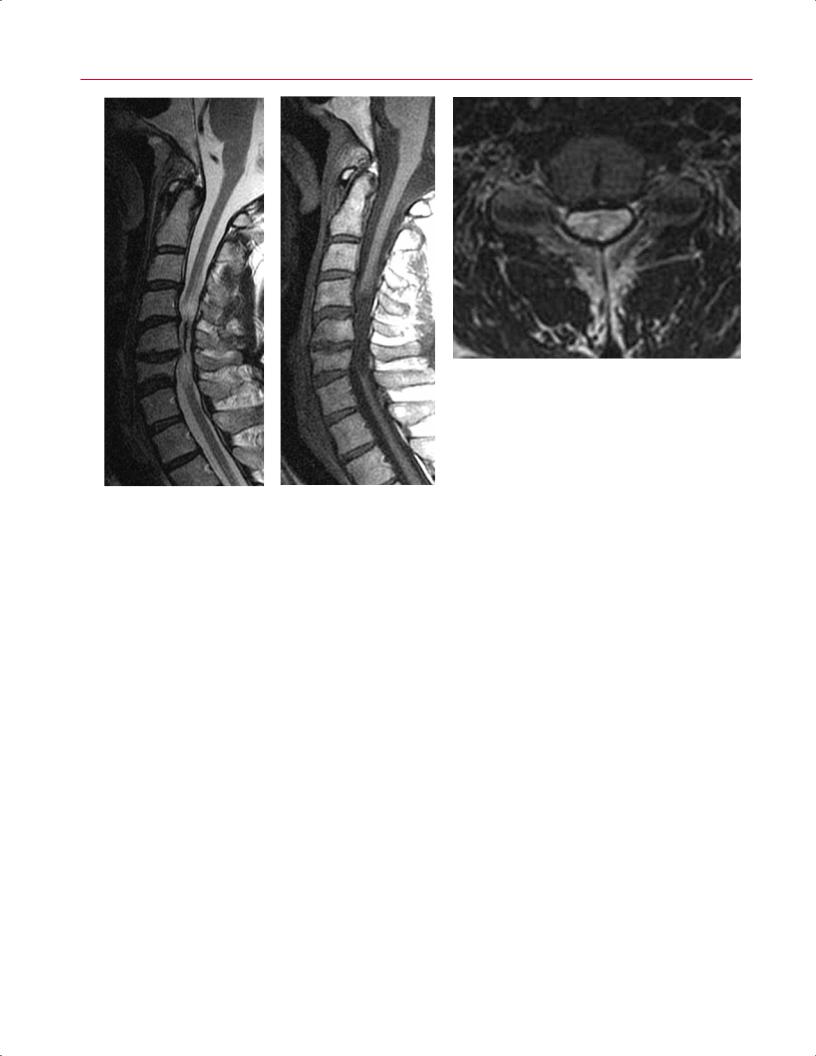
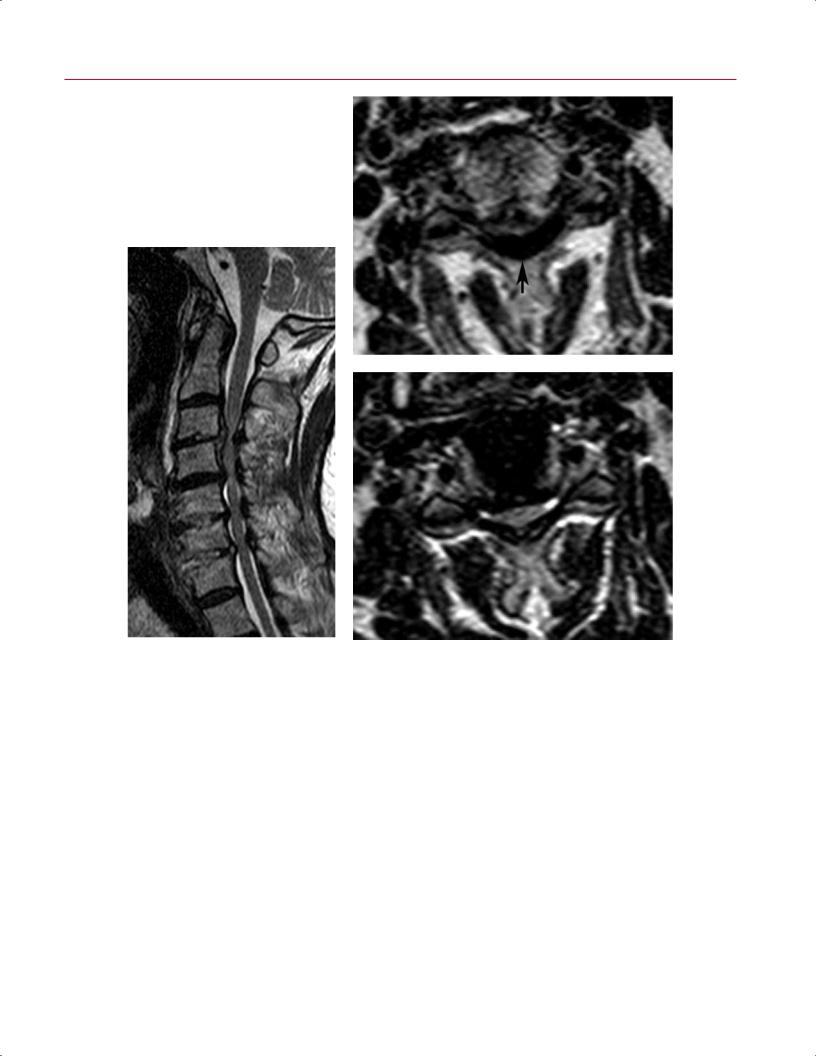
Fig. 10.24 Degenerative upon congenital ste- |
|
nosis. (A) A sagittal T1-weighted image shows a |
|
developmentally shortened AP dimension of the |
|
spinal canal. (B) A sagittal T2-weighted image |
|
shows a small disc bulge at the C4-C5 level that |
|
causes spinal cord signal abnormality, represent- |
|
ing spondylotic myelomalacia (arrow). (C) An axial |
|
T2-weighted image shows the moderate to severe |
C |
central canal stenosis. |
Given that the great majority of cervical spine MRI stud- |
of the CSF column and spinal cord compression, whereas the |
ies are obtained to evaluate for the presence, location, and |
parasagittal images allow for visualization of lateral recess |
degree of degenerative cervical spinal stenosis, one should |
and foraminal stenosis (Fig. 10.27). The information from |
have a systematic approach to the evaluation of these stud- |
these images should be correlated with that from the axial |
ies. The authors’ suggested approach for the evaluation of |
images, which show the same pathology in an orthogonal |
a cervical spine MRI study (see Chapter 3) includes a criti- |
plane. |
cal evaluation of the degree of spinal cord and nerve root |
There are several objective measures of cervical spinal |
compression on the sagittal, parasagittal, and axial T2- |
stenosis. Relative stenosis is defined as an AP canal diameter |
weighted images. The midline sagittal T2-weighted images |
of <13 mm, and absolute stenosis is defined as an AP canal |
provide a global view of the levels and degree of e acement |
diameter of <10 mm. The Torg or Pavlov ratio is calculated |
254 IV Spine
C
|
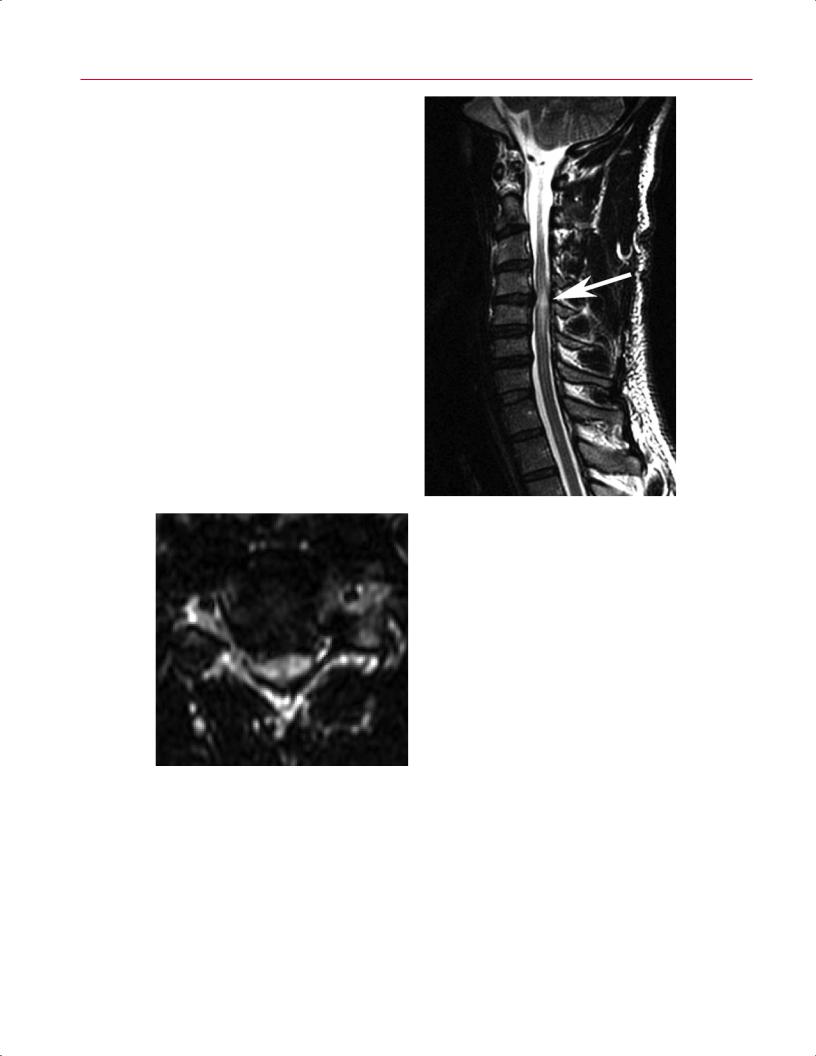
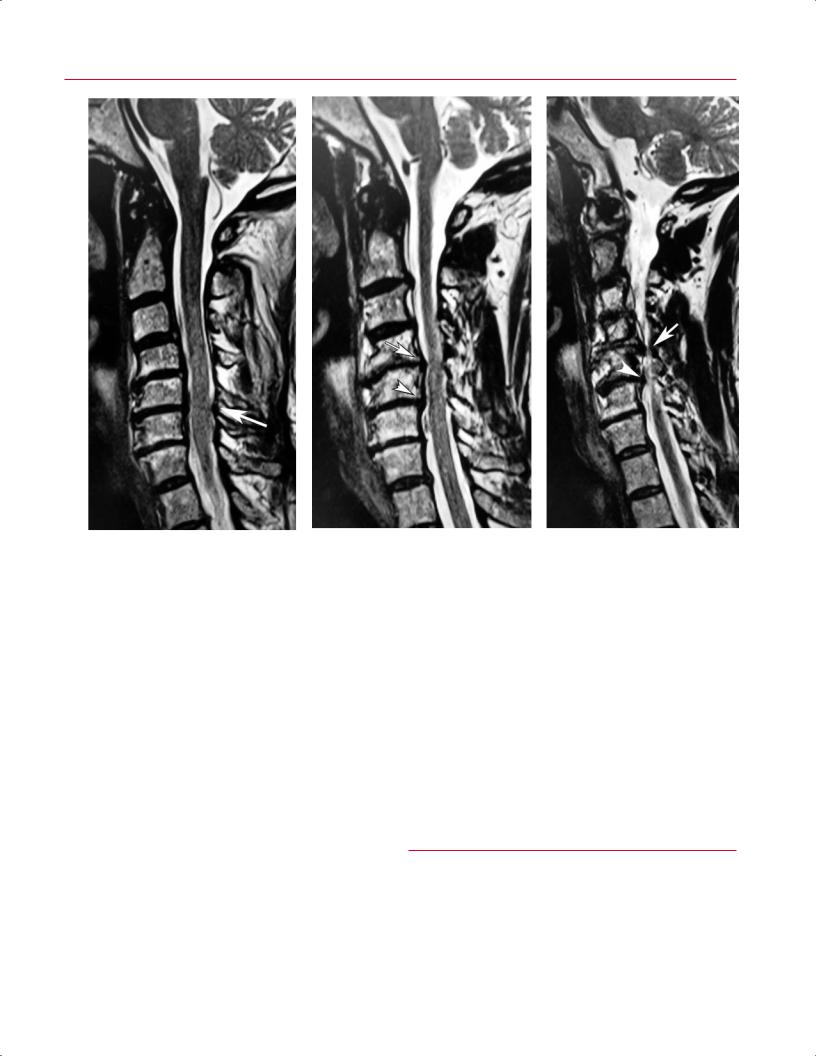
Fig. 10.26 Spinal cord atrophy. (A) A sagittal T2-weighted |
|
|
image showing moderate-severe stenosis at C4-C6, with |
|
|
resultant atrophy of the spinal cord at the level of C5 and |
|
|
regions of cord edema proximal and distal to the region of |
|
|
atrophy. (B) A sagittal T1-weighted image showing a seg- |
|
|
ment of low signal intensity within the spinal cord from |
|
|
C4-C5 to C6-C7. (C) An axial T2-weighted image at the C4-C5 |
|
A, B |
level showing atrophy of the spinal cord and indistinct mar- |
|
gins between the spinal cord and the surrounding CSF. |
||
|
relationships and lines have now been extrapolated for use |
○ Associated with spina bifida aperta and myelome- |
|
with MR and CT imaging and can be used to diagnose and |
ningocele |
|
quantify the degree of basilar invagination and cranial set- |
○ Not usually associated with atlantooccipital assim- |
|
tling (Table 10.4; Fig. 10.30). |
ilation or basilar invagination60 |
|
|
• Type III |
|
Chiari Malformations |
○ Defined as herniation of the hindbrain into a high |
|
cervical encephalocele |
||
Chiari malformations result in a caudal migration of the cer- |
○ Occurs rarely60,61 |
|
|
||
ebellar tonsils to and through the foramen magnum with |
RA |
|
resultant occipitocervical stenosis. Although many such |
||
malformations are minor, incidentally noted findings, ad- |
RA is a systemic disease that causes inflammation of syno- |
|
vanced lesions can produce symptoms, and thus may benefit |
||
vial joints. The synovial joints develop pannus secondary to |
||
from a neurosurgical evaluation and eventual suboccipital |
||
erosion of supporting ligamentous structures and the asso- |
||
decompression. Three types of Chiari malformations have |
||
ciated instability.60,62,63 In the cervical spine, this condition |
||
been described56,57: |
||
may a ect the craniocervical junction as well as the subaxial |
||
• Type I (Fig. 10.31) |
||
cervical spine, as described below.60,62–65 Most commonly, |
||
○ Defined as a defect in the cerebellum with a down- |
atlantoaxial instability develops secondary to erosion of the |
|
ward displacement of the tonsils >5 mm below the |
ligaments at the occipitocervical junction.62,63 As the disease |
|
plane of the foramen magnum58,59 |
progresses, erosion of the lateral masses of C1, the occipital |
|
○ Associated with basilar invagination in 50%, atlan- |
condyles, and facets of C2 occurs, resulting in cranial set- |
|
tooccipital assimilation in 10%, and Klippel-Feil |
tling.60,62,63 As the odontoid process begins to occupy a rela- |
|
syndrome in 5%58,59 |
tively more rostral position, it compresses the brainstem and |
|
• Type II |
vertebrobasilar system. This pathologic process is postulated |
|
○ Results from dysgenesis of the hindbrain60 |
by some as the etiology of sudden death in those with ad- |
|
○ Involves herniation of the inferior cerebellar ver- |
vanced RA.60,62,63,66 It is important to note that in contrast |
|
mis, fourth ventricle, and medulla |
to other disorders, the C1 arch migrates with the skull base |

258 |
|
IV Spine |
|
|
|
|
|
|
|
|
Table 10.4 Occipitocervical Junction: Anatomic Relationships, and |
nuclear scintigraphy in identifying vertebral osteomyelitis.71 |
|||||
|
|
Lines for Use with MRI, CT, and Conventional Radiographs |
|
Infectious spondylitis may present with findings such as |
||||
|
|
|
Eponym |
Parameters |
Pathology |
low T1-weighted signal with or without high T2-weighted |
||
|
|
|
|
|
|
|
|
signal (high signal is often more evident on fat-suppressed |
|
|
|
Wackenheim’s |
Tangent drawn along |
Dens should be |
|||
|
|
|
T2-weighted or STIR images); increased T2-weighted signal |
|||||
|
|
|
clivus |
the superior surface |
below the line. |
|||
|
|
|
baseline |
of the clivus |
|
|
|
within the intervertebral disc; contrast enhancement in the |
|
|
|
Clivus canal |
Angle formed between |
Normal ranges are |
disc, subchondral marrow, and epidural space; erosion of |
||
|
|
|
angle |
Wackenheim’s line |
180 degrees in |
end plates; epidural fluid collections; paraspinous soft-tissue |
||
|
|
|
|
and the posterior |
extension to |
abnormalities; and posterior element involvement17,71,73,75 |
||
|
|
|
|
vertebral body line |
150 degrees in |
(Fig. 10.33). Unfortunately, these imaging characteristics |
||
|
|
|
|
|
flexion; an angle |
|||
|
|
|
|
|
are the same as those of many spine pathologies, includ- |
|||
|
|
|
|
|
of <150 degrees |
|||
|
|
|
|
|
is considered |
ing neoplastic disease. One can di erentiate infection from |
||
|
|
|
|
|
abnormal. |
other processes a ecting the vertebral body bone marrow by |
||
|
|
|
Chamberlain’s |
Between the hard |
Protrusion of the |
noting that the epicenter of the former pathology tends to be |
||
|
|
|
line |
palate and the |
dens >3 mm |
at the intervertebral disc. Conversely, neoplastic processes |
||
|
|
|
|
opisthion |
above this line |
tend to have their epicenters within the vertebral body, and |
||
|
|
|
|
|
is considered |
the edema tends not to cross the intervertebral disc. In |
||
|
|
|
|
|
abnormal. |
|||
|
|
|
|
|
addition, the vertebral end plate may have an irregular ap- |
|||
|
|
|
McRae’s line |
Basion to the opisthion |
Protrusion of the |
|||
|
|
|
pearance because of infectious destruction, and disc height |
|||||
|
|
|
|
|
dens above this |
|||
|
|
|
|
|
loss or collapse may occur with progressive infection. On |
|||
|
|
|
|
|
line is abnormal. |
|||
|
|
|
McGregor’s |
From the hard palate |
Odontoid process |
gadolinium-enhanced images, disc enhancement is an es- |
||
|
|
|
sential factor for the diagnosis of discitis, and enhancement |
|||||
|
|
|
line |
to the most caudal |
rising >4.5 mm |
|||
|
|
|
|
point on the midline |
above this line |
of the vertebral subchondral bone may indicate a well- |
||
|
|
|
|
occipital curve |
is considered |
established and chronic infection.17,71,73 |
||
|
|
|
|
|
abnormal. |
In comparison with other bacterial infections, Mycobac- |
||
|
|
|
Ranawat |
Distance between |
Measurement of <15 |
|||
|
|
|
terium tuberculosis infection of the spine has some distinct |
|||||
|
|
|
criterion |
the center of the |
mm in males and |
di erences: |
||
|
|
|
|
pedicle of C2 and |
<13 mm in females |
|||
|
|
|
|
|
||||
|
|
|
|
the transverse axis |
is abnormal. |
• Intervertebral discs are damaged less or completely |
||
|
|
|
|
of C1 |
|
|
|
spared and may not show signal enhancement on T2- |
|
|
|
Welcher’s |
Tangent to the clivus |
The normal range |
|||
|
|
|
weighted images.71 |
|||||
|
|
|
basal angle |
as it intersects a |
is 125 to 143 |
• Tuberculous spondylodiscitis is a slow-growing pro- |
||
|
|
|
|
tangent to the |
degrees; platybasia |
|||
|
|
|
|
cess that often results in marked collapse of the verte- |
||||
|
|
|
|
sphenoid bone |
exists when the |
|||
|
|
|
|
|
basal angle is >143 |
bral bodies. |
||
|
|
|
|
|
degrees. |
• Subligamentous spread of infection is often observed. |
||
|
|
|
|
|
|
|
|
• Telescoping of one vertebral body disc into an adjacent |
|
|
bacteria, such as Aspergillus, Candida, Nocardia asteroides, |
level may be seen. |
|||||
|
|
Gadolinium-enhanced MRI also is essential for monitor- |
||||||
|
|
and Mycobacterium. Pseudomonas infections may occur in |
||||||
|
|
intravenous drug abusers. Children with sickle cell disease |
ing the e cacy of treatment of vertebral infection.76 With |
|||||
|
|
may develop spine infections secondary to Salmonella. |
appropriate treatment of the infection, a regression of the |
|||||
|
|
|
Isolated discitis is common in the pediatric population be- |
T2-weighted signal hyperintensity is observed.73 Scar for- |
||||
|
|
cause vascularity extends through the cartilaginous growth |
mation within the intervertebral disc is seen as a region |
|||||
|
|
plate into the nucleus pulposus, allowing direct deposition |
of low signal intensity. A region of mottled signal inten- |
|||||
|
|
of bacteria into the disc center. In adults, blood vessels reach |
sity may also develop within the area of previous infection |
|||||
|
|
only the annulus fibrosus, limiting bacterial deposition to |
with associated contrast enhancement. Over time, osteo- |
|||||
|
|
the vertebral body metaphysis and end plate. In adult in- |
phytic bridging may occur, followed by segmental fusion.73 |
|||||
|
|
fections, intervertebral disc destruction may occur through |
It should be noted, however, that a lack of improvement on |
|||||
|
|
bacterial proteolytic enzyme infiltration. |
MRI and even deterioration of MRI features in the setting of |
|||||
|
|
|
MRI is the imaging modality of choice for the diagnosis |
clinical improvement do not necessarily indicate failure of |
||||
|
|
and evaluation of spinal infections and for monitoring the |
treatment.77,78 |
|||||
|
|
response to treatment.71 High sensitivity (96%), specificity |
In the postoperative patient, evaluation for cervical spine |
|||||
|
(93%), and accuracy (94%) have been reported for the MRI |
infection may be complicated by the normal enhancement of |
||||||
|
diagnosis of vertebral osteomyelitis.51 MRI is more sensitive |
the uninfected disc. MRI findings of infection in a postopera- |
||||||
|
|
than conventional radiographs or CT and more specific than |
tive patient include contrast enhancement of the subchon- |
|||||