

3649
.pdfRussian Journal of Building Construction and Architecture
2. Experiment
2.1. Materials
2.1.1. Cement
In the experiments, CEM I 42.5 N cement was chosen as binder. Fig. 1-a. This cement was purchased from NUH CEMENT company.
2.1.2. Standard Sand
Standard sand was used as filling material in many experimental studies on cementitious mortars for different purposes [15––18]. This study was used in conjunction with recycled glass aggregate in some specimens. Fig. 1-b.
2.1.3. Recycled Glass Aggregate
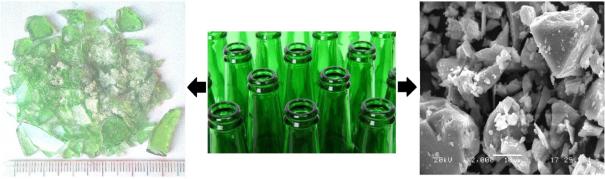
Glass aggregates were recycled from waste green bottles of sodas. The process was carried out by collecting, breaking of waste green bottles and passing the broken glass through NO 8 sieve. Fig. 2-Left. In addition, glass Powders (Fig. 2-Right) were obtained from the broken glass using a grinding machine. The glass Powders were passed through a 63 micrometer sieve. EDS analysis of the obtained micro-glass Powders was carried out. As understood from the EDS analysis, the maximum compound content of the glass powder can be determined as SiO2, since the maximum element content belongs to Si and O. The EDS results are given in Table 1.
Fig. 1. Used materials; a) cement, b) standard sand and e) waste glass aggregates
30
Issue № 4 (44), 2019 |
ISSN 2542-0526 |
Fig. 2. Crumb (left) and powder (right: SEM image) state of green waste glasses (middle)
|
|
EDS analysis results of the waste glass powder |
|
Table 1 |
|||
|
|
|
|
||||
|
|
|
|
|
|
|
|
Elt. |
Line |
|
Intensity (c/s) |
Error 2-sig |
|
Conc |
Units |
|
|
|
|
|
|
|
|
C |
Ka |
|
5.75 |
1.517 |
|
8.792 |
wt. % |
|
|
|
|
|
|
|
|
O |
Ka |
|
75.26 |
5.486 |
|
37.502 |
wt. % |
|
|
|
|
|
|
|
|
Na |
Ka |
|
59.03 |
4.859 |
|
9.105 |
wt. % |
|
|
|
|
|
|
|
|
Mg |
Ka |
|
15.15 |
2.462 |
|
1.912 |
wt. % |
|
|
|
|
|
|
|
|
Al |
Ka |
|
11.09 |
2.106 |
|
1.205 |
wt. % |
|
|
|
|
|
|
|
|
Si |
Ka |
|
366.37 |
12.104 |
|
35.611 |
wt. % |
|
|
|
|
|
|
|
|
Ca |
Ka |
|
50.50 |
4.494 |
|
5.873 |
wt. % |
|
|
|
|
|
|
|
|
Total |
|
|
|
|
|
100.000 |
wt. % |
|
|
|
|
|
|
|
|
2.2. Mix Design
The mix design used for this study and details of the produced specimens are given in Table 2. Water/cement ratio was 0.58 in cement mortars. The mortars were mixed with a mixer machine, molded and then vibrated with a vibrating table so that three specimens were obtained for each test. All of the specimens were demolded after 24 hours and cured at room temperature water for 48 hours and were expected for the related tests to 28 days. During the mixing, it was realized that the mortars containing glass crumbs and powder had a selfcompacting property.
2.3. Test Methods
2.3.1. Flexural and Compressive tests
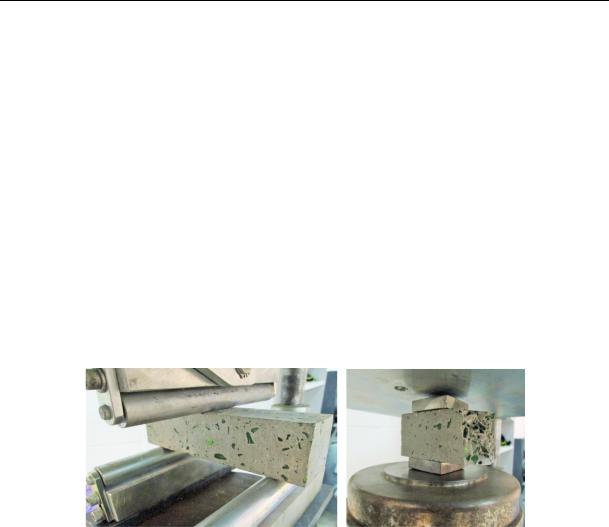
A 200 KN capacity laboratory bending-compressive tester was used for flexural and compressive tests (Fig. 3). In the compressive tester, the 40 × 40 mm plates (bottom and top headings) to the 40 × 40 × 160 mm specimens were used following the flexural test. The flexural and compressive strengths were measured in accordance with TS EN 196-1 [19]. For all the mor-
31
Russian Journal of Building Construction and Architecture
tar mixes, 40 × 40 × 160 mm for flexural and compressive tests specimens were produced, mold and wet stored for 28 days. The selection of the specimen size was chosen based on the previous studies for mortar [20––24].
|
|
|
|
|
|
|
Table 2 |
|
|
|
Mix proportions of mortars |
|
|
||
|
|
|
|
|
|
|
|
Mix code |
Cement (g) |
Water (g) |
|
Glass aggregate (g) |
|
Glass Powder(g) |
Standard sand (g) |
|
|
|
|
|
|
|
|
M1 |
450 |
261 |
|
0 |
|
0 |
1200 |
|
|
|
|
|
|
|
|
M2 |
450 |
261 |
|
1200 |
|
0 |
0 |
|
|
|
|
|
|
|
|
M3 |
450 |
261 |
|
900 |
|
0 |
300 |
|
|
|
|
|
|
|
|
M4 |
450 |
261 |
|
600 |
|
0 |
600 |
|
|
|
|
|
|
|
|
M5 |
450 |
261 |
|
900 |
|
300 |
0 |
|
|
|
|
|
|
|
|
M6 |
450 |
261 |
|
750 |
|
450 |
0 |
|
|
|
|
|
|
|
|
Fig. 2. Flexural (left) and compressive (right) tests of specimens
2.3.2. Impact Test
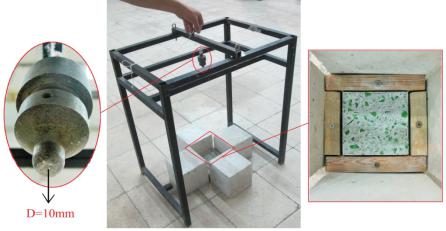
Impact situations can be reserved into two classes, high and low velocity impact [25, 26]. According to ACI Committee 544 drop weight impact test is most appropriate to measure the impact strength of a cementitious material slab [27]. Using the drop weight impact test method, J. Yahaghi et al. examined concrete slabs of 40 mm, 30 mm, and 20 mm in thickness. Using a self-fabricated tool, they dropped from 36 cm height 0.380 kg steel ball for the slabs with the thicknesses of 20 mm and 30 mm and 1.25 kg steel ball for the slabs with the thickness of 40 mm [25]. This study was performed by means of the low-velocity drop weight impact test with a self-fabricated tool (Fig. 4). The tool consists of a frame, a square support holding the specimen, and a steel mass hanging from the middle of the frame. The slab specimens sized 100 mm × 100 mm and of 25 mm in thickness were produced for the impact test and were carried by dropping a steel mass weighing 0.310 kg out at the drop height of 73 cm for the specimens. The numbers of impacts required for the specimens to fail are given in Ta-
32
Issue № 4 (44), 2019 |
ISSN 2542-0526 |
ble 3. In this study the values of ultimate energy absorption will be obtained from the Eq. (2) [25, 26]:
|
|
e = m × g × h, |
|
(1) |
|
|
|
EAu = Nu × e. |
|
(2) |
|
In these formulas, |
is the energy for each pulse (Joules), |
is the mass of the steel ball, |
|||
g (gravity) is the 9.81 |
2 |
|
EA is the ultimate energy absorp- |
||
m/s , h = fall height of the steel ball, |
|||||
|
u |
||||
tion, Nu is number of impacts leading to an ultimate failure.
2.3.3. Heat Transfer Evaluation Test
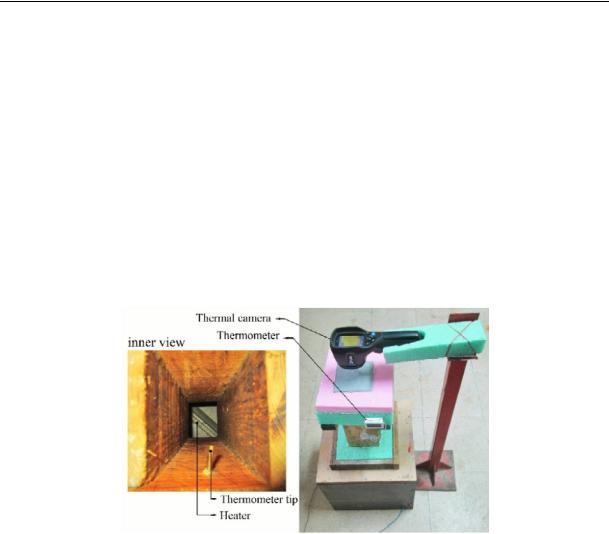
Since it is important to determine the thermal properties of the materials used in the exterior facades of buildings, the thermal conductivity of such materials continues to be investigated [28––31]. In this study the self-fabricated tool shown in Fig. 5 was used for heat transfer evaluation of the produced mortars having different mixes. The tool is made of wood, its lower (the larger) part was placed on a heat generating heater (500 Watt) and the head part was prepared for 100 × 100 mm slab specimens. In addition, a thermometer was placed on top of the tool to record the temperature of the bottom surface of the specimen continuously. It is not a requirement that the tool be completely insulated for the intended experiment, because all the experiments are performed under the same conditions (room temperature, heating time and heating energy; 500 Watt). The lower and the top part of the apparatus are 30 × 30 × 30 cm and 10 × 10 × 30 cm, respectively with the total height of 60 cm. The task of this tool is to apply a certain heat flow to the lower surface of the specimen within a certain period of time (45 min for this particular study). After the heat flow has taken place, the temperature change on the top surface of the specimen is measured after 5 minute intervals using a FLIR thermal camera.
Fig. 4. A self-fabricated tool for the low-velocity drop weight impact test
33
Russian Journal of Building Construction and Architecture
|
|
|
|
Table 3 |
|
|
The numbers of impacts required for the specimens to fail |
|
|||
|
|
|
|
|
|
Specimen code |
|
Impact number |
|
Averages |
|
|
|
|
of impact numbers |
||
group 1 |
group 2 |
group 3 |
|||
|
|||||
|
|
|
|
|
|
M1 |
40 |
32 |
38 |
36.67 |
|
|
|
|
|
|
|
M2 |
24 |
32 |
28 |
28 |
|
|
|
|
|
|
|
M3 |
33 |
39 |
29 |
33.67 |
|
|
|
|
|
|
|
M4 |
30 |
39 |
37 |
35.33 |
|
|
|
|
|
|
|
M5 |
27 |
35 |
30 |
30.67 |
|
|
|
|
|
|
|
M6 |
10 |
18 |
15 |
14.33 |
|
|
|
|
|
|
|
Fig. 5. A self-fabricated tool for heat transfer evaluation Test
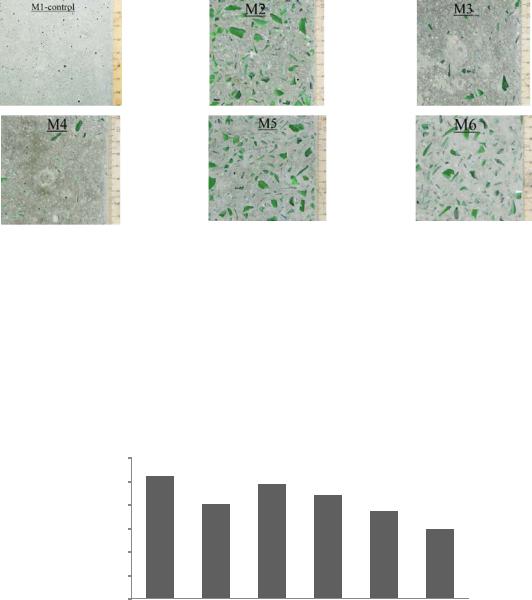
4. Results and Discussion 4.1. Architectural Appearance
The tiles obtained from the green glass wastes were dried after 48 hours of curing and then the back surfaces were slightly abraded. The abrasion process can be carried out after 7 days of drying, because the produced slabs become thoroughly hardened during this time. The slabs abraded from the back surface are shown in Fig. 6. In terms of the architecture, M2, M5 and M6 have the best aesthetic appearance, i.e. the specimens with a high percentage of green glass crumbs. Based on the images, it can also be concluded that the specimens containing glass crumbs and glass powder, especially M5 and M6, are less porous than the other ones. The reason for this is that glass for cementitious mortar provides selfcompacting properties [32––35] as it was also noticed during the mixing. In summary, when the glass aggregate and glass powder come together, their greenish and whiteness give a good aesthetic appearance for the tiles produced and are also easily self-compacted in the mold.
34
Issue № 4 (44), 2019 |
ISSN 2542-0526 |
Fig. 6. Aesthetic appearance of the architectural mortar containing the green glass aggregates and powder and standard sand
4.2. Mechanical Properties
4.2.1. Compressive Strength
The average compressive strength results of the specimens subjected to 28 days curing were calculated with Eq. (3) and are given in Fig. 7.
Compressive strength (MPa)
60 |
52,15 |
|
|
|
|
48,68 |
|
50 |
|
|
|
|
40,26 |
43,98 |
|
40 |
|
37,23 |
|
|
|
||
|
|
|
29,56
30
20
10
0
M1 |
M2 |
M3 |
M4 |
M5 |
M6 |
Specimens code
Fig. 7. Compression strength results of the specimens
According to the results, the compressive strengths of all the architectural mortars were reduced compared to the control specimen. It was determined that the compressive strength of mortars containing glass aggregates is also reduced compared to the control specimen in the study of Tung-Chai [13]. When the glass powder is added to the mortars and the amount of error increases, the compressive strength was lower than that of the other specimens. This status seems to be in M5 and M6. But the compressive strengths of these specimens (37.23 and 29.56, respectively) can be considered good values for use for architectural purposes. Anyway, the rea-
35
Russian Journal of Building Construction and Architecture
son for choosing a slightly higher ratio of cement in mix designs is balancing of the compressive strength. During the compressive test, glass breaking noises were heard from inside the specimen while the load was being applied.
C |
P |
. |
(3) |
|
|||
|
A |
|
|
Where σC, P and A are compressive strength, maximum applied load, and load applied area, respectively.
4.2.2. Flexural Strength
According to the ASTM D790-02 [36], the average flexural strength values for all the specimens were calculated using Eq. (4) and summarized in Fig. 8. As shown in Fig. 12, the lowest flexural strength result is related to M2. The M2 mortar only contains glass aggregate. As the glass material is known as a low tensile strength and a brittle material, it is expected that the tensile strength of the mortar as well as the flexural strength will decrease. Although the flexural strengths of the M5 and M6 specimens with good aesthetic appearance are somewhat lower than those of the control specimen, they are generally good values (6.73 and 6.58, respectively).
|
F |
|
3PL |
, |
(4) |
|
2Wh2 |
||||||
|
|
|
|
where σF, P, L, W, and h are flexural strength, maximum applied load, free span, width and specimens thickness, respectively.
Flexural strength (MPa)
9 |
8,21 |
7,88 |
7,43 |
|
8 |
|
|
||
|
|
|
||
7 |
|
5,86 |
6,73 |
6,58 |
|
|
|
||
6 |
|
|
|
|
|
|
|
|
5
4
3
2
1
0
M1 |
M2 |
M3 |
M4 |
M5 |
M6 |
Specimens code
Fig. 8. Flexural strength results of the specimen
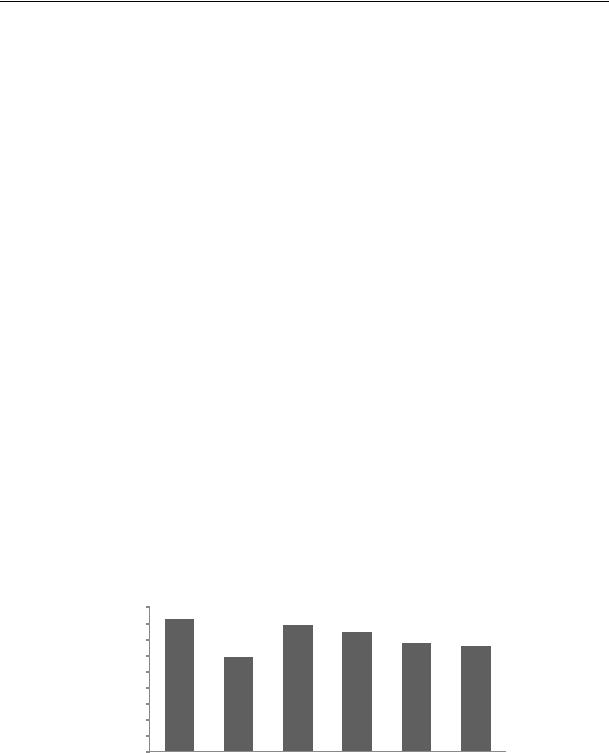
4.3. Impact Properties
In this test, the final amount of energy that the specimens adsorbed until the fracture was calculated from the (1) and (2) equations by dropping steel mass weighing 0.310 kg out at the
36

Issue № 4 (44), 2019 |
ISSN 2542-0526 |
drop height of 73 cm for the specimens. The ultimate energy values obtained up to the final failure of the slab specimens of 25 mm in thickness containing glass aggregates and powder changed with the amount change of the glass aggregate and powder. As shown in Fig. 9, the lowest value (31.81) is related with M6, i. e. the specimen containing both glass aggregate and the maximum amount of glass powder. However, the ultimate energy value of M5, which is similar to this specimen, is very close to the other specimens result. As mentioned in the section ''4.1. Architectural appearance'', M5 and M6 are similar in terms of material content and aesthetic appearance.
Energy Absorption |
(Joules) |
Ultimate |
|
90 |
|
81,41 |
|
74,75 |
78,43 |
|
|
|
|
|
|
||||
80 |
|
|
|
|
|
||
|
|
|
|
68,09 |
|
||
70 |
|
|
62,16 |
|
|
|
|
|
|
|
|
|
|
||
60 |
|
|
|
|
|
|
|
50 |
|
|
|
|
|
|
|
40 |
|
|
|
|
|
|
31,81 |
30 |
|
|
|
|
|
|
|
20 |
|
|
|
|
|
|
|
10 |
|
|
|
|
|
|
|
0 |
|
|
|
|
|
|
|
|
M1 |
M2 |
M3 |
M4 |
M5 |
M6 |
|
|
|
Specimens Code
Fig. 9. Comparison of the ultimate energy absorption results of slabs specimens
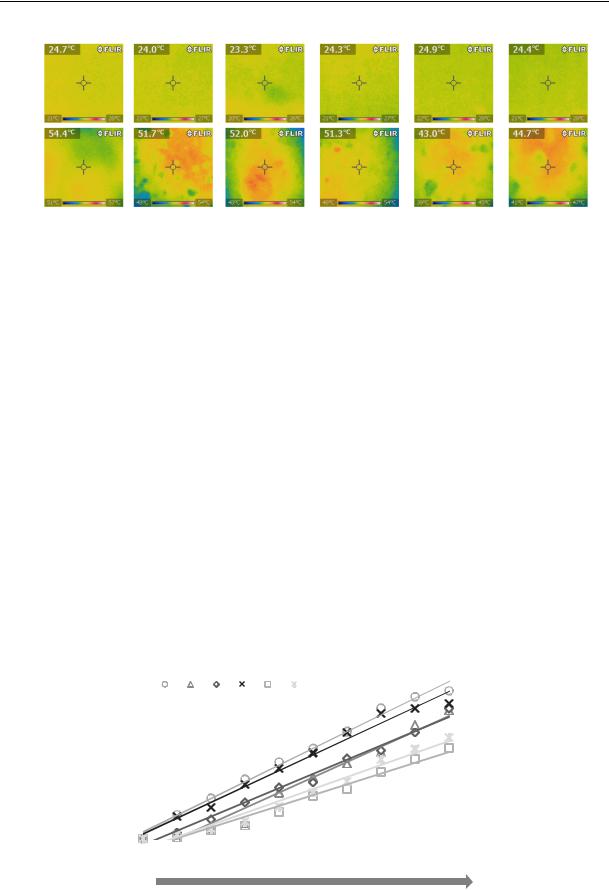
4.4. Heat Transfer Evaluation
The heat transfer experiments for all the specimens were carried out under the same conditions. The bottom surface temperatures of the specimens were measured with a thermometer and the upper surface temperature was measured with a thermal camera every 5 minutes. As an example, the thermal camera images of all the specimens are given in Fig. 10 for the beginning of heat application and the end of 45 minutes. All the obtained results are summarized in Table 4. Also, depending on the time, the temperature rise in the upper surface is graphically shown in Fig. 11 with a change of 24––100 C temperature on the bottom surface of the specimens. In this graph, the y-axis values are expressed as the difference between the temperature value measured at certain times (t = n) and the temperature at the beginning (t = 0) (equation 5). According to Fig. 11, the maximum slope belongs to M1 (control specimen) and the minimum slope belongs to M5 (glass aggregate-powder containing a specimen). This means that as result of applying heat of 24––100 C for 45 minutes the M1 specimen has more heat transfer than the others with the opposite about M5 which is more of an insulator than the other specimens.
T = (Tn – T0). |
(5) |
37
Russian Journal of Building Construction and Architecture
t = 0 min |
M1 |
M2 |
|
M3 |
|
M4 |
|
M5 |
|
M6 |
|
|
|
|
|
|
|
|
|
|
|
|
|
|
|
t = 45 min |
|
|
|
|
|
|
|
|
|
|
|
|
|
|
Fig. 10. Images taken from the top surfaces of the specimens using a thermal camera |
|
|||||||||
|
|
|
|
|
|
|
|
|
|
|
|
Table 4 |
|
|
|
The numbers of impacts required for the specimens to fail |
|
|
|
||||||
|
|
|
|
|
|
|
|
|
|
|
|
|
Specimens |
|
Specimen |
t = 0 |
t = 5 |
t = 10 |
t = 15 |
t = 20 |
t = 25 |
t = 30 |
t = 35 |
t = 40 |
t = 45 |
code |
|
direction |
min |
min |
min |
min |
min |
min |
min |
min |
min |
min |
|
|
|
|
|
|
|
|
|
|
|
|
|
M1 |
|
Top |
24.7 |
29.5 |
32.8 |
36.6 |
40.1 |
42.8 |
46.2 |
50.9 |
53.2 |
54.4 |
|
|
|
|
|
|
|
|
|
|
|
|
|
|
Bottom |
24.7 |
49.2 |
57.9 |
66.7 |
73.4 |
82.1 |
89.0 |
93.1 |
97.0 |
100.8 |
|
|
|
|||||||||||
|
|
|
|
|
|
|
|
|
|
|
|
|
M2 |
|
Top |
24.0 |
26.2 |
28.0 |
29.0 |
35.2 |
38.3 |
41.1 |
43.4 |
48.8 |
51.7 |
|
|
|
|
|
|
|
|
|
|
|
|
|
|
Bottom |
24.0 |
48.0 |
58.4 |
67.9 |
75.0 |
81.0 |
87.6 |
91.6 |
96.3 |
101 |
|
|
|
|||||||||||
|
|
|
|
|
|
|
|
|
|
|
|
|
M3 |
|
Top |
23.3 |
27.2 |
29.9 |
33.3 |
36.3 |
37.3 |
42.1 |
43.7 |
47.3 |
52.1 |
|
|
|
|
|
|
|
|
|
|
|
|
|
|
Bottom |
23.3 |
52.0 |
60.9 |
69.3 |
75.5 |
82.6 |
86.7 |
92.6 |
96.2 |
99.9 |
|
|
|
|||||||||||
|
|
|
|
|
|
|
|
|
|
|
|
|
M4 |
|
Top |
24.3 |
28.7 |
30.5 |
35.0 |
38.3 |
41.4 |
45.5 |
49.3 |
50.4 |
51.3 |
|
|
|
|
|
|
|
|
|
|
|
|
|
|
Bottom |
24.3 |
54.1 |
65.4 |
74.2 |
79.3 |
83.7 |
89.5 |
93.5 |
97.8 |
101.0 |
|
|
|
|||||||||||
|
|
|
|
|
|
|
|
|
|
|
|
|
M5 |
|
Top |
24.9 |
25.0 |
26.5 |
27.4 |
30.1 |
33.4 |
34.7 |
38.2 |
40.8 |
43.0 |
|
|
|
|
|
|
|
|
|
|
|
|
|
|
Bottom |
24.9 |
46.5 |
54.2 |
63.5 |
69.7 |
74.2 |
80.4 |
84.3 |
88.8 |
92.8 |
|
|
|
|||||||||||
|
|
|
|
|
|
|
|
|
|
|
|
|
M6 |
|
Top |
24.4 |
25.1 |
26.3 |
27.7 |
30.7 |
33.6 |
35.8 |
40.2 |
42.3 |
44.6 |
|
|
|
|
|
|
|
|
|
|
|
|
|
|
Bottom |
24.4 |
44.5 |
56.5 |
65.0 |
70.1 |
76.1 |
81.8 |
87.5 |
91.6 |
94.6 |
|
|
|
|||||||||||
|
|
|
|
|
|
|
|
|
|
|
|
|
Increasingsurface temperature (C)
35 |
|
|
M1 |
M2 |
M3 |
M4 |
|
M5 |
M6 |
||||
|
|
||||||||||||
30 |
|
|
|
||||||||||
|
|
|
|||||||||||
|
|
|
|||||||||||
|
|
|
|
|
|
|
|
|
|
|
|
|
|
25 |
|
|
|
|
|
|
|
|
|
|
|
|
|
20 |
|
|
|
|
|
|
|
|
|
|
|
|
|
15 |
|
|
|
|
|
|
|
|
|
|
|
|
|
10 |
|
|
|
|
|
|
|
|
|
|
|
|
|
5 |
|
|
|
|
|
|
|
|
|
|
|
|
|
0 |
|
|
|
|
|
|
|
|
|
|
|
|
|
|
|
|
|
|
|
|
|
|
|
|
|
|
|
|
|
|
|
|
|
|
|
|
|
|
|
|
|
|
|
|
|
|
|
|
|
|
|
|
|
|
|
|
|
|
|
|
|
|
|
|
|
|
|
||
|
|
|
|
|
|
|
|
|
|
|
|
|
|
|
|
|
|
|
|
|
|
|
|
|
|
|
|
0 |
5 |
10 |
15 |
20 |
25 |
30 |
35 |
40 |
45 |
50 |
|
|
|
|
|
|
|
Time, (min) |
|
|
|
|
|
24 C |
|
|
|
|
|
Heat flow |
|
|
|
|
100 C |
|
|
|
|
|
|
|
|
|
|
|
|
Fig. 11. Temperature increasing in the specimen surfaces depending on the time
38
Issue № 4 (44), 2019 |
ISSN 2542-0526 |
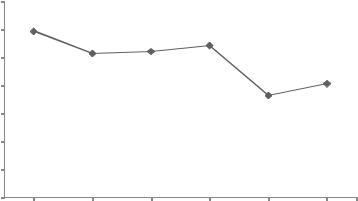
According to the results reported from Table 4 and Fig. 11, the maximum temperature increase occurring on the top surfaces of the specimens at the end of 45 min can be summarized as shown in the graph in Fig 12. The minimum increase was observed in M5, with a value of 18.2. The heat transfer ability of all specimens containing glass aggregate and glass powder were reduced compared to the control specimen. Among them, M5, which contains glass aggregate and glass powder together, exhibited a lower heat conduction behavior than the others. It has also been determined that the heat permeability of M6, which is similar to M5 (in terms of mixture), is lower than other specimens but more than that of M5. Therefore, for this study the ratio of the glass powder to the glass aggregate of 1/3 as selected in M5 seems appropriate.
temperature |
35 |
|
|
|
|
|
30 |
|
|
|
|
|
|
25 |
|
|
|
|
|
|
increasing surface C)( |
|
|
|
|
|
|
20 |
|
|
|
|
|
|
15 |
|
|
|
|
|
|
10 |
|
|
|
|
|
|
Maximum |
5 |
|
|
|
|
|
0 |
|
|
|
|
|
|
|
|
|
|
|
|
|
|
M1 |
M2 |
M3 |
M4 |
M5 |
M6 |
Specimens Code
Fig. 12. Temperature increasing in the specimen surfaces depending on the time
Conclusion. Waste glass products (aggregate, powder) are used in cementitious materials for different purposes. In this study, the evaluation and mechanical and thermal properties of the mortar produced by using the aggregates and powders obtained from the waste green glass were examined for architectural tiles.
In terms of aesthetic appearance, the specimens which are not used in sand but produced only from cement and glass products are chosen as the best mortars. Also, the specimens containing glass crumbs and glass powder, especially M5 and M6, are less porous than the other ones. The reason for this is that glass for cementitious mortar provides self-compacting properties, as it is noticed also during mixing.
When the glass powder is added to the mortars and the number of error increases, the compressive strength was lower than that of the other specimens. This status seems to be in M5 and M6. But the compressive strengths of these specimens (37.23 and 29.56, respectively) can
39