

3456
.pdfIssue № 4(32), 2016 |
ISSN 2075-0811 |
2.Kokodeeva N. E. Otsenka kachestva sushchestvuyushchikh dorozhnykh odezhd nezhestkogo tipa s uchetom variatsii vlazhnosti grunta zemlyanogo polotna (s pozitsii teorii riska). Diss. … kand. tekhn. nauk [Quality assessment of existing road pavement of non-rigid type, taking into account variations of soil moisture of the subgrade (from the standpoint of the theory of risk). Dr. eng. sci. diss.]. Saratov, 2001. 148 p.
3.Kokodeeva N. E. Metodologicheskie osnovy kompleksnoy otsenki nadezhnosti avtomobil'nykh dorog v sisteme tekhnicheskogo regulirovaniya dorozhnogo khozyaystva. Avtoref. dis. d-ra. tekhn. nauk [Methodological basis of the comprehensive reliability assessment of highways in the system of technical regulation of road management. Abstract Dr. eng. sci. diss.]. Saint Petersburg, 2012. 350 p.
4.Moskalev O. Yu., Kokodeeva N. E. Uchet sloya kompozita «geoyacheyki + material» pri prognozirovanii
koeffitsienta variatsii ekvivalentnogo modulya uprugosti [A view of layers of a composite "geocells + material" in the prediction of the coefficient of variation of equivalent elastic modulus]. Stroitel'nye materialy, 2014, no. 11, pp. 12––15.
5.Kochetkov A. V., Kokodeeva N. E., Rapoport P. B., Rapoport N. V., Shashkov I. G. Sostoyanie sovremennogo metodicheskogo obespecheniya rascheta i konstruirovaniya dorozhnykh odezhd [The state of modern methodological support of calculating and designing of pavement]. Vestnik PGTU. Transport. Transportnye sooruzheniya. Ekologiya, 2011, no. 1, pp. 65—74.
6.Kokodeeva N. E., Moskalev O. Yu. Raschet sroka sluzhby dorozhnoy odezhdy perekhodnogo tipa, armirovannoy geoyacheykami (na osnove teorii riska) [The calculation of the service life of the pavement transition type, reinforced geocache (based on risk theory)]. Stroitel'nye materialy, 2012, no. 1, pp. 58––59.
7.Moskalev O. Yu., Kokodeeva N. E., Yankovskiy L. V. Primenenie geosinteticheskikh materialov v dorozhnykh odezhdakh nezhestkogo tipa [The use of geosynthetics in road clothes non-rigid type]. Vestnik PGTU. Okhrana okruzhayushchey sredy, transport, bezopasnost' zhiznedeyatel'nosti, 2011, no. 2, pp. 69––78.
8.Kokodeeva N. E., Moskalev O. Yu., Malyshev E. V. O vliyanii sloya kompozita na osnove geosotovogo materiala na rabotu dorozhnoy odezhdy [About the influence of the layer of composite on the basis eastboro material to work pavement]. Dorogi i mosty, 2014, no. 32/4, pp. 55—69.
9.Kokodeeva N. E., Stolyarov V. V. Tamozhennyy soyuz: normativnoe obespechenie [Customs Union: regulatory support]. Standarty i kachestvo, 2011, no. 8, pp. 22—27.
10.Kokodeeva N. E. Sostoyanie i perspektivy razvitiya sistemy tekhnicheskogo regulirovaniya v Rossiyskoy Federatsii [The state and prospects of development of system of technical regulation in the Russian Federation].
Tekhnicheskoe regulirovanie v transportnom stroitel'stve, 2014, no. 4 (8). Available at: trts.esrae.ru/14-41
11. Lenshin A. S., Kashkarov V. M., Seredin P. V. et. al. Study of the morphological growth features and optical characteristics of multilayer porous silicon samples grown on n-type substrates with an epitaxially deposited p(+)-layer. SEMICONDUCTORS, 2012, vol. 46, iss. 8, pp. 1079––1084.
51

Scientific Herald of the Voronezh State University of Architecture and Civil Engineering. Construction and Architecture
UDC 625.768.6.004.5
T. V. Samodurova1, O. V. Gladysheva2
ESTIMATED BLIZZARDS PARAMETERS FOR WINTER ROAD MAINTENANCE
Voronezh State Technical University
Russia, Voronezh, tel.: +7(473)271-52-02; e-mail: ov-glad@ya.ru
1D. Sc. in Engineering, Prof. of the Dept. of Roads and Bridges Designing
2PhD in Engineering, Assoc. Prof. of Dept. of Roads and Bridges Designing
Statement of the problem. The main research objective is to define the estimated blizzards parameters using the meteorological data necessary for the determination of estimated blizzards parameters. The presented paper shows mathematical models for the calculation and statistical processing of modeling results.
Results. The paper presented mathematical models for the determination of the estimated blizzards parameters (blizzards duration, volumes of snow drifting and snow accumulation on the roads). The presented modeling results were verified experimentally on the seasoned road sections. The list of meteorological and road data is presented. The snow survey methodology was shown.
Conclusions. The estimated blizzards parameters influencing the road reliability and traffic safety during the winter period were determined using the system approach basis. The experimental verification of the models showed the possibility of applying the model for solving tasks of winter road maintenance.
Keywords: Roads, Blizzard, Snow Accumulation Volume, Meteorological Data.
Introduction
For the purpose of providing road safety in winter the road service team carries out a complex of activities. The standards in force for winter service presuppose timely removal of ice sediments and clearing of the road surface from snow.
The main type of winter slipperiness on most of the territory of Russia is snow deposits. The intensity of the snow blockades depends on large number of factors, both weather and road. The quantitative estimation of those factors is an important problem. The presented paper is focused on the systematic approach to the definition of estimated blizzards parameters using the meteorological data necessary for the determination of estimated blizzards parameters. Mathematical models for the calculation and statistical processing of modeling results are carried out.
System approach to defining the estimated blizzards parameters. For the study of snowdrifts formation on the roads the subsystem “Environment – Road” (E-R) was considered. The solution of the given problem can be solved with the use of common approaches to the theory of complex systems modeling [1, 2].
© Samodurova T. V., Gladysheva O. V., 2016
52

Issue № 4(32), 2016 |
ISSN 2075-0811 |
The law of functioning of the subsystem R-E can be presented by a generalized operator f which transforms a set of internal independent parameters of the subsystem into the external, dependent variables.
The amount of snow accumulation KSP (that accumulates after a blizzard or due the snow drifting to a road during the whole winter) is taken as the output parameter in the solving problem. The internal parameters of the system are the road and meteorological factors influencing the snow accumulation volume on the road section. The general model is the following:
|
|
||
KSP f ( |
h |
(t), a(t),t), |
(1) |
where KSP is a quantity of snow accumulation on the road surface; f is the law of system functioning; h t = {h1(t), h2(t),…,hk(t)} is the vector parameter of external environment (meteorological parameters); a t = {a1(t), a2(t),…,ak(t)} is the vector parameters of the system own factors (road parameters); t is time.
Internal system parameters are divided into two groups: meteorological and traffic. Weather conditions determine the impact of the external environment, while traffic parameters determine the snow accumulation on the road during a blizzard [3, 4, 5, 6].
The environment parameters are presented in Table 1.
|
|
|
Table 1 |
|
|
Components of the vector of weather factors |
|
||
|
|
|
|
|
Components of the vec- |
|
Parameter |
|
|
tor of weather |
Parameter name |
Unit |
||
symbol |
||||
factors |
|
|
||
|
|
|
||
|
|
|
|
|
h1(t) |
atmospheric phenomenon (type of precipitation ) |
|
|
|
|
|
|
|
|
h2(t) |
starting time of the phenomenon |
tn |
hour |
|
|
|
|
|
|
h3(t) |
ending time of the phenomenon |
tk |
hour |
|
|
|
|
|
|
h4(t) |
wind speed |
V |
m/seс |
|
|
|
|
|
|
h5(t) |
wind direction |
i |
compass point |
|
|
|
|
|
|
h6(t) |
blizzard type |
|
|
|
|
|
|
|
|
h7(t) |
air temperature |
T |
0С |
|
h8(t) |
duration of the phenomenon |
t |
hour |
|
|
|
|
|
|
h9(t) |
blizzard intensity |
I |
m3/sec |
|
|
|
|
|
|
h10(t) |
snow drifting volume |
δ |
t/m3 |
|
|
|
|
|
|
h11(t) |
snow accumulation volume (left on the road) |
Wb.l |
m3/m |
|
|
|
|
|
|
h12(t) |
snow accumulation volume (right on the road) |
Wb.r |
m3/m |
|
|
|
|
|
|
h13(t) |
volume of snow accumulation during the estimated |
Wb |
m3/m |
|
blizzard |
||||
|
|
|
||
|
|
|
|
|
53

Scientific Herald of the Voronezh State University of Architecture and Civil Engineering. Construction and Architecture
A part of the meteorological factors vector (h1 – h7) can be obtained using the observation data from the State Meteorological Stations. The other components (h8 – h13) are determined by calculation.
The traffic parameters can be obtained from the road project, technical data, diagnostic results or by special road inspection and. They are presented in Table 2.
|
|
Table 2 |
|
|
Components of the vector of road factors |
|
|
|
|
|
|
Components of the |
Name of parameter |
Unit |
|
vector of road factors |
|||
|
|
||
|
|
|
|
a1(t) |
road direction |
compass point |
|
|
|
|
|
a2(t) |
working mark (height of embankment, depth of ditch) |
Н |
|
|
|
|
|
|
geometrical parameters of cross-section of road |
|
|
|
|
|
|
a3(t) |
slopes ramp of ditch |
m1 |
|
|
|
|
|
a4(t) |
slopes ramp of embankment (ditch) |
m2 |
|
|
|
|
|
a5(t) |
slopes ramp of ditch of ditch |
m3 |
|
|
|
|
|
a6(t) |
width of ditch |
l1 |
|
|
|
|
|
a7(t) |
width of ditch shelf |
l2 |
|
|
|
|
|
a8(t) |
depth of ditch |
h |
|
|
|
|
|
a9(t) |
width of road shoulder |
а |
|
|
|
|
|
a10(t) |
width of carriageway |
b |
|
|
|
|
|
a11(t) |
width of road surface |
В |
|
|
|
|
|
a12(t) |
cross-section slope of carriageway |
i1 |
|
|
|
|
|
a13(t) |
cross-section slope of road shoulder |
i2 |
|
|
|
|
|
a14(t) |
availability and type of snow protection |
–– |
|
|
|
|
The models for the calculation. For the detection of snow accumulation volumes the method of the summarized snow transfer suggested by D.M. Melnik is used [7]. The method takes into consideration the intensity of snow transfer, which depends on the wind speed and the time of a snowdrift with the given intensity.
The volume of snow transfer in winter period (Wt) is calculated by the formula:
|
t |
m |
|
|
|
Wt |
C Vi |
3 Iс t, |
(2) |
||
|
|||||
|
m i 1,(V 5) |
|
|
||
where t is the summary duration of blizzards for winter period, hour; m is the number of measurements of the wind speed during blizzards (at speeds over 5 m/sec); C is an empiric factor which is equal to 0,00046 when the average density of the fresh brought snow is 0,17 m3/m; Vi is the wind speed during blizzards, m/seс; Ic is the average intensity of blizzards during the entire winter period (m3/m hour).
54
Issue № 4(32), 2016 |
ISSN 2075-0811 |
The volume of the snow accumulation on an auto road at the end of the winter period from one direction (Wsb) is calculated according to the formula:
Wsb Wt sin r i , |
(4) |
where αr is the direction of the highway, degrees; αi is the direction of the wind, degrees.
The volume of the snow accumulation at one side of the auto road in winter (Wb ) is calculated according to the formula:
7 |
|
|
Wb Wsb,i sin д i |
, |
(5) |
i 1
where Wb is the amount of snow brought to one side of the road (m3/m); Wsb,i is the snow drifting volume by one compass point (m3/m); αi is the azimuth of compass points, degree; αr is road azimuth, degree.
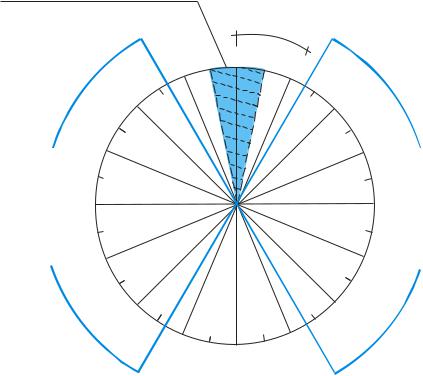
For each road direction the number of compass points in which the snowdrift is calculated equals 7. Counting the volume of snow transfer, winds blowing at an angle less than 30˚ are not taken into consideration. Figure 1 gives the scheme of calculating of directions from which the snow is brought to one side of the auto road directed northward.
Snow accumulation from the North
|
|
|
|
|
|
|
|
3 |
|
|
|
N |
||
|
|
|
|
|
|
|
|
|
|
|
|
|||
|
|
|
|
|
|
|
|
2 |
|
|
N |
|||
|
|
|
|
|
|
|
|
|
6 |
|
||||
|
|
|
|
|
|
|
|
|
|
, |
W |
|||
|
|
|
|
|
|
|
|
|
|
2 |
|
|||
|
|
|
|
|
|
|
|
|
|
|
5 |
|
||
|
|
|
|
|
|
|
|
|
|
|
|
|
0 |
|
|
|
|
|
|
|
|
|
N |
|
|
|
|
|
|
|
|
|
3 |
|
|
|
W |
|
|
|
|
|
||
|
|
|
|
|
|
|
|
|
|
|
|
|
||
|
|
|
|
0 |
|
|
|
|
|
|
|
|
|
|
|
|
|
|
|
3 |
|
|
|
|
|
|
|
|
|
|
|
|
|
|
|
, |
0 |
|
|
|
|
|
|
|
|
|
|
|
|
|
7 |
|
|
|
|
|
|
||
|
|
|
|
|
|
|
5 |
|
|
|
|
|
|
|
|
|
|
W |
|
|
|
|
|
|
|
|
|
|
|
|
|
|
|
N |
W |
|
|
|
|
|
|
|
||
road |
|
|
|
|
|
|
|
|
|
|
|
|
||
81 |
|
|
|
|
|
|
|
|
|
|
|
|
||
|
2 |
|
,2 |
|
0 |
|
|
|
|
|
|
|
|
|
of the |
|
|
5 |
|
|
|
|
|
|
|
|
|
|
|
|
|
W |
|
|
|
|
|
|
|
|
|
|||
side |
|
|
|
|
|
|
|
|
|
|
|
|
|
|
Left |
|
|
|
0 |
|
|
|
|
|
|
|
|
|
|
|
|
5 |
|
|
|
|
|
|
|
|
|
|
||
|
,7 |
|
|
|
|
|
|
|
|
|
|
|
||
8 |
|
|
|
|
|
|
|
|
|
|
|
|
||
|
25 |
|
|
|
|
|
|
|
|
|
|
|
|
|
|
|
|
|
|
W |
|
|
|
|
|
|
|
||
|
|
|
|
S |
|
|
|
|
|
|
|
|
||
|
|
|
W |
|
|
|
|
|
|
|
|
|
|
|
|
|
|
|
|
|
|
0 |
|
|
|
|
|
|
|
|
|
|
|
|
|
|
5 |
|
|
|
|
|
|
|
|
|
|
|
|
|
|
2 |
|
|
|
|
|
|
|
|
|
|
|
|
|
, |
|
|
|
|
|
|
|
|
|
|
|
|
|
6 |
|
|
|
|
|
|
|
||
|
|
|
|
3 |
|
|
|
|
|
|
|
|
||
|
|
|
2 |
|
|
W |
|
|
|
|
|
|
||
|
|
|
|
|
|
|
|
|
|
|
|
|
|
|
|
|
|
|
|
|
|
|
S |
|
|
|
|
|
|
|
|
|
|
|
|
|
|
|
|
|
|
|
0 |
|
|
|
|
|
|
|
|
|
|
|
3 |
, |
7 |
5 |
SW |
|
|
|
|
|
|
|
|
|
1 |
|
||||
|
|
|
|
|
|
|
|
2 |
|
|
|
|||
|
|
|
|
|
|
|
|
|
|
|
|
|||
|
|
|
|
|
|
|
|
|
|
|
|
|
|
S |
3 4 8
, 7
5 0
0 5 2 , 1 9 1
N
S
22,5 |
0 |
|
|
|
|
|
|
|
|
|
|
|
|
|
|
|
|
|
0 |
|
|
|
|
|
|
|
|
|
|
|
|
|
|
|
|
|
|
5 |
|
|
|
|
|
|
|
|
|
|
|
|
|
|
|
|
|
|
2 |
|
|
|
|
|
|
|
|
|
|
|
|
|
|
|
|
|
|
, |
|
|
E |
|
|
|
|
|
|
|
|
|
|
|
|
|
|
|
1 |
|
|
|
|
|
|
|
|
|
|
|
|
|
|
|
|
|
|
1 |
|
|
N |
|
|
|
0 |
|
|
|
|
|
|
|
|
|
|
|
|
|
N |
|
|
3 |
, 7 |
5 |
|
|
|
|
|
|
|
|
|
|
|
|
|
|
|
3 |
|
|
|
|
|
|
|
|
|
|
|
|
||
|
|
|
|
|
|
|
|
|
|
|
|
|
|
|
|
|
||
|
|
|
|
|
|
|
E |
|
|
|
|
|
|
|
|
|
|
|
|
|
|
|
|
|
|
|
|
|
|
|
|
|
|
|
|
|
|
|
|
|
|
|
|
|
|
N |
|
|
|
0 |
|
|
|
|
|
|
|
|
|
|
|
|
|
|
|
|
|
5 |
|
|
|
|
|
|
|
|
|
|
|
|
|
|
|
|
|
2 |
|
|
|
|
|
|
||
|
|
|
|
|
|
|
|
|
|
, |
|
|
|
|
|
|
|
|
|
|
|
|
|
|
|
|
|
6 |
|
|
|
|
|
|
|
||
|
|
|
|
|
|
|
|
|
5 |
|
|
|
|
|
|
|
|
|
|
|
|
|
|
|
|
|
|
|
|
|
|
E |
|
|
|
||
|
|
|
|
|
|
|
|
|
|
|
|
N |
|
|
|
|
||
|
|
|
|
|
|
|
|
|
|
|
E |
|
|
|
|
|
|
|
|
|
|
|
|
|
|
|
|
|
|
|
|
|
|
|
|
0 |
|
|
|
|
|
|
|
|
|
|
|
|
|
|
|
|
|
5 |
|
|
|
|
|
|
|
|
|
|
|
|
|
|
|
|
|
,7 |
|
|
|
|
|
|
|
|
|
|
|
|
|
|
|
|
8 |
|
|
|
||
|
|
|
|
|
|
|
|
|
|
|
|
7 |
|
|
|
|
||
|
|
|
|
|
|
|
|
|
|
|
|
|
E |
|
|
|
||
|
|
|
|
|
|
|
|
|
|
|
|
10 |
|
2 |
0 |
|||
|
|
|
|
|
|
|
|
|
|
|
|
|
|
1, |
|
|||
|
|
|
|
|
|
|
|
|
|
|
|
|
|
|
|
|
5 |
|
|
|
|
|
|
|
|
|
|
|
|
E |
|
|
|
|
|
|
|
|
|
|
|
|
|
|
|
|
|
|
|
SE |
|
|
|
|||
|
|
|
|
|
|
|
|
|
1 |
|
|
|
|
|
|
|
|
|
|
|
|
|
|
|
|
|
|
2 |
|
|
|
|
|
|
|
|
|
|
|
|
|
|
|
|
|
|
|
3 |
|
|
|
|
|
|
|
|
|
|
|
|
|
|
|
|
|
|
|
, |
|
0 |
|
|
|
|
|
|
|
|
|
|
|
|
|
|
|
|
7 |
|
|
|
|
|
||
|
|
|
|
|
|
|
S |
|
|
|
5 |
|
|
|
|
|
||
|
|
|
|
|
|
|
|
|
|
|
|
|
|
|
|
|
||
|
|
|
|
|
|
|
|
E |
|
|
|
|
|
|
|
|
|
|
|
|
|
|
1 |
|
|
|
|
|
|
|
|
|
|
|
|
||
|
|
|
|
4 |
|
|
|
|
|
|
|
|
|
|
|
|
||
|
|
|
|
6 |
|
|
|
|
|
|
|
|
|
|
|
|||
|
S |
|
|
, |
|
|
|
|
|
|
|
|
|
|
|
|||
1 |
|
S |
|
|
2 |
|
|
|
|
|
|
|
|
|
|
|
||
|
|
|
|
|
5 |
|
|
|
|
|
|
|
|
|
|
|||
|
E |
|
|
|
|
0 |
|
|
|
|
|
|
|
|
|
|
||
6 |
|
|
|
|
|
|
|
|
|
|
|
|
|
|
|
|
|
|
8 |
|
|
|
|
|
|
|
|
|
|
|
|
|
|
|
|
|
|
, |
|
|
|
|
|
|
|
|
|
|
|
|
|
|
|
|
|
|
7 |
|
|
|
|
|
|
|
|
|
|
|
|
|
|
|
|
|
|
5 |
|
|
|
|
|
|
|
|
|
|
|
|
|
|
|
|
|
|
0 |
|
|
|
|
|
|
|
|
|
|
|
|
|
|
|
|
|
|
road the of side Right
Fig. 1. Scheme of the calculation of snowdrift on the road directed northward
55

Scientific Herald of the Voronezh State University of Architecture and Civil Engineering. Construction and Architecture
The zone of each direction (at 16 compass points) is determined by the sector with the arc of
22,5˚.To estimate the blizzards parameters the statistical analysis of the modeling results is carried out. The method of Federal Service for Hydrometeorology and Environmental is used for statistical processing [8]. Based on the calculation, the results the descending series of parameters are compiled.
For each series unit the empirical probability of exceeding is calculated
p |
|
|
m |
|
100%, |
(6) |
э |
n |
|
||||
|
|
1 |
|
|||
|
|
|
|
|||
where m is the serial number of series unit; n is the length of series (number of observation years).
The three-parameter gamma-distribution is taken for smoothing of empirical data and extrapolation of calculated parameters [8].
The integral curve characterizes the probability of exceeding the existing values of parameter and represents the integral of binomial distribution curve of continuous random variables
|
|
|
|
|
P(x) |
|
x 1 e x dx, |
(7) |
|
|
|
|||
|
|
|||
|
Г ( ) x |
|
||
|
|
|
0 |
|
where Г(α) is the gamma function or Euler integral of the second kind.
Statistical processing resulted in acquisition of the parameters of estimated blizzard were obtained, i.e. the snow accumulation volume on a section of a highway, the blizzard duration with a different probability of exceeding, and the snow accumulation volume during the winter period. Special attention has been given to blizzards with the maximum values of parameters.
The seasoned road section was selected for the study of blizzard characteristics, a meteorological station was identified (experimental site is located within the area of the meteorological station), and meteorological station data from 42 winters has been received. On the basis of the meteorological station data the modeling and statistical analysis were conducted. The maximum snow accumulation volumes for each year and the estimated snow accumulation volumes with different probability of exceeding were determined.
The experimental verification of the models. The experimental verification of the models has been done for the three seasoned road sections. During the experimental work adequateness of the models was tested according to the snow volume measurements.
The snow survey methodology provides the determination of the actual snow volume on the embankments subgrade according to the snow cover height and snow length parameters on
56
Issue № 4(32), 2016 |
ISSN 2075-0811 |
the basis of their geometric parameters [9, 10]. Tachometry has been conducted to determine the embankments geometrical parameters at selected seasoned road sections. The determined marks are subgrade verge, the bottom ditch and land marks in field at the distance of 15––20 m from the ditch embankment. In winter, with the leveling rods, the snowdrift height at the typical points of the land cross sections and at the points of snowdrift shape and height change were measured, snow shafts were measured on the verge. Simultaneously, the snow density detection in snow accumulation zones was performed using the cutting ring. The cross sections on experimental open roadways and snow accumulation profiles were used for the calculation of the actual snow volume by their geometric shapes [9, 10].
Snowdrift measurements were performed after the intense blizzard or in late winter. If the snowdrift measurements were made in late winter with taking into account the determining of the snowdrift volume, the snow losses from melting and evaporation during thaws affected the changes in snowdrift density.
The data obtained from meteorological stations for corresponding winter periods were used to calculate the volume of snow accumulation. The calculation results are shown in Table 3.
The convergence of the calculated and actual data on snowdrift volume is about 88% in average [9, 10]. Therefore, we can conclude about the possibility of applying the model for solving tasks of winter road maintenance.
|
|
|
|
|
|
|
|
|
|
Table 3 |
|
|
Results of the experiment |
|
|
|
|
||||
|
|
|
|
|
|
|
|
|
|
|
|
|
|
Volume |
|
|
|
Volume |
|
||
|
Location of |
of snow deposits |
Conver- |
|
of snow deposits |
Conver- |
||||
Name of the road |
road sec- |
(left), m3/m |
gence, |
|
(right), m3/m |
gence, |
||||
|
tion, km |
|
|
|
% |
|
|
|
|
% |
|
snow |
|
calculation |
|
snow |
|
calculation |
|||
|
|
survey |
|
|
survey |
|
||||
|
|
|
|
|
|
|
||||
|
|
|
|
|
|
|
|
|
|
|
The site of the |
306+850 |
11,86 |
|
8,84 |
74,7 |
|
15,00 |
|
10,04 |
66,9 |
highway "Cri- |
|
|
|
|
|
|
|
|
|
|
308+100 |
13,02 |
|
11,13 |
85,5 |
|
16,74 |
|
13,27 |
79,3 |
|
mea" in the Orel |
|
|
|
|
|
|
|
|
|
|
308+400 |
14,47 |
|
16,97 |
82,7 |
|
15,92 |
|
17,27 |
91,5 |
|
region |
|
|
|
|
|
|
|
|
|
|
309+350 |
|
|
|
|
|
13,55 |
|
13,79 |
98,2 |
|
|
|
|
|
|
|
|
|
|
|
|
|
313+055 |
|
|
|
|
|
28,30 |
|
22,03 |
78,1 |
|
|
|
|
|
|
|
|
|
|
|
|
317+260 |
8,26 |
|
7,74 |
93,7 |
|
20,50 |
|
16,50 |
80,5 |
|
|
|
|
|
|
|
|
|
|
|
Kursk-Saratov |
171+200 |
16,91 |
|
16,83 |
99,5 |
|
|
|
|
|
road in Voronezh |
|
|
|
|
|
|
|
|
|
|
179+440 |
15,22 |
|
11,92 |
78,3 |
|
|
|
|
|
|
region |
|
|
|
|
|
|
|
|
|
|
179+900 |
14,61 |
|
15,85 |
91,5 |
|
|
|
|
|
|
|
|
|
|
|
|
|
|
|
|
|
57

Scientific Herald of the Voronezh State University of Architecture and Civil Engineering. Construction and Architecture
Conclusions
The estimated blizzards parameters influencing the road reliability and traffic safety during the winter period were determined using the system approach basis. The meteorological data necessary for calculating of estimated blizzards parameters was determined.
The volume of snow deposits moved to the ditch and on the slopes during the snow removal work was not taken into account in the numerical experiment. The analysis of the results showed that the convergence will be increased with the availability of data about snow removal operations. Therefore, we can conclude the possibility of the use of models for applications and further researches of snow deposits on roads.
References
1.Sovetov B. J., Jakovlev S. A. Systems modeling. Мoscow, Vishaja shkola, 2001. – 343 p.
2.Samodurova T. V., Gladysheva O. V., Fedorova J. V. Modeling pollution on a roadside strip during winter period. International journal of pavement research and technology, Chinese Society of Pavement Engineering, 2010, no. 2, pp. 65––72.
3.Gladysheva O. Estimation amount of snow deposit on the road. 14th International road Weather Conference. Prague, Czech Republic, 2008. p.19.
4.Samodurova T. V., Gladysheva O. V. Determination of snow amount on the road subgrade. Higher Education Institutions Proceedings. Construction, 2003, no. 8, pp. 94––100.
5.Sato T., Kosugi K., Sato A. Estimation of blowing snow and related visibility distributions above snow covers with different hardness. Proc. of 11-th SIRWEC Conference. Sapporo, Japan, 2002.
6.Tabler R. D. Controlling blowing and drifting snow with snow fences and road design. Niwot, Colorado, Tabler and associates, 2003. 307 p.
7.Melnik D. M. About laws of snow transport and their use in snow-drift control. Technics of railways, 1952, no. 11, pp. 16––21.
8.Rozhdestvensky A. V., Chebotarev A. I. Statistical methods in hydrology. L., Gidrometeoizdat, 1974. 424 p.
9.Samodurova T. V., Gladysheva O. V., Alimova N. Y., Shiryayeva S. M. Verification the adequacy of models to estimate of snow deposits on the roads. Scientific Bulletin of the Voronezh State University of Architecture and Civil Engineering, Construction and architecture, 2013, no. 1 (29), pp. 66––74.
10.Samodurova T. V., Gladysheva O. V., Alimova N. Y., Shiryayeva S. M. Snowdrifts formation on road em-
bankments. 7th International conference «Snow engineering VII», Proceedings. Fukui, Japan, 2012,
pp. 442––449.
11. Seredin P. V., Glotov A. V., Ternovaya V. E. et. al. Spinodal decomposition of Ga (x) In1-x As (y) P1-y quaternary alloys SEMICONDUCTORS, 2011, vol. 45, iss. 11, pp. 1433––1440.
58

Issue № 4(32), 2016 |
ISSN 2075-0811 |
BUILDING MECHANICS
UDC 624.014.27, 624.046
D. M. Shapiro1
USING ELASTIC SOLUTIONS FOR ELASTIC PLASTIC PROBLEMS
Voronezh State Technical University
Russia, Voronezh, tel.: +7-910-344-73-34, e-mail: davshap@mail.ru
1D. Sc. in Engineering, Prof. of Dept. of Structural Mechanics
Statement of the problem. Modern literature presents solutions of non-linear problems as descriptions of mathematical procedures without a physical (engineering) component presenting certain forms of plastic deformation of the computed areas.
Results. The process of obtaining enabling equations for iteration in the solution of elastic plastic problems in construction mechanics using elastic solutions for “initial stresses”. Deformations of the computed areas are assumed to include linear (elastic) and plastic parts according to the Prandtl diagram. The enabling equations were obtained for the conditions of the plastic flow of HuberMises, Mor-Kulon, Mises-Schleicher-Botkin.
Conclusions. The obtained equations are the key elements of iteration of elastic solutions and allow one to obtain “initial stresses” that are necessary to implement it.
Keywords: elastic plastic problems for foundations and steel structures, finite element method, method of elastic solutions, initial stresses.
Introduction
In modern construction there is a growing number of projects and studies employing nonlinear calculation methods based on the mathematical foundation of the finite element method. Over the last decades as computing techniques have been on the rise, solutions of nonlinear construction mechanics have been introduced into practice. Modern users of the
MathCad, MathLab software (and the like) are capable of developing their own algorithms and software modulus implementing physically non-linear calculations for studies and particular projects.
These modulus are easy to design by combining the finite element method with the method of elastic solutions using the “initial strain” version [1, 2].
© Shapiro D. М., 2016
59

Scientific Herald of the Voronezh State University of Architecture and Civil Engineering. Construction and Architecture
The advantage of this method is clear physical content and consistency of calculations of initial “elastic” rigidity matrices of finite elements and a system overall. In many cases all of these outweigh a drawback the method has, which is slow iterative convergence.
Description of the mathematical process. At each i-th iteration step of the method of elastic solutions and initial strain is known to take two stages:
1.“A failure region” is identified where loads (strains) obtained at the preivous calculation stage are over the yield point. The finite elements of “a failure region” are combined with the forces transforming them into a physically possible strain;
2.“Discrepancy of forces” is eliminated: the same forces but with the opposite sign are applied at the same nods to the entire design region.
In calculating continuous (flat, spatial) systems “discrepancy of forces” {ΔF} i at the nodes of the finite elements is caused by “discrepancy of strains” {Δσ} i in its continium at the i-th iteration step using a matrix ratio
F i B T i dV , |
(1) |
V |
|
where V, [B]T is the volume of a spatial finite element (or the product of the area S to the thickness t of a flat finite element) and transposed matrix of Cauchy relations.
The resulting vectors { Ui} are accommodated and summed with the initial movements of the elastic solution. The values{ Ui} or {– Fi} close to zero are achieved. The parameters { Ui} or {– Fi} are easy to use as discrepancy measures.
General approach to designing resolving equations. The above calculation procedure (or process) has a physical content reflecting certain plastic deformations and its mathematical description typical of a particular task at hand. For that resolving equations are necessary that express connections between strains of a linear (elastic) and elastic plastic states of the finite element at each of the iteration steps from the first one.
Let us introduce the following denominations:
{ } { x y z xy yz xz 1 2 3},{ x y z xy yz xz 1 2 3} —
are row matrices of strains and relative deforamtions at a point (an elementary fragment of a design region), finite element or the centre of the finite element. The same matrices containing members with the upper index «е» ({σе}, {εе}) denote the results of a linear (“elastic”) solution of a task. The row matrices {σр} contain the components of strains of the elastic plastic state of the finite element meeting the physical conditions of a task.
60