

3202
.pdfIssue № 3 (35), 2017 |
ISSN 2542-0526 |
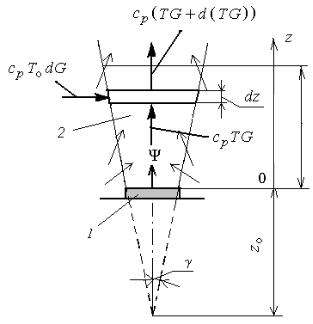
The scheme of thermal and mass exchange for the accepted three-zone mathematical model of fire is presented in Fig. 1. The model considers exhaust as well as forced anti-smoke ventilation, the arrows mark the directions of thermal flows and motion of the gas medium. Let us restrict our study to the processes taking place in the first initial stage of fire [1, 5]. This is a time period when the heated gas mix accumulates in the area of the layer adjacent to the ceiling and its lower boundary continuously goes down and reaches the upper edge of the doorway. In the second phase the lower boundary of the area of the layer adjacent to the ceiling II goes down below the upper edge of the doorway and the heated mix of combustion products and air starts flowing outside the doorway. Up to that moment the air mass is pushed out of the cold air area III.
Woutlet
|
|
Winlet |
|
|
|
|
|
|
|
|
|
Goutlet |
|
||||
|
|
|
|
|
|
|
||
|
|
|
|
|
|
|
|
|
|
|
|
|
|
|
|
|
|
Qwall1 |
|
|
|
|
|
|
Qdoorway |
|
|
|
|
|
|
|
|
|
|
|
|
|
|
|
|
|
|
|
|
|
|
|
Ginlet |
||||
|
|
|
|
|
|
|
|
|
Qbelow
Fig. 1. Scheme of thermal and mass exchange for a three-zone model:
I –– area of the convection column; II –– area of the layer adjacent to the ceiling filled with smoke;III –– area of the cold air; 3 –– open doorway;4 –– combustible material; 5 –– lower boundary of the layer adjacent to the ceiling;6, 7 –
–exhaust and forced anti-smoke ventilation; 8 –– point (fake) combustion source; 9 –– height of open fire.
ψ–– mass velocity of gasification of a combustible material, (kg/seс); Ginlet, Goutlet –– mass consumptions of the inlet outside air and combustion products pushed outside, (kg/seс); Winlet, Woutlet –– volumetric consumption of the anti-smoke exhaust and forced ventilation respectively, (m3/sec); Qdoorway –– heat flow radiated outside through the open doorways, (Watt); Qwall1, Qwall2, Qabove, Qbelow –– total radiation and convection thermal flows
into the walls below and above the lower boundary of the layer adjacent to the ceiling, into the partition (up) and into the floor respectively, (Watt); γ one second of the angle of the opening of the convection column, (rad)
91

Russian Journal of Building Construction and Architecture
While determining the position of the lower boundary of the area of the smokescreen adjacent to the ceiling it is assumed that anti-smoke forced and exhaust ventilation do not operate, in the area of the layer adjacent to the ceiling there are no open doorways. A vertical coordinate of the lower II can be identified using the solution of the differential equation expressing the law of energy conservation in the layer adjacent to the ceiling [5]:
dz |
|
|
1 |
|
|
Qfire (1 ) |
|
|
|||
k |
|
|
|
Gc |
|
|
|
|
, |
(1) |
|
d |
|
Fs |
c |
|
T |
||||||
|
|
p |
|
|
|
||||||
|
|
0 |
|
|
|
|
0 |
|
|
|
|
where is the current time, (с);
Э,
zk is a vertical coordinate of the lower boundary of the layer that is marked from the floor of the premises, (m);
ρ0 is the original density of the outside air, (kg/m3); Fs is the area of the floor surface, (m2);
Gс is the mass consumption of the gas mix from the combustion products and air in the convection column that comes into the layer adjacent to the ceiling, (kg/seс);
Qfire is the thermal power of the centre of combustion, (Watt); ср is the specific isobaric heat capacity of the gas, (J/(kg К)); Т0 is the original temperature in the premises, (К);
φ is the coefficient of heat losses given by the ratio
(Qwall 1 Qwall 2 Qabove Qbelow Qdoorway )/Q fire .
At the initial moment the lower boundary of the area of the layer adjacent to the ceiling coincides with the height h of the entire premises and thus the initial condition for = 0:
zk = h.
In the calculations we assume that the specific isobaric thermal capacities as well as gas constants of the air and gas mix of the combustion products with the air have identical values [5]. In the numerical solution of the equation (1) the Runge-Kutta four-order method can be employed [4].
The value of the average volumetric density of the gas mix in the layer adjacent to the ceiling is determined using the differential equation expressing the law of energy conservation in this layer [5]:
d 2V2 G , |
(2) |
d к
92
Issue № 3 (35), 2017 |
ISSN 2542-0526 |
where ρ2 is the average volumetric density of the gas mix of the layer adjacent to the ceiling, (kg/m3);
V2 is the volume occupied by the layer adjacent to the ceiling, (m3).
After determining the average volumetric capacity, using the equation of the state of the mix of ideal gases [5] the value of the average volumetric temperature in the area adjacent to the ceiling can be identified:
p2 2RT2 , |
p2 p0 , |
(3) |
where р2 is the pressure in the area adjacent to the ceiling, (Pа); R is the gas constant, (J/(kg∙К));
T2 is the average volumetric temperature of the gas mix of the investigated layer, (К); р0 is the atmospheric pressure at the floor level, (Pа).
2. Mass and thermal exchange in the area of the convective column
A scheme of the thermal balance for an elementary volume in the area of the convective column is shown in Fig. 2.
zarea
Fig. 2. Scheme of the mass and heat exchange in an elementary volume of the convective column: 1 –– combustible substance; 2 –– heat release zone;
T –– average temperature of the gas mix in the longitudinal section of the column, (К);
G –– mass consumption of the gas mix passing through the longitudinal section of the convective column at the height z, (kg/sec); zarea –– height of the heat release zone, (m); z0 is the distance from the surface of the combustible substance to the point (fake) combustion source, (m)
93

Russian Journal of Building Construction and Architecture
While designing a ratio for calculating the distribution of the mass consumption of the gas mix from the products of combustion, gasification and air along the height of the convective column in the equations expressing the laws of energy and impulse conservation let us use a “quasi-one-dimensional” approximation for the condition of the even distribution of heat along the entire height of the fire zone.
Extracting an elementary volume with the height dz according to the scheme presented in Figure 2 for the gas mix in the extracted elementary volume, we get the following equation for the law of energy conservation:
TdG GdT dGdT T dG Qпож (1 ) dz , |
(4) |
|
0 |
cp zпл |
|
|
|
|
where is the proportion of the thermal power of the centre of combustion that comes with a heat flow from the convective column area into the enveloping structures.
According to Fig. 2 for the gas mix filled with smoke with the height dz, the equation expressing the law of the impulse conservation in the extracted volume of the convective column is as follows:
d w2 |
|
|
dp |
g , |
|
|
z |
|
|
|
(5) |
||
dz |
|
|
dz |
|||
|
|
|
|
|
||
where z is a vertical coordinate calculated from the combustion surface, (m);is the average density along the longitudinal section of the column (kg/m3);
wz is the vertical component (along the axis z) of the average velocity of the gas medium filled with smoke in the longitudinal section of the column, (m/sec);
p is the pressure in the investigated section of the column, (Pа); g is the acceleration of gravity, (m/seс2).
Unlike the paper [7] the equation (5) considers changes in the consumption along the height of the convective column.
During joint integration from 0 to the current coordinate z of the ratios of (4), (5) we get a differential equation that determines the distribution of the mass consumption along the height of the convective column:
|
dG |
|
A G |
|
2G tg |
|
B |
|
|
|
2z tg |
|
|
||
C |
|
|
|
|
|
|
|
||||||||
|
|
|
|
|
|
|
|
|
|
|
|
|
|
||
dz |
F(z) |
|
F(z)/ 3 |
T0 |
F(z)/ 3 |
||||||||||
|
|
|
|
|
|
|
|
|
|||||||
|
|
|
|
|
|
|
|
|
|
|
|
|
|
|
|
|
|
|
|
|
|
|
p0 G |
|
|
|
F(z), |
|
|
||
|
|
g |
0 |
|
|
|
|
|
|
(6) |
|||||
|
|
R (T G |
B z) |
|
|||||||||||
|
|
|
|
|
|
|
|
|
|
|
|
||||
|
|
|
|
|
|
0 |
|
|
|
|
|
|
|
||
94
Issue № 3 (35), 2017 |
ISSN 2542-0526 |
where p0 is the pressure on the surface of the combustible substance (z = 0) before the outset of fire, (Pа);
F(z) is the area of the longitudinal section of the convective column at the height z, (m2);
A |
T0 R |
m з |
|
; B |
Qfire (1 ) |
|
kg К |
; С |
A (2G z B /T0 ) |
|
m |
||||
|
|||||||||||||||
p0 |
|
|
kg |
|
zarea ср |
|
|
|
F(z) |
|
|
|
|||
|
|
m sec |
|
sec |
|||||||||||
|
|
|
|
|
|
|
|
|
|
|
|
|
|
|
|
|
|
|
|
|
|
|
|
|
|
|
|
|
|
|
|
are formal dimensional values.
The distribution of the average temperature along the section of the cording to [5]:
T T |
Qfire (1 ). |
||
0 |
|
G cp |
|
|
|
||
column is accepted ac-
(7)
In the general case the value of the half of the angle of the opening of the convective column can also depend on the height of the longitudinal section of the column and the thermal power extracted in the centre of combustion:
f z,Qfire . |
(8) |
Therefore the presented equations (6)––(8) allow the shape of the convective column to be considered in calculations of the thermal, gas and dynamic parameters of fire.
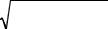
The approximation of the free convective flow can only be used up to a particular height of the longitudinal section of the convective column. This is proved by numerical experiments using a field model on the example of a premises sized 30×24×26.3 m for the thermal power of fire Qfire = 1.3 МWatt described in [6] and presented in Fig. 3.
The graphs suggest that correct use of the approximation of the free convective flow (curves 1 and 2) is possible up to a relative height of the longitudinal section z 0.4 (z z/h, h is the height of the premises). The application in calculating the mass consumption of the gas mix through the convective column of the differential equation (6) (curve 3) yields the results that are in agreement with those obtained using the field model. The latter are more physically justified than the results based on the assumption on the distribution of the column of an unrestricted free convective flow [5, 16, 18, 20, 21, 23].
In the paper [18] the mass consumption of the gas mix in the convective column at the height z is given by the formula:
G |
|
3 |
5 |
|
3 |
. |
(9) |
7.1 |
|
Qfire (1 ) z |
0.0018 Qfire (1 ) |
10 |
|||
|
|
|
|
|
|
|
|
95
Russian Journal of Building Construction and Architecture
275 |
|
|
|
|
|
|
|
250 |
|
– 4 |
– 5 |
|
|
|
|
225 |
|
|
|
|
|
||
200 |
1 |
2 |
3 |
|
|
|
|
175 |
|
|
|
|
|
|
|
150 |
|
|
|
|
|
|
|
125 |
|
|
|
|
|
|
|
100 |
|
|
|
|
|
|
|
75 |
|
|
|
|
|
|
|
50 |
|
|
|
|
|
|
|
25 |
|
|
|
|
|
|
z, m |
0 |
|
|
|
|
|
|
|
|
|
|
|
|
|
|
|
0 |
5 |
|
10 |
15 |
20 |
25 |
30 |
Fig. 3. Mass consumption of the gas mix calculated using the analytical formulas and numerical experiment according to a field model:
Analytical curves:1 ––according to the formula [5]; 2 –– according to the formula [18]; 3 –– according to the equation (2).
Numerical experiment [6]: 4 – in longitudinal sections of the column; 5 – in longitudinal sections of the entire premises
Let us consider the relative consumption
G Gh /Gz* ,
where Gh is the mass consumption at the height of the ceiling of the premises given by the equality (9) at z = h, (kg/sec);
Gz* is the consumption at the height z* starting from which the constant value of the half of the angle of the opening of the convective column accepted in the equation (9) begins to decrease tending for zero, (kg/seс).
For the specified original parameters z = 1.5 m; z* = 1.0 m; Qfire = 1 kWatt the relative consumption is G = 1.97. According to the formula (7) an increase in the temperature is reversely proportional to the mass consumption:
T T |
|
Qfire (1 ) |
. |
|
|||
0 |
|
G cp |
|
|
|
||
Thus the increase in the temperature adjacent to the ceiling of the premises calculated using the equality (7) averaged according to the section of the convective column will be about two times as high as the value obtained using the formulas of the consumption of the gas mix G, e.g., from [1, 5, 18, 19].
96
Issue № 3 (35), 2017 |
ISSN 2542-0526 |
3. Describing and analyzing the experimental studies
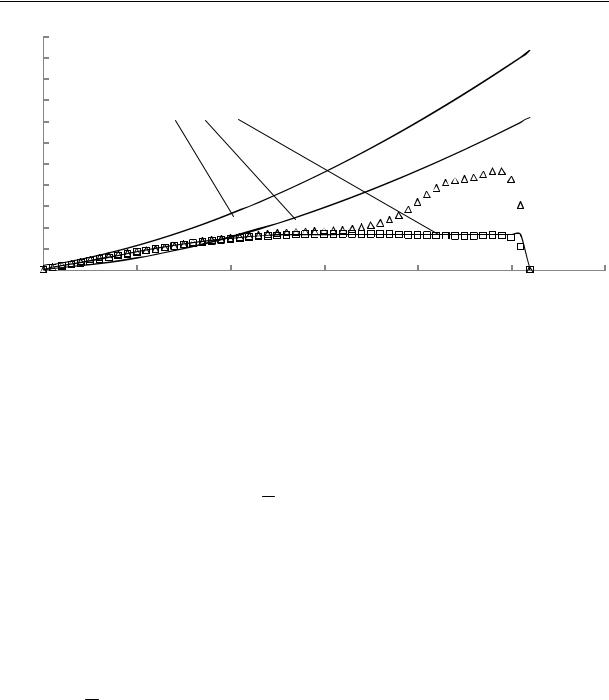
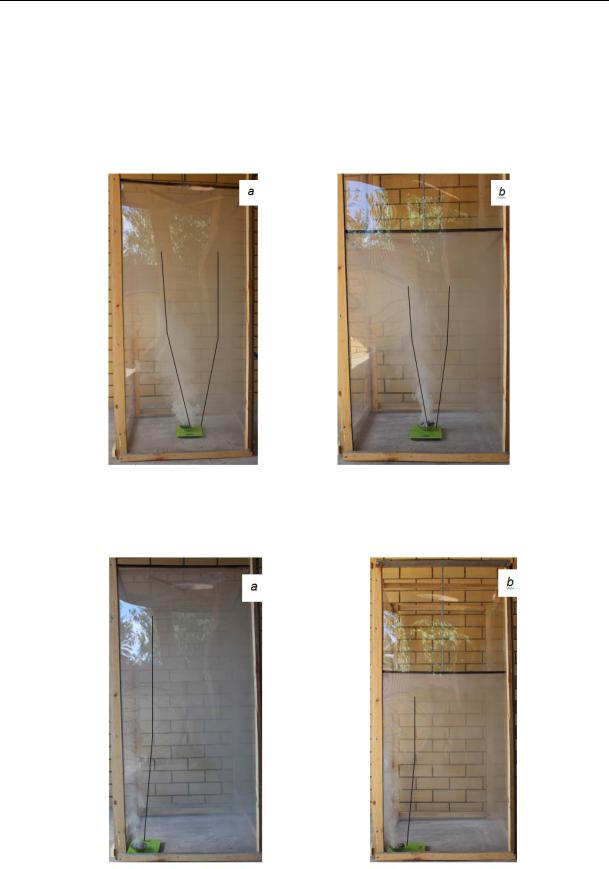
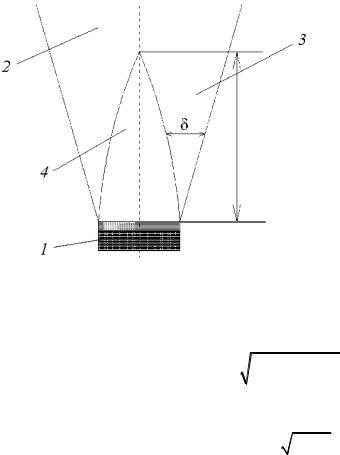
In the studies of the distribution of the smokescreen in the model of the premises for a nonoperating anti-smoke ventilation the process was fixed using stationary photo cameras from the outset of combustion up to when the experimental volume is completely filled with smoke in equal intervals of 2 seconds. The combustible material was phenolformaldehyde resin with a wood flour filler releasing a thick smoke during combustion that makes the distribution of smokescreen visual in a photo. A tray with the combustible substance was placed in the centre of the model of the premises next to the middle of the wall to prevent the distribution of smoke by one surface and in the corner to prevent the distribution of smoke by two surfaces. The height of the partition was 1.0 m and 1.5 m.
During the experimental studies changes in the angle of the convective column along its height, changes during combustion of the mass of the combustible substance as well as time when the smokescreen went down to the floor of the premises. There is a difference in the character of the distribution of the gas mix filled with smoke depending on the location of the centre of combustion. Hence if a tray with the combustible substance is next to the wall or in the corner of the premises (distribution of smoke is blocked by one or two surfaces), the smokescreen on the opposite side to the centre of combustion goes down quicker. This validates the graphic data of numerical experiments obtained using the field model of fire in [6, 11, 16, 19, 21, 23].
In the photos (Fig. 4, 5) showing the distribution of smokescreen in the model of the premises at the initial stage of fire, the conditional boundaries of the convective column are marked with straight lines. Figures 4, 5 suggest that for any option of the location of the combustible substance the convective column about to the middle of the height of the premises is distributed with a constant angle of semi-disclosure and then this angle becomes zero. Thus for determining the mass consumption along the height of the convective column in solving the corresponding differential equation, it is necessary to specify the law of changes in the angle of semi-disclosure such as γ = f(z, Qfire) at z z* and at z > z* assume = 0 where z* is the height from the floor of the premises where the angle of semi-disclosure becomes zero. In [2] it is indicated that for the first approximation at z z* we can assume that = 11 degrees. For a more accurate functional dependence of the angle of semi-disclosure on the height z of the convective column and heat emission power Qfire during fire, it is necessary to verify the solution of the differential equation for determining the mass consumption along the height of the convective column using accurate experimental studies along the height of the convective column. This approach was presented in [9]. In Figure 6 there is a scheme of the fire zone of the convective column accepted in [9]. In this pa-
97
Russian Journal of Building Construction and Architecture
per the angle of semi-disclosure of the convective column was determined based on the comparison of the height of the fire zone obtained during the calculations with the experimental data during diffusion combustion in the tray. The approximation of the results of the numerical experiment is represented by the following dependences: = 0 at Qfire < 1 МWatt; = 2.78 (Qfire 1) at 1.0 МWatt Qfire < 10.0 МWatt with the accuracy of the approximation 0.992.
Fig. 4. Character of smoke distribution inside the model of the premises when the centre of combustion is in the centre of the floor (а – h = 1,5 m; b – h = 1,0 m)
Fig. 5. Character of smoke distribution inside the model of the premises when the centre of combustion is in the corner (а – h = 1,5 m; b – h = 1,0 m)
98
Issue № 3 (35), 2017 |
ISSN 2542-0526 |
Fig. 6. Scheme of the fire zone [9]: xarea 1 –– combustible liquid;
2 –– convective column;
3 –– boundary layer слой;
4 –– fire zone
For determining the height of the fire zone xarea during combustion of liquids the dependences suggested in [15] can be used:
xarea 0.235 5 Q fire 10 3 2 |
2.04 r , |
(2) |
||||
xarea 84 |
|
|
|
0.61 |
|
|
r |
|
|
|
, |
(3) |
|
|
|
|||||
|
|
о |
|
|
|
|
|
|
2g r |
|
|
||
where r (m) is the equivalent radius of the surface of the combustible material; (kg/(sec m2)) is the specific burning rate.
Conclusions
In this paper we set forth an improved zone mathematical model of fire where changes in the shape of the convective column over the centre of combustion along its height are taken into account. It was noted that the accepted shape of the column influences the values of the subsequently calculated mass consumption of combustion products and average volumetric temperature in the area of the layer adjacent to the ceiling. The mass consumption of the gas mix determines the consumption of the ventilator in a mechanical system of smoke removal. An increased consumption leads to “plug-holing” when the cold air comes into the smokeremoving hole significantly reducing (by 2 times as in the example in [10]) the mass consumption of the removed smoke.
The experimental studies showed a considerable difference in the shape of the convective column in the premises from that accepted in traditional calculations of the free convective flow in an unrestricted space [3, 14, 17]. It was found that the angle of semi-disclosure of the column remains fairly constant up to a particular height and then becomes zero giving the con-
99

Russian Journal of Building Construction and Architecture
vective flow a cylindrical shape. The results of the experiments are in agreement with theoretical studies conducted by the authors to investigate the features of the distribution of the gas mix filled with smoke in premises with the centre of combustion using the equations considering the shape of the convective column as well as a three-zone model of fire.
References
1.Astapenko V. M., Koshmarov Yu. A., Molchadskiy I. S., Shevlyakov A. N. Termogazodinamika pozharov v pomeshcheniyakh [Thermogasdynamic fires in buildings]. Moscow, Stroyizdat Publ., 1988. 448 p.
2.Drayzdeyl D. Vvedenie v dinamiku pozharov [Introduction to fire dynamics]. Moscow, Stroyizdat Publ., 1988.
340p.
3.Kar'kin I. N., Kontar'N. A., Grachev V. Yu. SITIS 2-09 (Redaktsiya 5) Metodicheskie rekomendatsii po ispol'zovaniyu programmy CFAST [CITIES 2-09 (Edition 5) guidelines for using the program CFAST], 2009. 64 p.
4.Korn G., Korn T. Spravochnik po matematike dlya nauchnykh rabotnikov i inzhenerov [Handbook on mathematics for researchers and engineers]. Moscow, Nauka Publ., 1968. 720 p.
5.Koshmarov Yu. A. Prognozirovanie opasnykh faktorov pozhara v pomeshchenii [Forecasting of dangerous factors of fire in the premises]. Moscow, Akademiya GPS MVD Rossii Publ., 2000. 118 p.
6.Puzach S. V. Metody rascheta teplomassoobmena pri pozhare v pomeshchenii i ikh primenenie pri reshenii prakticheskikh zadach pozharovzryvobezopasnosti [Methods of calculation of heat and mass transfer during fire indoors and their application in solving practical problems of fire and explosion]. Moscow, Akademiya GPS MVD Rossii Publ., 2005. 336 p.
7.Puzach S. V., Abakumov E. S. Modifitsirovannaya zonnaya model' rascheta termogazodinamiki pozhara v atrium [A modified zonal model for calculating thermogasdynamic fire in the atrium]. Inzhenerno-fizicheskiy zhurnal, 2007, vol. 80, no. 2, pp. 84––89.
8.Puzach S. V., Abakumov E. S. Nekotorye osobennosti termogazodinamicheskoy kartiny pozhara v vysokikh pomeshcheniyakh [Some features of the thermodynamic picture of the fire in high spaces]. Pozharovzryvobezopasnost', 2010, vol. 3, no. 2, pp. 28––33.
9.Puzach S. V., Abakumov E. S. K opredeleniyu vysoty plamennoy zony pri diffuzionnom gorenii zhidkosti [The determination of the height of an ardent zone in the diffusive burning of liquids]. Pozharovzryvobezopasnost', 2012, vol. 21, no. 2, pp. 31––34.
10.Puzach S. V., Do Tkhan' Tung, Nguen Tkhan' Khay. Snizhenie effektivnosti sistemy dymoudaleniya s iskusstvennym pobuzhdeniem pri vozniknovenii «podduva» [The decrease in the efficiency of smoke extraction systems with artificial inducement in the occurrence of "blowing"]. Pozharovzryvobezopasnost', 2015, vol. 24, no. 5, pp. 54––61.
11.Puzach S. V., Do T. T. Vliyanie vysoty stenki dymoudalyayushchego otverstiya na vozniknovenie «podduva» pri dymoudalenii s estestvennym pobuzhdeniem [The influence of the height of the wall diodelaser holes on the emergence of "blowing" when you smoke with a natural impulse]. Pozharovzryvobezopasnost', 2014, vol. 23, no. 11, pp. 46––52.
100