

Банкова НумералсНумберс Анд Фигурес ин Профессионал 2011
.pdf
|
3D SHAPES |
cube (n), |
cylinder (n), |
cubic (adj) |
cylindrical (adj) |
NB!
1.triangle [′traiæŋgl ], triangular [trai′æŋjulə ]
2.rectangle [′rek˛tæŋgl], rectangular [rek΄ tæŋjulə]
3.pentagon [′pentəgən], pentagonal [pən′tægənl]
4.hexagon [΄heksəgən], hexagonal [hek΄sægənl]
5.octagon [΄οktəgən] , octagonal [ok′tægənl]
6.circle [′sə:kl], circular [′sə:kjulə]
7.cylinder [′silində], cylindrical [si′lindrikəl]
II. UNIT PREFIXES
The prefixes below can be written in front of units to multiply them or divide them by a specific number. For example, 1 milliamp (mA) = = 0.001 amp, and 1 kilonewton (kN) = 1,000 newtons.
Prefix |
Abbreviation |
Multiplication actor |
tera |
T |
x 1,000,000,000,000 |
giga |
G |
x 1,000, 000, 000 |
mega |
M |
x 1,000,000 |
kilo |
k |
x 1,000 |
hecto |
h |
x 100 |
deka |
da |
x 10 |
deci |
d |
x 0.1 |
centi |
c |
x 0.01 |
milli |
m |
x 0.001 |
micro |
μ |
x 0.000001 |
nano |
n |
x 0.000000001 |
pico |
p |
x 0.000000000001 |
− 91 −
III. GRAPHS
http://www.google.com/images?client=gmail&rls=gm&q=graphs&u m=1&ie=UTF- 8&source=univ&ei=RaSoTJneMIadOpq52NQM&sa=X&oi=image_res ult_group&ct=title&resnum=1&ved=0CDAQsAQwAA&biw=1077&bi h=563
Example 1.
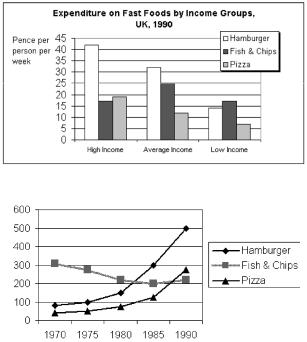
Fast Food Consumption in the UK
Consumption of Fast Food in the UK in Grams per Week, 1970 to 1990
Fast Food UK; Quantity
The graph shows changes in the amount of fast food consumed in the UK between 1970 and 1990. Several trends are apparent. First, Britons are eating more and more fast food. Secondly, the type of fast food has changed.
In 1970, the most popular fast food was fish and chips. Over 300g were consumed each week. By 1990, however, this had fallen to just
− 92 −

over 200g – a 50% drop. Consumption of other fast foods such as pizza and hamburgers increased, however. The amount of pizza eaten shot up from about 20g a week to more than 270g, overtaking fish and chips in the late 1980s. Hamburger consumption also increased, rising from about 80g in 1970 to almost 300g in 1990.
Accompanying this change in the choice of foods was an increase in the amount of fast food consumed. In 1970, British consumers ate about 450g a week of fast food. In 1990, on the other hand, this had more than doubled, to 1000g.
Alternative Answer
The graph shows the amount of fast food eaten between 1970 and 1990 in grams per person per week. Overall, the amount of fast food eaten more than doubled.
The amount of fish and chips eaten declined slightly. In 1970, the consumption was about 300g/week. This fell to 220g/week in 1990.
In contrast, sales of hamburger and pizza rocketed. In 1970, very little pizza was eaten – less than 50g/week. This rose to 280g/week by 1990. In the same period, hamburger sales shot up by more than 500%, from 100g/week in 1970 to 500 grams in 1990.
In conclusion, although there was a big increase in the consumption of pizza and hamburger, sales of fish and chips decreased.
Example 2
London Underground
Underground Station Passenger Numbers
The graph shows the fluctuation in the number of people at a London underground station over the course of a day.
The busiest time of the day is in the morning. There is a sharp increase between 06:00 and 08:00, with 400 people using the station at
− 93 −
8 o’clock. After this the numbers drop quickly to less than 200 at 10 o’clock. Between 11 am and 3 pm the number rises, with a plateau of just under 300 people using the station.
In the afternoon, numbers decline, with less than 100 using the station at 4 pm. There is then a rapid rise to a peak of 380 at 6pm. After 7 pm, numbers fall significantly, with only a slight increase again at 8pm, tailing off after 9 pm.
Overall, the graph shows that the station is most crowded in the early morning and early evening periods.
Example 3
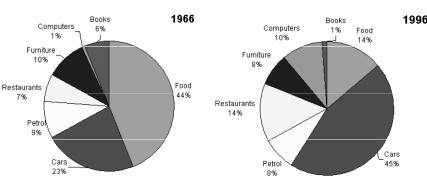
US Spending Patterns, 1966−1996
The piecharts show changes in American spending patterns between 1966 and 1996.
Food and cars made up the two biggest items of expenditure in both years. Together they comprised over half of household spending. Food accounted for 44% of spending in 1966, but this dropped by two thirds to 14% in 1996. However, the outlay on cars doubled, rising from 23% in 1966 to 45% in 1996.
Other areas changed significantly. Spending on eating out doubled, climbing from 7% to 14%. The proportion of salary spent on computers increased dramatically, up from 1% in 1996 to 10% in 1996. However, as computer expenditure rose, the percentage of outlay on books plunged from 6% to 1%.
Some areas remained relatively unchanged. Americans spent approximately the same amount of salary on petrol and furniture in both years.
− 94 −
In conclusion, increased amounts spent on cars, computers, and eating out were made up for by drops in expenditure on food and books.
Exercise 1 http://www.writefix.com/graphs/preps.htm Graphs Prepositions
How well do you know prepositions used in writing about graphs? Fill in the correct answers.
1.Sales peaked _________ 2,000,000 in 1999.
2.Profits rose _________ a low of 4.5 million to a high of 8 million.
3.Sales fluctuated ___________ 5 million and 6 million.
4.Profits fell ________ 10%, from 2000 to 1800.
5.The number of students fell _______ a low of 1800 in 2003.
6.Cases of AIDS shot _____ from 2400 in 1996 to 4000 in 2003.
7.The number of cars sold remained unchanged in 1999, _____ three million.
8.Students do between three _________ four hours homework a
night.
9.The number of accidents _______ 1999 was slightly higher than in
2000.
10.The figure rose steadily _________ the four years between 1997 and 2001.
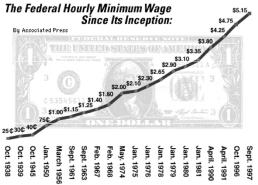
Exercise 2
Study the graph below and answer the questions.
1. What was the minimum wage in January, 1978?
2.When did the minimum wage reach $3.35?
3.Between what time
periods was the largest increase in minimum wage?
4. Based on your observations of the graph, make a prediction about what the wage might be in the year 2000 and 2010.
☺ ENJOY!
− 95 −
An assemblage of the most gifted minds in the world were all posed the following question:
“What is 2 x 2?”
The engineer whips out his slide rule and shuffles it back and forth, and finally announces, “3.99”.
The physicist consults his technical references, sets up the problem on his computer, and announces, “It lies between 3.98 and 4.02”.
The mathematician cogitates for a while, oblivious to the rest of the world, then announces, “I don’t know what the answer is, but I can tell you, an answer exists!”
Philosopher, “But what do you mean by 2 x 2?”
Logician, “Please define 2 x 2 more precisely”.
Accountant closes all the doors and windows, looks around carefully, then asks, “What do you want the answer to be?”
Elementary school teacher, “Four!”
Список использованной литературы:
1.Качалова К.Н., Израилевич Е.Е. – Спб: Базис Каро, 2003
2.Ibbotson M. Professional English in Use – Cambridge University Press,
2009
3.Словарь-справочник по нормативному речеупотреблению Cobuild English Usage/ под ред. проф. Т.Б. Назаровой – М.: Астрель, 2003
4.Sharma P. Reading the news – Thomson, 2007
5.http://www.youtube.com/watch?v=edXQ39BdpCk
6.http://www.edufind.com/english/grammar/numbers.php
7.http://www.english-zone.com/grammar/numbers2.html
8.http://www.primaryresources.co.uk/maths/mathsB6.htm
9. http://www.cimt.plymouth.ac.uk/projects/mepres/book8/bk8i17/bk8_17i4.htm
− 96 −