

Учебное пособие 2203
.pdfIssue № 2 (38), 2018 |
ISSN 2542-0526 |
The distribution of the relative deformations ε along the height of a section (εb in concrete of the compressed part of a section, εs, εsc in the stretched and compressed reinforcement) is accepted as linear depending on εТ1 and εТ2 according to the scheme and denotations in Fig. 2:
Т1 |
(z z1)( Т1 Т 2 ) |
. |
(3) |
|
|||
|
z2 z1 |
|
|
The compressive strains in concrete σb, in the stretched and compressed reinforcement σs, σsc are determined depending on the relative deformations in accordance with the diagrams in Fig. 1. The resultant strains in concrete of the compressed part of the section Fb, compressed and stretched reinforcement Fs, Fsc are given by the formulas:
|
z d |
|
|
|
|
Fb |
|
b dA, |
Fs s Аs , |
Fsc sс А´s , |
(4) |
z d x
where А, dA is the area of the operating (compressed) part of a concrete section and its elementary strip segment sized bz×dz; Аs, А´s are the areas of a section of a stretched and compressed reinforcement; х is the height of a compressed area of a section.
a) |
|
b) |
|
|
|
Fig. 2. Scheme, a system of denotations, coordinates and sizes of a ferroconcrete section (а), distribution of relative deformations 1 and strains 2 for flat eccentric compression (b)
The efforts N and МY for each pair of variables εТ1, εТ2 are determined as the resultant forces Fb, Fs,Fsc (with the corresponding signs) and their moments in relation to the section axis:
|
|
N Fb Fs |
Fsc , |
(5) |
|
z d |
b zdA Fs h0 |
– d Fsc d – as' , |
|
MY |
|
(6) |
z d x
where z is the coordinate of a strip segment dA; d, h0 are geometric sizes in Fig. 2: the distances from the upper (compressed) face of the section to the center of gravity of the compressed reinforcement.
61

Russian Journal of Building Construction and Architecture
The specified geometric characteristics of the operating part of the section are the area Ared, statistical moment SYred in relation to the axis OY, inertia moment IYred are determined using the following formulas:
|
|
|
|
|
Ared |
|
z d |
|
|
|
|
|
|
|
nAs , |
|
|
|
(7) |
||||||||
|
|
|
|
|
|
|
|
E |
dA nAs E |
|
|
|
|
|
|||||||||||||
|
|
|
|
|
|
|
|
|
|
|
|
b |
' |
|
|
|
s |
|
|
|
|
|
|
|
|
|
|
|
|
|
|
|
|
|
|
z d x |
b b |
|
|
s |
|
|
s |
|
|
|
|
|
|
|
|
||||
|
|
|
z |
d |
|
|
|
zdA nAs' d as' |
|
|
|
|
|
|
|
d h0 nAs , |
|
|
|
||||||||
|
SYred |
|
|
b |
|
|
s |
|
|
|
|
(8) |
|||||||||||||||
|
|
E |
|
|
E |
|
|
|
|
||||||||||||||||||
|
|
|
z d x |
b |
|
b |
|
|
|
|
|
|
s |
|
s |
|
|
|
|
|
|
|
|
||||
|
z d |
|
|
|
|
|
|
2 |
|
|
|
d as' t |
2 |
|
|
|
|
|
|
2 |
|
|
|||||
IYred |
|
|
b |
|
z t |
|
|
dA nAs' |
|
|
|
|
|
|
s |
d h0 |
t |
|
nAs , |
(9) |
|||||||
|
E |
|
|
|
|
|
s |
E |
|
||||||||||||||||||
|
z d x |
b |
b |
|
|
|
|
|
|
|
|
|
|
|
|
|
|
|
|
s |
|
|
|
|
|||
where п = Es /Eb is a ratio of the elasticity moduli of the reinforcement and concrete;
t |
SYred |
. |
(10) |
Ared
The specified inertia moment of the operating part of the section in relation to the geometric center of gravity of the complete section is as follows:
I |
I |
A t2. |
(11) |
Yred,1 1 |
Yred |
red |
|
As the calculation is over, the obtained solutions are sorted through depending on the leading deformations. Then diagrams are designed of the dependencies N − MY as well as the surfaces of the corresponding geometric characteristics of the section. The results are classed into five groups depending on the leading deformations:
1:leading deformations are in the range of εТ1,2 [0; εb1] between each σ = εE;
2:εТ1,2 [εs0; εb1], relative deformations in the stretched reinforcement are within the elas-
tic state, cracks in the stretched part of the ferroconcrete section;
3:εТ1,2 [εs0; εb0], plastic deformations in the compressed zone of the ferroconcrete section;
4:εТ1,2 [εs0; εb2], plastic flow in the compressed zone of the ferroconcrete section, relative deformations in the stretched reinforcement are within the elastic state;
5: relative deformations ε |
are within the bearing capacity of the section ε |
Т1,2 |
[ε |
|
; ε |
|
], |
a non-linear operation of theТ1,2ferroconcrete section, cracks. |
|
s2 |
|
b2 |
|
||
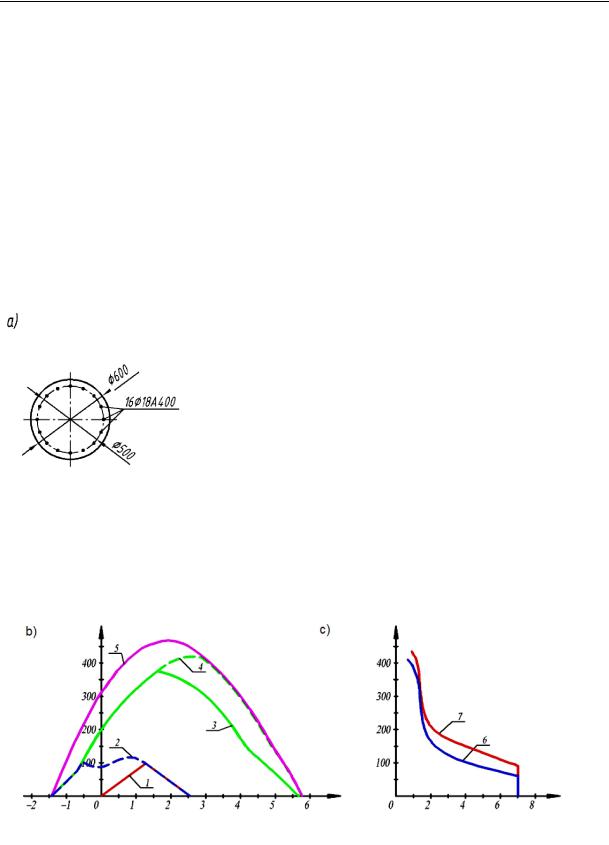
The diagrams depicting the boundaries of the specified groups of the calculation results are shown in Fig. 3 and 4 using an example of a section with the diameter 60 cm with a reinforcement 16Ø18А400.
The use of a deformation model allows a calculation of opening of the cracks of ferroconcrete structures with regular reinforcement to be corrected using the formulas p. 8.2.15 Road Safety Code (СП) 63.13330.2012 and p. 7.105 Road Safety Code (СП) 35.13330.2011.
62
Issue № 2 (38), 2018 ISSN 2542-0526
The ratio σs /Es, expressing a relative deformation of the stretched reinforcement in these formulas should be replaced by εs using the above expression (3).
2.1. Example. Fig. 3а shows a longitudinal section of a ferroconcrete pile with the diameter
d = 60 сm with the |
reinforcement 16Ø18А400 |
(the total area |
of the reinforcement |
Atot = 40.6 сm2). The |
calculation characteristics of |
concrete (class |
В30): Eb = 32500 МPа, |
Rb = 15.5 МPа, reinforcement: Es = 200000 МPа, Rs = 350 МPа. |
|
||
Fig. 3b shows the diagrams of the ratios of the moments МY and longitudinal forces N depend-
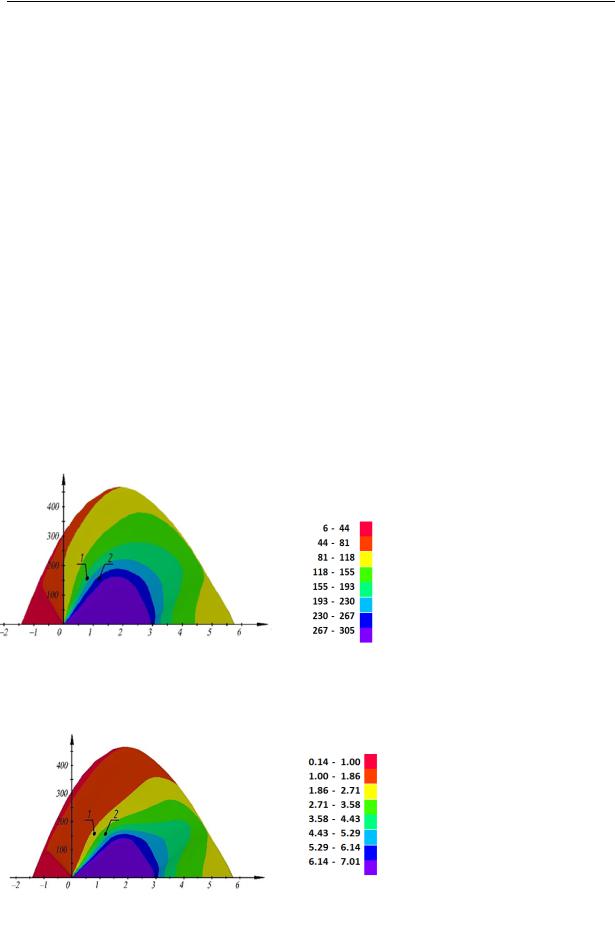
ing on the leading deformations. Fig. 4 presents |
the range of the values Ared = f1(MY, N), |
||||
IYred = f2(MY, N). |
|
|
|
|
|
|
|
Fig. 3. Longitudinal section of the ferroconcrete pile |
|||
a) |
|
||||
|
(а); |
|
|
||
|
|
|
|
||
|
|
|
|
||
|
|
Boundary diagrams of the dependencies N−MY (b): |
|||
|
|
1 |
— εT1,2 |
|
[0; εb1]; |
|
|
2 |
— εT1,2 |
[εs0; εb1]; |
|
|
|
3 |
— εT1,2 |
|
[εs0; εb0]; |
|
|
4 |
— εT1,2 |
|
[εs0; εb2]; |
|
|
5 |
— εT1,2 |
|
[εs2; εb2]; |
diagrams of the dependencies IYred – MY (c) at 6 — N = 800 kN;
7 — N = 1200 kN
MY, |
|
MY, |
(kN m) |
|
(kN m) |
N, (103kN) |
|
IYred, (10–3 m4) |
|
|
|
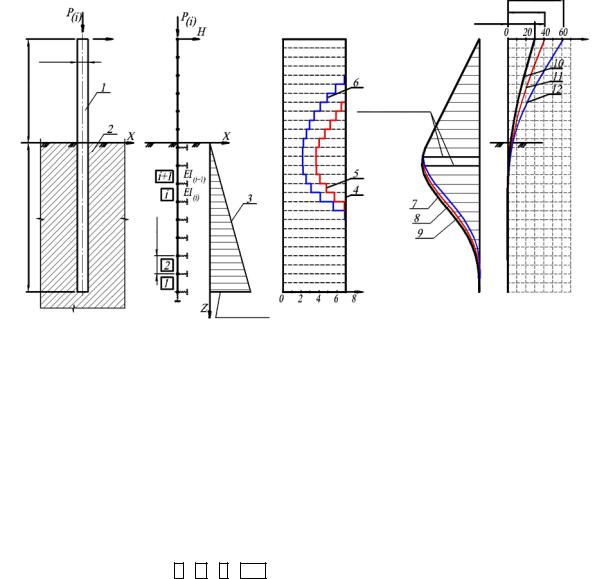
Fig. 5а shows a calculation scheme of the ferroconcrete pile fixed on a part of the length into a semi-solid loam foundation. A horizontal force Н = 25 kN is applied to the upper end
63
Russian Journal of Building Construction and Architecture
of the pile and the vertical load was applied in two versions: Р = 800 kN and Р = 1200 kN. The description of force interaction of the pile of the foundation was accepted in accordance with Appendix C of Road Safety Code (СП) 24.13330.2011 using a calculation model of the method of local elastic deformations with the coefficient of a bed distributed using the equation Cz = Kz/γcz where K = 16500 kN/m4 is the coefficient of proportionality according to C.1; γcz = 3 is the coefficient of the operating conditions; Z is a vertical coordinate that starts from the surface of the foundation.
The resistance of the soil to horizontal movements of the pile by replacing a triangular diagram of the coefficient of the bed with discrete springs [12] with the step t = 0.5 m. The rigidity of the springs Вz = Czbzt where bz = 1.5d + 0.5 m = 1.4 m is the width of a conditional flat wall replacing the pile considering spatial conditions of the solved contact task.
A regular calculation of the pile with a constant (initial) inertia moment of the section IYred = 0.00701 m4 (the diagram 4 in Fig. 5а) depending on a horizontal load was performed again as in this case the vertical force has no effect on the distribution of efforts and horizontal movements.
MY, |
|
a) |
(kN·m) |
|
|
|
|
|
Ared (10–3 m2)
N, (103kN)
b)
MY, |
|
(kN·m) |
IYred (10–3 m4) |
Fig. 4. Areas of the sizes of geometric characteristics of the ferroconcrete section
Ared = f1(MY, N) (а); IYred = f2(MY, N) (b):
1— Ared = 0.179 m2, IYred = 2.16·10−3 m4 at N = 800 kN, MY = 155.4 kN·m;
2— Ared = 0.241 m2, IYred = 3.67·10−3 m4 at N = 1200 kN, MY = 156.9 kN·m
N, (103kN)
64
Issue № 2 (38), 2018 |
|
|
|
|
|
|
|
|
ISSN 2542-0526 |
|
|||||||||
|
|
|
|
|
|
|
|
|
|
|
|
|
|
|
|
62 mm |
|||
|
a) |
|
|
|
|
b) |
|
c) |
|
|
|
|
|
|
|
|
|||
|
|
|
|
|
|
|
|
|
|
|
41 mm |
||||||||
|
|
|
|
|
|
|
|
|
|
|
|
|
|
|
|
|
|||
|
|
|
|
|
|
|
|
|
|
|
|
|
|
30 mm |
|||||
|
|
|
|
|
|
N = 25 kN |
|
|
|
|
|
|
|
|
|
|
|
|
|
|
|
|
|
|
|
|
|
|
|
|
|
|
|
|
|
||||
|
|
|
|
|
|
|
|
|
|
|
|
|
|
|
|
||||
|
|
|
|
|
|
|
|
|
|
|
|
|
|
|
|
∆, (mm) |
|||
|
|
|
d = 0.6 m |
|
|
|
|
|
|
|
|
|
|||||||
|
|
|
|
|
|
|
|
|
|
|
|
|
|
|
|
|
|
|
|
|
|
|
|
|
|
|
|
||||||||||||
|
5. 75 m |
|
|
|
|
|
|
|
|||||||||||
|
|
|
|
|
|
|
|
|
|
|
MYmax = 158.9 kN·m |
||||||||
|
|
|
|
|
|
|
|
|
|
|
|
MYmax = 156.9 kN·m |
|||||||
|
|
|
|
|
|
|
|
|
|
|
|
||||||||
|
|
|
|
|
|
|
|
|
|
|
|
MYmax = 155.4 kN·m |
|||||||
8. 25 m |
|
|
|
0.5 m |
|||
|
|||
|
|
t = |
IYred, (10–3 m4)
45375 kN/m2
Fig. 5. Scheme and results of a deformation calculation of the ferroconcrete pile:
а) a section of the pile and foundation; b) a calculation scheme of the ferroconcrete pile; c) calculation results; 1 is the ferroconcrete pile; 2 is the foundation from semi-solid loam; 3 is the distribution of the coefficient of the bed Сz = Kz/γcz,;
4, 5, 6 are diagrams of the distribution of the bending rigidity ЕbIYred of sections of the ferroconcrete pile for three calculation variants;
7, 8, 9 are diagrams МY of bending moments;
10, 11, 12 are diagrams of horizontal movements for three calculation variants: ЕbIYred = const (a regular calculation of the pile), ЕbIYred, МY, at N = 800 kN, N = 1200 kN;
1 , 2 , i , i 1 are number of finite elements
The results of the calculation (the diagrams of the moments 7 and horizontal movements 10) are shown in Fig. 5c. It also presents the results of a deformation calculation for two values of Р = 800 and 1200 kN: distribution IYred (5, 6), moments (8, 9) and horizontal movements (11, 12).
As the part of the pile fixed into the foundation is statistically undetermined, it was necessary to conduct the deformation calculations according to a non-linear procedure considering two types of physical non-linearity:
––deformation of the sections of the pile according to the diagrams in Fig. 1 and the equations (1), (2) states of the concrete and reinforcement;
––repeated distribution of efforts in the conditional springs modeling the resistance of the soil to horizontal movements of the pile.
65

Russian Journal of Building Construction and Architecture
The calculation results using a more rigid deformation model in accordance with the Road Safety Code (СП) 63.13330.2012 indicate that an insignificant change in the distribution of bending moments and a considerable increase in horizontal movements of the pile compared to a regular calculation at a constant (initial) bending rigidity of the sections of the pile.
The calculation of opening of cracks in the section of the pile with the largest bending moment М = 155,4 kNm at N = Р = 800 kN was performed using the formulas p. 8.2.15 of Road Safety Code (СП) 63.13330.2012 with replacing the ratio σs /Es in the formula 8.128 by εs = εT1–(as / h)(εT1–εT2). εT1 = 0.00037, εT2 = –0.00031, εs = 0.00031, acr = 0.0023 cm were obtained.
3. Slanting eccentric compression (general case). A slanting eccentric compression is defined as that with eccentricity in relation to both major inertia axis OY and OZ (Fig. 6).
Fig. 6. Calculation scheme of a normal section of the ferroconcrete element for a slanting eccentric compression
The ferroconcrete section placed into the coordinate system YOZ is split into elementary areas dy×dz. The independent variables are the leading deformations εТ1, εТ2, εТ3 of three points 1, 2, 3 with the coordinates y1, z1; y2, z2; y3, z3 (Fig. 6). The values of εТ1, εТ2, εТ3 are sorted through at a specified step dε in the range from εb2 to εs2.
At each step of sorting through at three points, planes of relative deformations of points of the section are designed. At the centers of elementary areas the relative deformations ε are fixed and determined as unknown values in the equation reduced to a matrix form:
66

Issue № 2 (38), 2018 |
ISSN 2542-0526 |
Т1Т2 Т1Т3 Т1
yk y1 y2 y1 y3 y1
zk z1 |
|
|
|
|
|
||
z2 |
z1 |
0 . |
(12) |
z3 |
z1 |
|
|
For each of the variety of planes of the relative deformations ε = f (y, z) using the diagrams in Fig. 1 and the ratios (1), (2) a surface of the strains σb, σs, σsc is designed. Following sorting out the obtained data the diagrams of the dependences N−MY−MZ are designed.
Depending on the leading deformations, fields of the combinations of N−MY−MZ are described. For each combination the position of the neutral axis can be identified and the diagrams and fields of the strains are designed for the compressed part of the section stretched and compressed reinforcement.
3.1. Example. Fig. 7—10 show a rectangular section sized 40×60 сm of a ferroconcrete support (class В30 concrete), reinforcement scheme, diagrams of the dependencies N − MY (MZ = 0), MY − MZ (at N = 1000 kN), areas of the geometric characteristics Ared, IYred, IZred using the results of the calculation in a general case of eccentric compression.
a)
c)
MY, (kN·m)
b) MY,
(kN·m)
(103 kN)
Fig. 7. Longitudinal section of the ferroconcrete support (а)
and diagrams of limit ratios
N−MY (MZ = 0) (b), MY –MZ at N = 1000 kN (c):
(kN·m) 1 — εT1,2 [0; εb1]; 2 — εT1,2 [εs0; εb1]; 3 — εT1,2 [εs0; εb0];
4 — εT1,2 [εs0; εb2]; 5 — εT1,2 [εs2; εb2]
67

Russian Journal of Building Construction and Architecture
a) MY, |
|
|
|
b) MY, |
(kN m) |
|
|
|
(kN m) |
|
|
|
|
|
|
|
|
|
|
|
|
Ared (10–3m2) |
||
(103kN) |
|
(103kN) |
IYred (10–3m–4)
Fig. 8. Areas of the sizes of the geometric characteristics of the ferroconcrete section at MZ = 0:
а) Ared = f1(MY, N); b) IYred = f2(MY, N)
a) |
MY, |
|
|
b) |
MY, |
|
(kN m) |
|
|
|
(kN m) |
|
|
|
|
|
|
|
|
|
|
|
|
|
|
|
IYred (10–3m4) |
|
(kN m) |
|
(kN m) |
|
|
|
IZred (10–3m4)
Fig. 9. Areas of the sizes of the geometric characteristics of the ferroconcrete section at N = 1000 kN:
а) IYred = f2(My, Mz, N); b) IZred = f3(My, Mz, N); 1 — N = 1000 kN, My = Mz = 125 kN m
68
Issue № 2 (38), 2018 |
ISSN 2542-0526 |
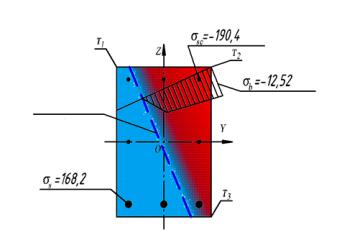
Neutral line
MPa
MPa |
|
|
Fig. 10. Diagram of strains and position of a |
|
|
|
neutral line in the ferroconcrete section |
|
|
|
|
|
|
MPa |
at N = 1000 kN; |
|
|
|
|
|
|
|
MY = MZ = 125 kN m; |
|
|
|
εT1 = 0,000175; εT2 = –0,0012; |
|
|
|
εT3 = –0,000286; acr = 0,011 cm |
4. The software for a deformation calculation of the ferroconcrete piles and supports was developed using the version of a flat eccentric compression which is presented below and the version of a slanting eccentric compression. Its description is beyond the scope of the paper. The calculation includes two sequentially operating software.
In the first software the initial data of the deformation calculation are read and processed, fields of the above characteristics of the sections of the ferroconcrete element Ared = f1(MY, N), IYred = f2(MY, N) are designed according to the formulas (7), (9) and the resulting dependencies are obtained.
In the second software a flat deformation calculation of eccentric compressed rods is performed by means of the finite element method. The initial data necessary for solving finite element method tasks contain the following information:
––numbers of finite elements (FE) with numbers of nods at the beginning and end of the FE;
––initial rigidity characteristics of the FE;
––numbers and coordinates of the nods;
––boundary conditions for a calculation scheme;
––loads on the nods and elements;
––diagrams of the dependencies N − MY of the range of the corresponding specified geometric characteristics of the section Ared, IYred.
The calculation scheme is a flat finite-element system consisting of rod finite elements modeling the piles or supports and (for the piles) discrete “rod springs” modeling a force bearing reaction of soil to the horizontal movements of the pile.
The deformation calculation of statistically undetermined systems is performed using the method of sequential approximations using variable parameters of elasticity of the FE [3]. In the first approximation a regular linear-elastic task is addressed, a vector of nod movements of a
69

Russian Journal of Building Construction and Architecture
structure in a general coordinate system {Z0} and a vector of the internal nod forces of the FE in a general coordinate system are identified {Sr}. Using maximum efforts in the finite elements N, MY the specified rigidity characteristics of the elements Ared, i, IYred, I are calculated where i is a number of FE and then the “specified” rigidity matrices of the FE are calculated in a general coordinate system [Kri, j] where j is a serial number of an iteration step. It is repeated till the specified accuracy of the approximation is reached according to the expression
j j 1 |
|
0.01, |
(13) |
|
j |
||||
|
|
|
where j is a maximum nod movements in the structure in the j-th approximation. The block scheme of the deformation calculation is presented in Fig. 11.
|
Software № 1 |
|
Software № 2 |
Input of the initial |
|
|
|
|
|
|
|
data |
|
|
|
Calculation of the rod system of a general coordinate system
Determining a vector of internal nod movements of a structure {Z0}
Calculation of the vector of internal nod forces of a structure in a general coordinate system {Sr}
Calculation of the specified rigidity matrices of the FE [Krij]
Calculation of the specified rigidity characteristics of the FE Ared, i, IYred ,i
No
Yes
Output of the calculation results
Fig. 11. Block scheme of the algorithm of the deformation calculation of eccentrically compressed rods
Conclusions
1.An engineering method (algorithm and software) of a non-linear deformation calculation using the model accepted in the guidelines in the Road Safety Code (СП) 63.13330.2012, flat and slanting eccentric compressed ferroconcrete structures with regular reinforcement (supports, piles). The algorithm of the calculation contains no simplifications reducing theoretical rigidity accepted in the calculation model: the hypothesis of flat sections, threeand two-linear diagram of the state of concrete and reinforcement in accordance with Fig. 1 and ratios (1), (2).
2.The calculation foundation of the calculation method was designed using the solution of the reverse task where strains are determined using the specified (leading) deformations of two
70