

Учебное пособие 2203
.pdfIssue № 2 (38), 2018 |
ISSN 2542-0526 |
A flow of emergency demands of the i-th equipment group: |
|
Пзi imi1 t , |
(2) |
where i is a parameter of a failure flows of the i-th equipment group, year −1; mi1 t is mathe-
matical expectation of a number of equipment elements that operates well at a time moment t. A restoration flow of the i-th equipment group is as follows:
Пвi i Ni mi1 t , |
(3) |
where Ni is a number of the i-th element group of gas equipment, units; µi is a parameter of a restoration flow of the i-th group of gas equipment, year−1.
A restoration flow of the i-th group of equipment by one team is as follows:
Пв,исп,i |
i Ni mi1 |
t , |
(4) |
|
l |
|
|
where l is a total number of teams. An average workload index per one team is as follows:
|
. |
(5) |
|
l |
|
An average number of teams dealing with emergency demands is as follows:
|
|
|
|
|
|
|
|
|
|
|
n |
|
|
|
|
|
|
|
|
|
|
|
|
|
|
|
|
|
|
Пзi |
|
. |
|
|
|
(6) |
|||||
|
|
|
|
L |
|
|
|
i 1 |
|
|
|
|
|
|
||||||
|
|
|
|
|
|
|
n |
|
|
|
|
|
|
|||||||
|
|
|
|
|
|
|
|
|
Пв,исп,i |
|
|
|
|
|
||||||
|
|
|
|
|
|
|
|
|
i 1 |
|
|
|
|
|
|
|
|
|
||
The likelihood of all the teams being free: |
|
|
|
|
|
|
|
|
|
|
|
|
|
|
|
|
|
|
||
|
|
|
|
l |
|
l |
k |
k l |
l |
|
l 1 |
1 |
|
|
||||||
|
|
p0 |
|
|
|
|
|
|
. |
(7) |
||||||||||
|
|
k ! |
|
|
|
|
||||||||||||||
|
|
k 0 |
|
|
l!1 |
|
|
|||||||||||||
An average number of emergency demands waiting to be handled: |
|
|||||||||||||||||||
|
|
|
|
|
|
|
|
|
|
|
|
ll |
|
l 1 |
|
p . |
(8) |
|||
N |
|
|
|
|
l |
|
|
|||||||||||||
|
|
|
|
l! |
|
|
|
|
|
|||||||||||
|
|
Waiting lines |
|
|
|
|
|
|
1 2 |
0 |
|
|||||||||
An average time of waiting for emergency demands is as follows:
|
|
|
|
ll |
|
l 1 |
|
|
p |
|
. |
(9) |
T |
|
|
|
|
0 |
|||||||
|
n |
|
|
|
2 |
|||||||
|
Line |
|
|
|
|
|
|
|
||||
|
|
|
|
Пзil! 1 |
|
|
|
|
|
|
||
i 1
An average time of emergency demands waiting to be handled and serviced is as follows:
|
|
|
|
l |
|
ll |
|
l 1 |
|
|
p . |
(10) |
T |
|
|
|
|||||||||
|
n |
n |
|
|
|
|
||||||
|
Waiting lines |
|
|
|
|
|
2 0 |
|
||||
|
|
|
|
Пзi |
|
Пзil! 1 |
|
|
|
|
||
|
|
|
|
i 1 |
|
i 1 |
|
|
|
|
|
|
21

Russian Journal of Building Construction and Architecture
Fig. 1 shows a block scheme of the algorithm of determining a viable structure and parameters of the operation of emergency services.
A required safety level Ki and its minimum acceptable value Kimin as well as
a maximum acceptable number of waiting lines N max |
|
|
, |
|||||||||||||
|
|
|
|
|
|
|
|
|
|
|
|
Waiting lines |
|
|||
as well as maximum acceptable number of waiting lines |
T max |
|
are specified |
|||||||||||||
|
|
|
|
|
|
|
|
|
|
|
Waiting lines |
|
|
|||
|
|
|
|
|
|
|
|
|
|
|
|
|
|
|
|
|
A parameter of failure flows λi is identified |
|
|
|
|||||||||||||
|
|
|
|
|
|
|
|
|
|
|||||||
|
|
|
|
|
|
|
|
|
|
|||||||
A minimum required parameter of a restoration flow |
i |
|
i |
Ki |
|
is determined |
||||||||||
|
|
|
|
|
|
|
|
|
|
|
1 Ki |
|
|
|||
|
|
|
|
|
|
|
|
|
|
|
|
|
||||
|
|
|
|
|
|
|
|
|
|
|
|
|
||||
|
Change in Ki is identified: |
|
|
|
|
|
|
|
|
|||||||
Ki t |
|
|
i |
|
e i i t t0 |
|
|
|
|
|
i |
|
|
|
|
|
|
|
|
Ki0 |
|
|
|
|
|
|
|
||||||
|
i i |
|
i i |
|
|
|
||||||||||
|
|
|
|
|
|
|
|
|
|
|||||||
|
|
|
|
|
|
|
|
|
|
|
|
|
|
|
|
|
|
|
|
|
|
Ki >Kimin |
|
|
|
|
|
|
|
|
|
|
|
|
|
|
|
|
|
|
|
|
|
Yes |
|
|
|
|||
An intial number of emergency teams l is specified |
|
|
|
|||||||||||||
|
|
|
|
|
|
|
|
|
|
|
|
|
||||
A flow of emergency demands Пзi |
i mi1 t ; |
|
|
|
|
|
|
|
|
|
|
|
||||
a restoration flow by one team Пв,исп,i |
|
i Ni mi1 |
t ; |
|||||||||||||
an average workload index |
|
|
|
|
l |
|
|
|
|
|
|
|||||
|
are identified. |
|
|
|
||||||||||||
l |
|
|
|
|||||||||||||
|
|
|
|
|
|
|
|
|
|
|
|
|
|
|
|
|
|
|
|
|
|
|
|
|
|
|
|
|
|
|
|
|
|
1
|
|
|
|
|
|
|
|
|
|
|
|
|
|
|
|
|
|
|
|
Yes |
|
|
|
|
|
|
||
|
|
|
|
|
Parameters of mass service are determined: |
|
|
|
|
|
||||||||||||||||||
|
|
|
|
ll |
|
l 1 |
|
|
|
|
p0; |
|
|
|
|
|
|
|
|
l |
|
|
ll |
|
l 1 |
|
|
|
TLine |
|
|
|
|
|
|
|
|
|
|
|
|
|
|
p ; |
|||||||||||||
|
|
|
|
|
|
T |
|
|
|
|
|
|
|
|
|
|||||||||||||
n |
|
|
|
|
|
2 |
|
|
|
|
|
|
|
|||||||||||||||
|
|
|
Пзil! 1 |
|
|
|
|
Waiting lines |
|
|
Пзi |
|
Пзil! 1 |
|
2 |
0 |
||||||||||||
|
|
|
|
|
|
|
|
|
|
|
|
|
|
n |
|
|
|
n |
|
|
|
|||||||
|
|
|
i 1 |
|
|
|
|
|
|
|
|
|
|
|
|
|
|
|
i 1 |
|
|
|
i 1 |
|
|
|
|
|
|
|
|
|
|
|
|
|
|
|
|
|
|
|
|
|
ll |
|
l 1 |
|
|
|
|
|
|
|
|
||
|
|
|
|
|
|
|
N |
|
|
l |
p |
|
|
|
|
|
|
|||||||||||
|
|
|
|
|
|
|
|
|
|
Waiting lines |
|
|
|
|
l! 1 |
2 |
|
0 |
|
|
|
|
|
|
||||
|
|
|
|
|
|
N |
|
|
|
|
|
Nmax |
|
|
|
AND |
|
|
|
|
|
|
||||||
|
|
|
|
|
|
Waiting lines |
|
|
|
Waiting lines |
|
|
|
|
|
|
|
|
|
|||||||||
|
|
|
|
|
|
|
|
|
|
T |
|
|
|
T max |
|
|
|
|
|
|
|
|
|
|
||||
|
|
|
|
|
|
|
|
|
|
|
Waiting lines |
|
Waiting lines |
|
|
|
|
|
|
|
||||||||
An increase in the required parameter of a restoration flow µi
No
An increase in a number of emergency teams l
No
No
Yes
Parameters of a mass service system in handling emergency demands and a parameter of a restoration flow
Fig. 1. Block scheme of the algorithm of determining an optimal structure and parameters of the operation of emergency services
22
Issue № 2 (38), 2018 |
ISSN 2542-0526 |
Generation of emergency demands
Line
of emergency demands
Servicing emergency demands
Calculation of the parameters of the model
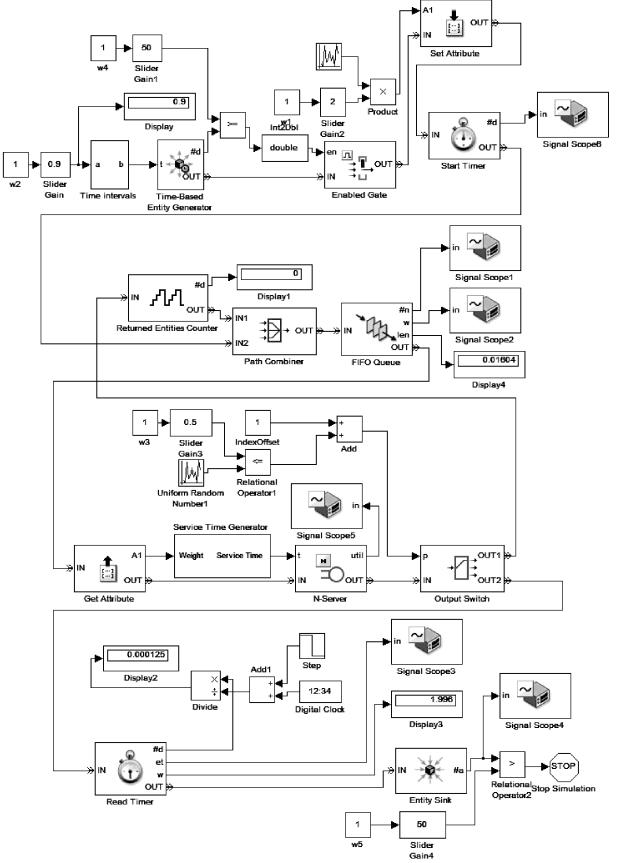
Fig. 2. Modulus of imitation modeling that implements an algorithm of determining an optimal structure and parameters of the operation of emergency services in the MatLab — Simulink software
23
Russian Journal of Building Construction and Architecture
The parameters of mass service systems handling emergency demands are identified based on
the condition of a safety criterion not going under a threshold: |
|
Ki Kimin , |
(11) |
and not going over thresholds of waiting lines and service time: |
|
N |
Nmax |
ANDT |
T max |
. |
(12) |
Waiting lines |
Waiting lines |
Waiting lines |
Waiting lines |
|
|
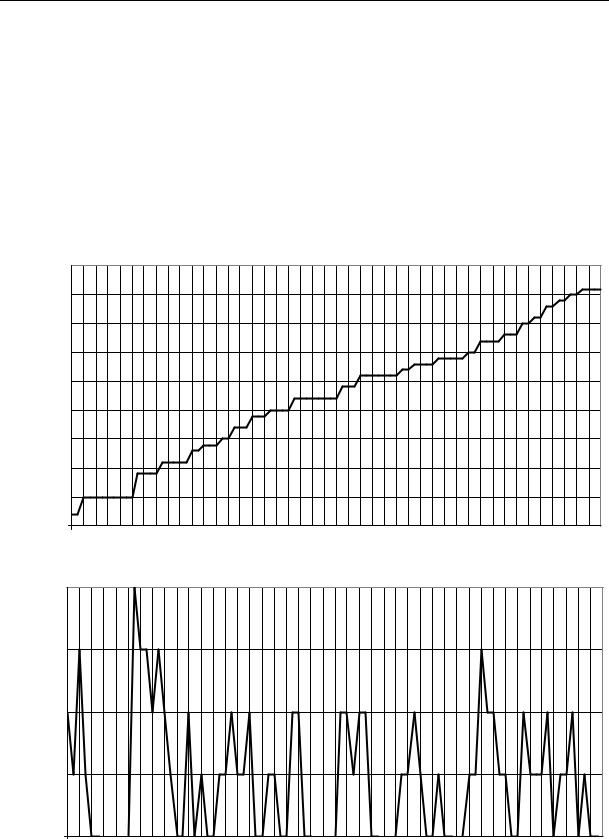
Fig. 3 shows a window of the modulus of imitation modeling with a graph of changes in a number of emergency demands waiting to be handled and being serviced.
а) |
заявок |
45 |
|
|
|
|
|
|
|
|
|
40 |
|
|
|
|
|
|
|
|
|
|
demands |
|
|
|
|
|
|
|
|
|
|
аварийных |
35 |
|
|
|
|
|
|
|
|
|
30 |
|
|
|
|
|
|
|
|
|
|
emergencyof |
25 |
|
|
|
|
|
|
|
|
|
Поток |
|
|
|
|
|
|
|
|
|
|
|
|
|
|
|
|
|
|
|
|
|
Flow |
20 |
|
|
|
|
|
|
|
|
|
|
|
|
|
|
|
|
|
|
|
|
|
15 |
|
|
|
|
|
|
|
|
|
|
10 |
|
|
|
|
|
|
|
|
|
|
5 |
|
|
|
|
|
|
|
|
|
|
0 |
|
|
|
|
|
|
|
|
|
|
01.02.15 |
11.02.15 |
21.02.15 |
03.03.15 |
13.03.15 |
23.03.15 |
02.04.15 |
12.04.15 |
22.04.15 |
ДатаDate
b) |
4 |
|
|
|
|
|
|
|
|
|
emergencyofNumberобслуживаемыхКоличествоdemandsаварийныхbeingзаявокserviced |
|
|
|
|
|
|
|
|
|
3 |
|
|
|
|
|
|
|
|
|
2 |
|
|
|
|
|
|
|
|
|
1 |
|
|
|
|
|
|
|
|
|
0 |
|
|
|
|
|
|
|
|
|
01.02.15 |
11.02.15 |
21.02.15 |
03.03.15 |
13.03.15 |
23.03.15 |
02.04.15 |
12.04.15 |
22.04.15 |
|
|
|
|
|
|
|
|
|
ДатаDate |
Fig. 3. Results of calculating the operation of emergency services of a gas distribution organization: а) an incoming flow of emergency flows; b) amount of emergency demands in the system
24
Issue № 2 (38), 2018 |
ISSN 2542-0526 |
3. Imitation modeling of handling emergency demands. Using the developed imitation model of handling emergency demands, calculations of the operation of an emergency service of a gas distribution organization were performed using an example of Voronezh. Fig. 3 shows the results of calculating the operation of an emergency service of a gas distribution organization for two emergency teams.
As a result of modeling, all the characteristics of the operation of an actual emergency service of a gas distribution organization for the operation with an actual flow of emergency demands [5, 6, 10—12]. The sensitivity of each index to changes in the intensity of a flow of emergency demands and intensity of a flow of handling emergency demands was evaluated. This allowed flaws in the operation of repairing units to be identified and major directions in improving it to be determined.
Conclusions
1.Based on the theory of mass service, the algorithm of determining an optimal structure and parameters of the operation of emergency services of a gas distribution organization was developed.
2.In order to predict the parameters of the operation of emergency services, a software in the MatLab — Simulink package was developed to allow flexible management depending on changes in the operation conditions. The software is capable of advanced handling of graphical representation of the results.
3.The use of the developed program allows the efficiency of the operation of repairing units of a gas distribution organization to be improved and a safety level of gas equipment to be maintained at a high level.
References
1.Kolosov A. I., Shcherbinin G. I., Svishchev O. V., Vasil'ev I. V. Dinamicheskoe modelirovanie kak instrument prognozirovaniya i planirovaniya meropriyatii ekspluatatsii inzhenernykh sistem v neopredelennykh stokhasticheski razvivayushchikhsya situatsiyakh [Dynamic modeling as a tool for forecasting and planning of engineering systems operation activities in uncertain stochastic situations]. Nauchnyi zhurnal. Inzhenernye sistemy i sooruzheniya, 2012, no. 3 (8), pp. 39—43.
2.Kolosov A. I., Panov M. Ya. Matematicheskoe modelirovanie protsessa restrukturizatsii gorodskikh sistem gazosnabzheniya nizkoi stupeni davleniya [Mathematical modeling of the process of restructuring urban lowpressure gas supply systems]. Nauchnyi vestnik Voronezhskogo GASU. Stroitel'stvo i arkhitektura, 2013, no. 2 (30), pp. 34—41.
3.Kolosov A. I., Panov M. Ya., Stognei V. G. Modelirovanie potokoraspredeleniya na etape razvitiya struktury gorodskikh sistem gazosnabzheniya [Modeling of flow distribution at the stage of development of the structure of urban gas supply systems]. Vestnik Voronezhskogo gosudarstvennogo tekhnicheskogo universiteta, 2013, vol. 3, no. 3—1, pp. 56—62.
25

Russian Journal of Building Construction and Architecture
4.Kolosov A. I. Razrabotka modeli vosstanovleniya sistem inzhenernogo obespecheniya pri ekstraordinarnykh vozdeistviyakh [The development of the recovery model, systems engineering support, under extraordinary influences]. Vestnik Voronezhskogo gosudarstvennogo tekhnicheskogo universiteta, 2004, no. 10, p. 44.
5.Kolosov A. I., Sotnikova O. A. Razrabotka modeli likvidatsii posledstvii chrezvychainykh situatsii na inzhenernykh sistemakh energetiki [Development of a model of emergency response on power engineering systems]. Vestnik Voronezhskogo gosudarstvennogo tekhnicheskogo universiteta, 2006, vol. 2, no. 4, pp. 27—31.
6.Kolosova N. V., Sen'kin K. M., Soya Yu. A., Bocharov V. O. Likvidatsiya posledstvii avarii na ob"ektakh inzhenernykh sistem teplogazosnabzheniya [Liquidation of consequences of accidents at facilities of engineering systems of heat and gas supply]. Nauchnyi zhurnal. Inzhenernye sistemy i sooruzheniya, 2012, no. 3 (8), pp. 44—50.
7.Loboda A. V., Kuznetsov S. N. Ispol'zovanie metoda konformnykh otobrazhenii dlya opredeleniya polei skorostei vozdushnykh potokov v zadachakh ventilyatsii [Using the method of conformal mappings to determine velocity fields of air flows in ventilation tasks]. Nauchnyi vestnik Voronezhskogo GASU. Stroitel'stvo i arkhitektura, 2011, no. 1 (21), pp. 15—22.
8.Mel'kumov V. N., Kuznetsov S. N., Gulak V. V. Modelirovanie zadymlennosti pomeshchenii slozhnoi konfiguratsii v nachal'noi stadii pozhara [Modeling of smoke content of premises of complex configuration at initial stage of fire]. Nauchnyi vestnik Voronezhskogo GASU. Stroitel'stvo i arkhitektura, 2010, no. 3 (19), pp. 131—138.
9.Mel'kumov V. N., Kuznetsov S. N., Pavlyukov S. P., Cheremisin A. V. Prognozirovanie fil'tratsii gaza v grunte pri ego utechke iz podzemnogo gazoprovoda [Prediction of gas filtration in the soil during its leakage from the underground gas pipeline]. Izvestiya OrelGTU. Stroitel'stvo. Transport, 2008, no. 3/19 (549). pp. 61—65.
10.Pavlyukov S. P., Kuznetsova G. A., Kobelev A. N. Analiz sostava i prodolzhitel'nosti ekspluatatsii gazovogo oborudovaniya [Analysis of the composition and duration of operation of gas equipment]. Inzhenernye sistemy i sooruzheniya, 2012, no. 3 (8), pp. 16—23.
11.Panov M. Ya., Martynenko G. N., Kolosov A. I. Operativnoe upravlenie na osnove vozmushchennogo sostoyaniya gorodskoi sistemy gazosnabzheniya [Operational management on the basis of the indignant condition of city system of gas supply]. Nauchnyi vestnik Voronezhskogo GASU. Stroitel'stvo i arkhitektura, 2015, no. 4 (44), pp. 48—55.
12.Sotnikova O. A., Kolosova N. V., Shabanov D. N. Ratsional'noe posleavariinoe vosstanovlenie sistem teplosnabzheniya [Rational disaster recovery of heat supply systems]. Nauchnyi zhurnal. Inzhenernye sistemy i sooruzheniya, 2010, no. 2, pp. 121—124.
13.Dharmawirya M., Adi E. Case Study for Restaurant Queuing Model, International Conference on Management and Artificial Intelligence. IPEDR, 2011, vol. 6, pp. 52—55.
14.Dieter F., Herwig B. Discrete-time queueing systems with Markovian preemptive vacations. Mathematical and Computer Modelling, 2013, vol. 57, no. 3, pp. 782—792.
15.Regattieri A., Gamberini R., Lolli F., Manzini R. Designing production and service systems using queuing theory: principles and application to an airport passenger security screening system. Int. J. Serv. Oper. Manage, 2010, no. 6 (2), pp. 206—225.
16.Vijay Prasad S., Badshah V. H. Pradeep Porwal Decision Making by M/M/S Queuing Model: a Case Study-I.
International Journal of Pure and Applied Mathematical Sciences, 2014, vol. 7, pp. 137—143.
17.Zhou Y. P., Xi H. S., Yin B. Q. Optimality equations based performance potentials for a class of controlled closed queuing networks. Control Theory Appl, 2002, no. 19 (4), pp. 521—526.
26

Issue № 2 (38), 2018 |
ISSN 2542-0526 |
WATER SUPPLY,SEWERAGE,BUILDING CONSTRUCTION
OF WATER RESOURCES PROTECTION
UDC 504.054 : 543.31
E. G. Davydova1
ANALYSIS OF THE QUALITY OF NATURAL WATER OF A RESERVOIR NEAR AN ORE EXTRACTION PLANT USING THE METHOD
OF COMPLEX ASSESSMENT OF NATURAL WATER POLLUTION
Voronezh State Technical University
Russia, Voronezh, tel.: (473) 271-76-17, е-mail: davkat@mail.ru
1PhD in Chemistry, Assoc. Prof. of the Dept. of Chemistry and Chemical Technology of Materials
Statement of the problem. At present close attention is paid to environmental safety of any new manufacturing, because the anthropogenic influence on the state of the river basin should be minimal. The solution to this problem is impossible without a complex assessment of the state of natural waters in a given area before and after the start of the activities of an ore mining plant on a number of hydrochemical indicators.
Results. Complex hydrochemical indices of contamination of samples taken in the zone of impact of ore mining are determined. An excess of the maximum permissible concentrations for the content of iron, copper, zinc, manganese, chemical and biological oxygen consumption was found. According to the obtained values of the specific combinatorial water quality Index, it is established that the water being studied is characterized as very polluted. By the multiplicity of exceeding the MPC, the level of contamination is characterized as high.
Conclusions. It has been established that in the period of an increased runoff, stable pollutants are zinc, iron and copper. It is assumed that the technogenic factor plays an important role in increasing the concentration of these elements. The results allows one to predict the effect of possible impacts of mining sulfide copper-nickel deposits on aquatic ecosystems of vast adjoining territories in the Novokhopersky region.
Keywords: hydrochemical indicators of contamination, maximum permissible concentrations, specific combinatorial water quality Index, natural water.
Introduction. It is known that 2012 the Ural Mining and Metallurgical Company (UMMC) won the first prize at a contest of sulfide copper-nickel mines in Novokhoperskiy district of Voronezh region where geological mining is now taking place [12]. In mass media there has
© Davydova E. G., 2018
27

Russian Journal of Building Construction and Architecture
been a heated debate between those supporting and opposing the nickel project. Therefore it is necessary to analyze possible outcomes of a mining production in Voronezh region in terms of its effect on the chemical composition of surface water.
According to [16], a mining complex is the largest source of industrial waster contributing to an exponential growth of environment pollution. Presently most wastes are associated with the Ural Federal District, district of the Kursk Magnetic Anomaly, Tula and Ryazan regions. Over 500 thousand hectors of land in Russia are taken up by mining industrial storages and the area that is 10––15 times of that is impacted by environmental waste with about 80 billion tons of solid waste only are accumulated in dumps and other storages across the country. Around 10 thousand hectors employed for dumps is suitable for agriculture [4]. If nickel starts being mined in Voronezh region, our region will be facing these issues as well.
The importance of the study is due to the danger posed by this type of mining that leads to the pollution of surface water ecosystems by industrial waste. The major source of technological substances coming into water flows is discharge from mines, mining plants, storages as well as dumps. Acid discharge waters are particularly dangerous as they contain a lot of metals that are mobile and in high concentrations that are considerably over the maximum permissible concentration (MPC) [3].
Apart from poisonous substances, non-organic impurities that are emitted in nickel and zinc industries, oxidative processes are also hazardous and result from the oxygen reduction in water and an increase in its biochemical consumption, which leads to the degradation of the organoleptic indices of water. Such metals as mercury, cadmium, lead, chrome, copper, nickel are accumulated in water reservoirs and have an impact on bacteria that mineralize active substances [6].
The existing methods of comprehensive evaluation of the pollution of surface water are grouped as follows: the first group are the methods that evaluate the quality of water according to a set of hydrochemical, hydrophysical, hydrobiological, microbiological indices; the second group are the methods that involve calculations of complex indices of water pollution. The use of complex indices allows to address the following:
1)a quantitative evaluation of water pollution simultaneously along a wide range of ingredients and quality indices;
2)classification of water according to a pollution level;
3)analytical information distributed to interested parties that is comprehensive and handson [2].
28
Issue № 2 (38), 2018 |
ISSN 2542-0526 |
The method of complex evaluation of a pollution level of surface water according to the hydrochemical indices in order to generalize information about the chemical composition of water proposes an algorithm of calculating a combinatorial index of water pollution and combinatory pollution effect that constitutes an overall pollution level and specific combinatory water pollution index.
The latter is used to assess the proportion of a pollution effect that makes up an overall pollution level that involves a combination of pollutants.
The result is the classification of water quality based on this index that allows surface water to be classed into 5 groups depending on their pollution level: the first class is relatively clean, the second one is slightly polluted, the third one is polluted, the fourth one is dirty, the fifth one is extremely dirty.
The value of a specific combinatory water pollution index might vary from 1 to 16 in water with different pollution levels. The worst water quality corresponds with a large index. Currently calculations of these indices are top priority for evaluating a pollution level (quality) of water as unlike a combinatorial index of water pollution, apart from determining a multiplicity of an increase over MPC as well as recurrent increases, these indices are more indicative of the actual water quality.
Only hydrochemical indices are taken into account as well as for calculations of a combinatorial index of water pollution [2].
The objective of the paper is to identify the pollution level of water reservoirs that are located in the vicinity of an ore-mining plant. A complex evaluation of a pollution level of surface waters according to the hydrochemical indices was performed in compliance with the Guideline 52.24.643-2002.
1. Research methods. Samples of river water in the vicinity of an ore-mining plant were taken for the study. The samples were being collected in two sites over four months. Site № 1 is up the stream, Site is lower with several rivers flowing between them. The character and intensity of the smell of natural water, clarity were determined according to the Guideline 52.24.496-2005.
For determining the chemical indices of natural water: a dry residue, рН, ions of iron, manganese, copper, zinc, ammonium, nitrate-, nitrite-, chloride-, phosphateand sulfate ions, chemical consumption of oxygen, biological consumption of oxygen over 5 days, the methods of gravimetry, photometry, turbidity, titrimetry were employed according to the methodology of quantitative chemical analysis (Table 1).
29

Russian Journal of Building Construction and Architecture
|
|
|
|
|
|
Table 1 |
|
|
|
Set of methods of Natural Federal Guidelines (NFG) adopted for the state |
|||||
|
|
|
and industrial environmental control of nature preservation |
|
|
||
|
|
|
|
|
|
NFG 14.1:2.4-95 |
|
1 |
рН |
|
NFG 14.1:2:3:4.121-97 |
9 |
Nitrate-ion |
|
|
|
|
|
|
|
|
NFG 14.1:2.3-95 |
|
2 |
Clarity |
|
Guideline 52.24.496-2005 |
10 |
Nitrite-ion |
||
|
|
|
|
|
|
NFG 14.2:4.209-05 |
|
3 |
Smell |
|
Guideline 52.24.496-2005 |
11 |
Ammonium ion |
||
|
|
|
|
|
|
|
|
4 |
Chlorides |
|
NFG 14.1:2.96-97 |
12 |
Phosphate-ion |
NFG 14.1:2.112-97 |
|
|
|
|
|
|
|
|
|
5 |
Sulfates |
|
NFG 14.1:2.159-2000 |
13 |
Biological consumption |
NFG 14.1:2:3:4.123-97 |
|
|
|
|
|
|
of oxygen over 5 days |
|
|
|
|
|
|
|
|
|
|
6 |
Iron |
|
NFG 14.1:2.2-95 |
14 |
Chemical consumption |
NFG 14.1:2.100-97 |
|
|
of oxygen |
|
|||||
|
|
|
|
|
|
|
|
|
|
|
|
|
|
|
|
7 |
Copper |
|
NFG 14.1:2.48-96 |
15 |
Dry residue |
NFG 14.1:2.114-97 |
|
|
|
|
|
|
|
|
|
8 |
Zinc |
|
NFG 14.1:2.60-96 |
16 |
Mangenese |
NFG 14.1:2.61-96 |
|
|
|
|
|
|
|
|
|
2. Analysis of the determined physical and chemical characteristics of natural river water. Table 2 presents the results of determining the physical and mechanical characteristics of the investigated samples of river water compared to the guidelines for water objects of fishing water use.
A hydrogen index is essential to the character of chemical and biological processes occurring in water. Depending on pH, the rate of chemical reactions as well as corrosion aggression, toxicity of pollutants, etc. might vary. According to the classification of natural water based on a hydrogen index, the investigated sample is alkalescent over the entire time range (рН from 7.5 to 7.9), except November when рН of water can be called neutral (рН from 7.1 to 7.3).
It was found that among the examined characteristics an increase in the MPC is seen in iron, copper, manganese as well as chemical consumption of oxygen as well as biological consumption of oxygen over 5 days (Fig. 1). This was the case for iron and copper throughout the entire study. An increase in the MPC for the biological consumption of oxygen over 5 days occurred only once below the flow in December, which is likely due to seasonal changes [9]. The iron content was 6.8 of MPC at the beginning of autumn and 1.8 of MPC at the beginning of winter. There is a reduction in the iron content in the run up to December.
Iron coming into surface water is largely due to weathering of rock and its subsequent solution as well as anthropogenic pollution also by waste water of ore-mining plants. Surface water contains iron as an impurity mainly in organic complexes with humic acids and it also forms colloid and high-dispersion dredge. At рН > 4.5 iron (II) is oxidized to iron (III) that precipitates into a hydroxide [7]. A high concentration of iron at these sites might be due to a fairly high natural level of iron in this area, however one cannot eliminate the technological factor altogether.
30