

книга / 2016_Kaplan_USMLE_Step_1_Lecture_Notes_Pharmacology
.pdfPreface
These volumes of Lecture Notes represent the most-likely-to-be-tested material on the current USMLE Step 1 exam.
We want to hear what you think. What do you like about the Notes? What could be improved? Please share your feedback by e-mailing us at medfeedback@kaplan.com.
Best of luck on your Step 1 exam!
Kaplan Medical
ix

SECTION I
General
Principles

Pharmacokinetics 1
Learning Objectives
Answer questions about permeation, absorption, distribution, biotransformation, elimination, and steady state
Solve problems concerning important pharmacokinetics calculations
Pharmacokinetic characteristics of drug molecules concern the processes of absorption, distribution, metabolism, and excretion. The biodisposition of a drug involves its permeation across cellular membrane barriers.
Drug administration (IM, PO, etc.)
Absorption into plasma
|
Plasma |
Sites of |
|
Distribution to tissues |
|
Tissue |
Bound drug |
action |
storage |
|
Receptors |
|
|
|
|
Free drug |
|
Drug metabolism |
|
|
|
Drug excretion |
(Liver, lung, blood, etc.) |
|
|
|
(Renal, biliary, |
|
|
|
exhalation, etc.) |
|
|
|
|
|
|
Figure I-1-1. Drug Biodisposition |
||||
3

Section I l General Principles
In A Nutshell
For Weak Acids and Weak Bases
Ionized = Water soluble
Nonionized = Lipid soluble
PERMEATION
●Drug permeation is dependent on:
–Solubility. Ability to diffuse through lipid bilayers (lipid solubility) is important for most drugs; however, water solubility can influence permeation through aqueous phases.
–Concentration gradient. Diffusion down a concentration gradient—only free, unionized drug forms contribute to the concentration gradient.
–Surface area and vascularity. Important with regard to absorption of drugs into the systemic circulation. The larger the surface area and the greater the vascularity, the better is the absorption of the drug.
●Ionization
–Many drugs are weak acids or weak bases and can exist in either nonionized or ionized forms in an equilibrium, depending on the pH of the environment and the pKa (the pH at which the molecule is 50% ionized and 50% nonionized)
–Only the nonionized (uncharged) form of a drug crosses biomembranes.
–The ionized form is better renally excreted because it is water soluble.
Weak Acid |
R–COOH |
|
|
R–COO– + H+ |
||
|
||||||
|
||||||
|
(crosses membranes) |
|
|
(better cleared) |
||
Weak Base |
R–NH+ |
|
|
R–NH |
2 |
+ H+ |
|
|
|||||
|
|
|||||
|
3 |
|
|
|
|
|
|
(better cleared) |
|
|
(crosses membranes) |
||
Clinical Correlate
Gut bacteria metabolize lactulose to lactic acid, acidifying the fecal masses and causing ammonia to become ammonium. Therefore, lactulose is useful in hepatic encephalopathy.
formNonionized |
|
|
|
|
|
|
|
Weak |
|
ofclearanceRenal |
|
|
|
|
|
|
|
|
|
||||
|
|
|
|
|
|
|
|
||||
80 |
|
|
|
|
|
|
base |
|
|||
|
|
|
|
|
|
|
|
|
|||
|
60 |
|
|
|
|
|
|
|
|
|
|
|
|
|
|
|
|
|
|
|
|
|
|
% |
40 |
|
|
|
|
|
|
|
|
|
drug |
|
|
|
|
|
|
|
|
|
|||
20 |
|
|
|
|
|
|
Weak |
|
|||
|
|
|
|
||||||||
|
|
|
|
|
|
|
|
acid |
|
|
|
|
|
|
|
|
|
|
|
|
|
|
|
|
|
|
|
|
|
|
|
|
|
|
|
|
|
|
–2 –1 |
0 +1 +2 |
|
|
|||||
|
|
|
|
|
|
pHpKa |
|
|
|||
Figure I-1-2. Degree of Ionization and Clearance Versus pH Deviation from pKa
4

Ionization Increases Renal Clearance of Drugs
●Only free, unbound drug is filtered.
●Both ionized and nonionized forms of a drug are filtered.
●Only nonionized forms undergo active secretion and active or passive reabsorption.
●Ionized forms of drugs are “trapped” in the filtrate.
●Acidification of urine → increases ionization of weak bases → increases renal elimination.
●Alkalinization of urine → increases ionization of weak acids → increases renal elimination.
Glomerulus |
Proximal |
||
|
|
tubule |
|
|
|
|
|
|
|
|
|
Free drug |
|
|
|
|
|
|
|
|
|
|
|
I |
|
|
|
|
I |
|
|
||
Filtered |
|
Excreted |
||||||||
(unbound to |
N |
|
N |
|
||||||
protein) |
|
|
|
|
||||||
Secretion |
|
|
Reabsorption |
|||||||
|
|
|
|
|
|
|
|
|
||
|
|
|
|
|
|
|
|
|
||
|
|
|
|
|
|
|
|
|||
|
|
|
|
|
|
|
|
|
|
|
Blood vessel |
|
|
N |
|
|
|||||
|
|
|
|
|
|
|
||||
|
|
|
|
|
|
I = ionized drug |
||||
|
|
|
|
|
N = nonionized drug |
|||||
|
Figure I-1-3. Renal Clearance of Drug |
|||||||||
Chapter 1 l Pharmacokinetics
Clinical Correlate
To Change Urinary pH
●Acidify: NH4Cl, vitamin C, cranberry juice
●Alkalinize: NaHCO3, acetazolamide (historically)
●See Aspirin Overdose and Management in Section VI.
Modes of Drug Transport Across a Membrane |
|
|
|
||||||
Table I-1-1. The Three Basic Modes of Drug Transport Across a Membrane |
Bridge to Physiology |
||||||||
Mechanism |
|
Direction |
|
Energy |
|
Carrier |
|
Saturable |
|
|
|
|
|
||||||
|
|
|
|
Ion and molecular transport |
|||||
|
|
|
|
|
|
|
|
|
|
|
|
|
|
Required |
|
|
|
|
mechanisms are discussed |
Passive diffusion |
|
Down gradient |
|
No |
|
No |
|
No |
in greater detail in Section |
|
|
|
|
I of Physiology. |
|||||
|
|
|
|
|
|
|
|
|
|
Facilitated |
|
Down gradient |
|
No |
|
Yes |
|
Yes |
|
diffusion |
|
|
|
|
|
|
|
|
|
Active transport |
|
Against gradient |
|
Yes |
|
Yes |
|
Yes |
|
|
|
(concentration/ |
|
|
|
|
|
|
|
|
|
electrical) |
|
|
|
|
|
|
|
|
|
|
|
|
|
|
|
|
|
5

Section I l General Principles
Cmax = maximal drug level obtained with the dose.
tmax = time at which Cmax occurs.
Lag time = time from administration to appearance in blood.
Onset of activity = time from administration to blood level reaching minimal effective concentration (MEC).
Duration of action = time plasma concentration remains greater than MEC.
Time to peak = time from administration to Cmax.
ABSORPTION
●Concerns the processes of entry of a drug into the systemic circulation from the site of its administration.
●The determinants of absorption are those described for drug permeation.
●Intravascular administration (e.g., IV) does not involve absorption, and there is no loss of drug. Bioavailability = 100%
●With extravascular administration (e.g., per os [PO; oral], intramuscular [IM], subcutaneous [SC], inhalation), less than 100% of a dose may reach the systemic circulation because of variations in bioavailability.
Plasma Level Curves
Cmax |
|
|
Time to peak |
|
|
Peak level |
|||||||||
|
|
|
|
||||||||||||
|
|
|
|||||||||||||
concentration |
|
|
i |
|
|
|
|
|
|
|
|
|
|||
|
|
|
|
|
n |
|
|
|
|
|
|
|
|
|
|
|
|
|
|
|
o |
|
|
|
|
|
|
|
|
Minimum effective |
|
|
|
|
|
t |
|
|
|
|
|
|
|
|
|
||
drug |
|
|
p |
|
|
|
|
|
|
|
|
|
|
||
|
|
|
|
|
|
|
|
|
|||||||
|
|
r |
|
|
|
|
|
|
|
|
|
|
|||
|
o |
|
|
|
|
|
|
|
|
concentration |
|||||
|
b |
|
|
|
|
|
|
|
|
|
|||||
|
|
|
s |
|
|
|
|
|
|
|
|
|
|||
Plasma |
A |
|
|
|
|
|
|
|
|
E |
|||||
|
|
|
|
|
|
|
|
|
|
|
|
|
|||
|
|
|
|
|
|
|
|
|
|
|
|
|
l |
||
|
|
|
|
|
|
|
|
|
|
|
|
|
|
|
i |
|
|
|
|
|
|
|
|
|
|
|
|
|
|
|
m |
|
|
|
|
|
|
|
|
|
|
|
|
|
|
|
i |
|
|
|
|
|
|
|
|
|
|
|
|
|
|
|
n |
|
|
|
|
|
|
|
|
|
|
|
|
|
|
|
a |
|
|
|
|
|
|
|
|
|
|
|
|
|
|
|
ti |
|
|
|
|
|
|
|
|
|
|
|
|
|
|
|
o |
|
|
|
|
|
|
|
|
|
|
|
|
|
|
|
n |
|
|
|
|
|
|
|
|
|
|
|
|
|
|
|
|
|
|
|
|
|
|
|
|
|
tmax |
|
|
|
Time |
||
|
|
|
|
|
|
|
|
|
|
|
|
||||
|
|
|
Lag |
|
|
|
|
|
|||||||
|
|
|
|
|
|
|
|
|
|
|
|
||||
Onset of |
|
|
|
Duration of action |
|
|
|
||||||||
|
|
|
|
|
|
|
|
|
|
||||||
|
|
|
|
|
|
|
|
|
|||||||
|
|
|
|
|
|
|
|
|
|
||||||
|
|
|
|
|
|
|
|
|
|
|
|
|
|
||
activity |
|
|
|
|
|
|
|
|
|
|
|
|
|
|
|
|
|
|
|
|
|
|
|
|
|
|
|
|
|
|
|
Figure I-1-4. Plot of Plasma Concentration Versus Time
6
Chapter 1 l Pharmacokinetics
Bioavailability (f)
Measure of the fraction of a dose that reaches the systemic circulation. By definition, intravascular doses have 100% bioavailability, f = 1.
|
Intravascular dose |
concentrationdrugPlasma |
.g., IV bolus) |
AUCPO |
|
|
f = |
|
AUCIV |
Time
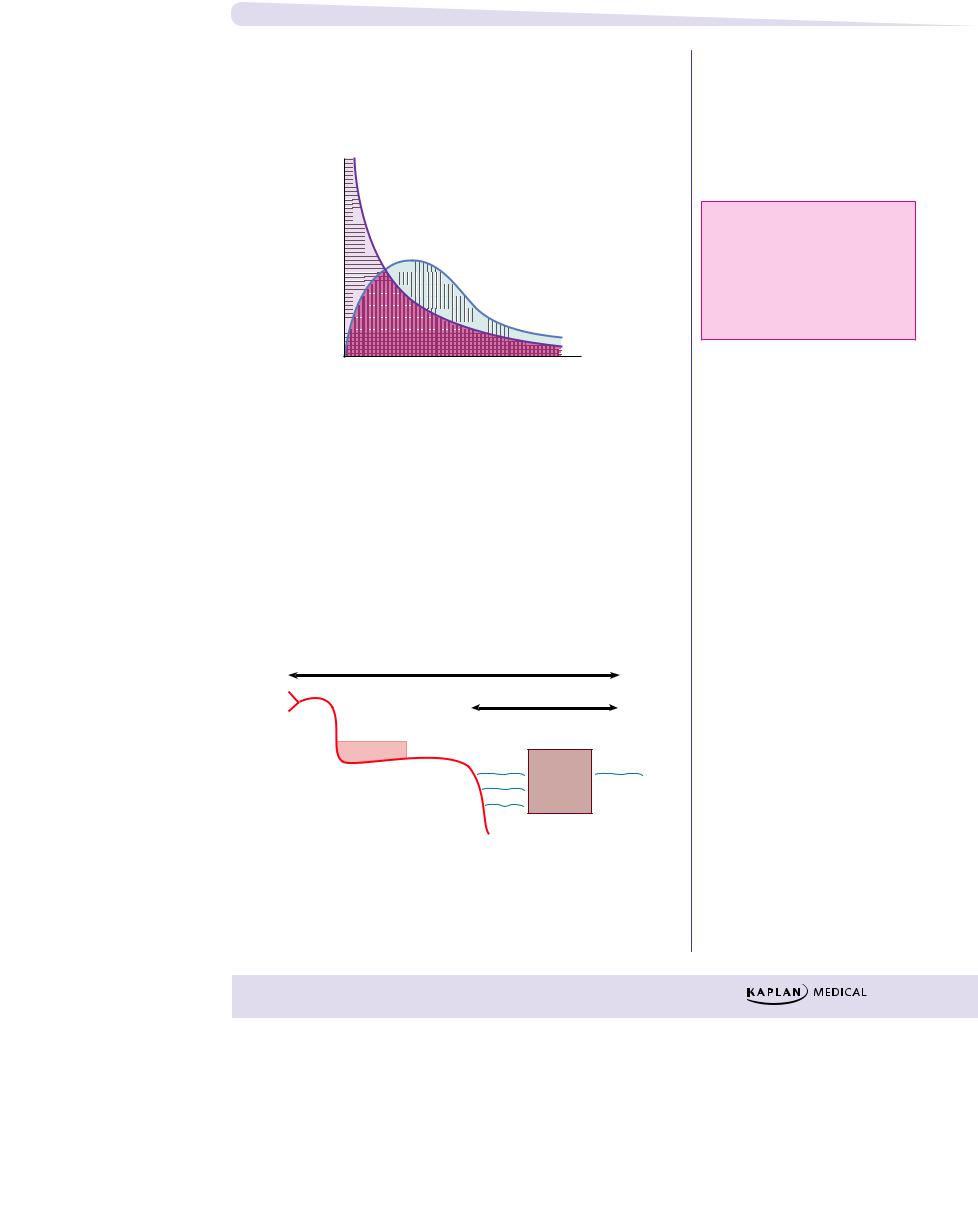
Figure I-1-5. Area Under the Curve for an
IV Bolus and Extravascular Doses
First-Pass Effect
With oral administration, drugs are absorbed into the portal circulation and initially distributed to the liver. For some drugs, their rapid hepatic metabolism decreases bioavailability—the “first-pass” effect.
Examples:
●Lidocaine (IV vs. PO)
●Nitroglycerin (sublingual)
|
Bioavailability |
Mouth |
First pass |
Stomach |
Portal |
circulation |
Liver Systemic
circulation
GI tract
Figure I-1-6. Bioavailability and First-Pass Metabolism
AUC: area under the curve
PO: oral
IV: intravenous bolus
AUCIV: horizontally striped area AUCPO: vertically striped area
7

Section I l General Principles
Clinical Correlate
Drugs with high plasma protein binding and narrow therapeutic range, e.g., warfarin and phenytoin, are prone to drug interactions.
Bridge to Physiology
Approximate Vd Values (weight 70 kg)
●plasma volume (3 L)
●blood volume (5 L)
●extracellular fluid
(ECF 12–14 L)
●total body water (TBW 40–42 L)
DISTRIBUTION
●The processes of distribution of a drug from the systemic circulation to organs and tissue.
●Conditions affecting distribution include:
−Under normal conditions, protein-binding capacity is much larger than is drug concentration. Consequently, the free fraction is generally constant.
–Many drugs bind to plasma proteins, including albumin, with an equilibrium between bound and free molecules (recall that only unbound drugs cross biomembranes).
Drug + Protein |
|
Drug-Protein Complex |
|
||
|
||
(Active, free) |
|
(Inactive, bound) |
–Competition between drugs for plasma protein-binding sites may increase the “free fraction,” possibly enhancing the effects of the drug displaced. Example: sulfonamides and bilirubin in a neonate
Special Barriers to Distribution
●Placental—most small molecular weight drugs cross the placental barrier, although fetal blood levels are usually lower than maternal. Example: propylthiouracil (PTU) versus methimazole
●Blood–brain—permeable only to lipid-soluble drugs or those of very low molecular weight. Example: levodopa versus dopamine
Apparent Volume of Distribution (Vd)
A kinetic parameter of a drug that correlates dose with plasma level at zero time.
V |
Dose |
where C0 = [plasma] at zero time |
= |
||
d |
C0 |
|
● This relationship can be used for calculating Vd by using the dose only if one knows C0.
● Vd is low when a high percentage of a drug is bound to plasma proteins.
● Vd is high when a high percentage of a drug is being sequestered in tissues. This raises the possibility of displacement by other agents; examples: verapamil and quinidine can displace digoxin from tissue-binding sites.
● Vd is needed to calculate a loading dose in the clinical setting (see Pharmacokinetic Calculation section, Equation 4).
8