

brechignac_f_desmet_g_eds_equidosimetry_ecological_standardi
.pdf124
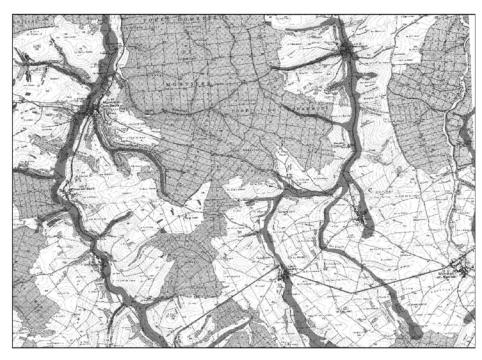
The corresponding map of 63Ni phytoavailability was established by differentiating the four classes obtained from the soil map (Figure 2). Most of the Bure area is classified as class II and III, respectively as moderate and high transfer of 63Ni.
Fig.2 Map of 63Ni phytoavailability potential according to the labile pool of Ni in
soils of the Bure area. In blue: E90d<5 mg kg-1; in red: 5 mg kg-1<E90d<10 mg kg-1; in white 10 mg kg-1<E90d<20 mg kg-1; in yellow E90d>20 mg kg-1; in green: forested areas in the white group.
Kd values for 63Ni were easily calculated from E90d values with knowledge of the ratio of the tracer in the soil solution t = 90d to its concentration in the solid phase (exchanged within the labile pool). From the map, the critical Kd value in terms of phytoavailability is calculated from the yellow zone (lowest value) and the likely Kd value from the most widespread zone (white zone). These values are
respectively Kd critical = 185 L kg-1; Kd likely = 1 600 L kg-1. The critical Kd value for 63Ni accumulation in soils over time has to be considered as the opposite.
The spatial distribution of the potential of 63Ni phytoavailability and its corresponding soil Kd allowed localisation of critical groups or ecosystems. In the case of safety assessment in the biosphere of radioactive waste disposal, we consider soil Kd as a parameter responsible for the accumulation of the
125
radionuclide over the long term in soils following application through irrigation water. Kd values allow for the expression of loss through leaching (the other losses being plant uptake and radioactive decay). In this case, the higher the Kd, the greater the radiation and dust inhalation exposures for organisms living on the soil. The critical ecosystem regarding this aspect is the yellow area and therefore consists of the colluvial soils occurring in dry valleys. These soils are very widespread across the Bure area and are sometimes located close to villages. If we consider 63Ni phytoavailability, the lower the E90d value, the higher the accumulation of the radionuclide in plants and therefore the intake by man and other domesticated or wild animals. Critical ecosystems in this case are located in the alluvial soils of the Bure area. This is an important factor as in this karstic limestone plateau, all villages are situated in the valleys where streams flow. Therefore, the entire population of the area dwells in the most critical place in terms of intake exposure. Garden soils are mostly situated in this area, which is of great concern to human populations.
3.2. 99Tc PHYTOAVAILABILITY
As 99TcO4- inputs are supposed to occur during the growing season, most of the added radionuclide will be retained in the upper layer of soils while being taken up by crops (approximately 50% of the input). Therefore, the reducing conditions at this depth will probably affect the fate of 99Tc more than at any other depth. Consequently, measurement of the redox potential concerns solely the surface horizon of the profile. The Eh values ranged from –70 to 350 mV, with the lowest values being found in grassland soils located in wetland areas close to streams (-70 mV) or situated in alluvial zones (-20 to -4 mV). At the surface of such soil profiles between 0 and 15 cm, iron oxidation spots are visible which are due to gleying. However, the majority of the soils of the area present positive Eh values at the soil surface. In agricultural soils (Rendzic Leptosols, Calcisols, Fluvic and Dystric cambisols), Eh ranged between 260 and 315 mV. Slightly lower values can be found at the surface of soils developed on poor draining marls (250 mV). Eh variation can be found with respect to topography. Hence, in the Glandenoie plot, Eh values on luvisols (Luvisols) are as high as 300 mV on the upper part of slopes and reach +68 mV further down the slope, where water stagnates. The highest Eh value was found in Dystric Cambisols from forested areas.
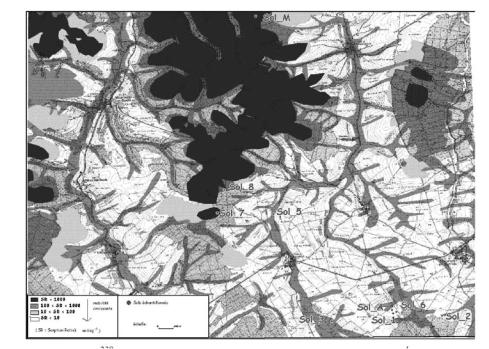
These results allowed us to draw two classes of soils according to their reducing properties in surface horizons (Figure 3), namely:
Class I: |
220<Eh<350 mV |
Class II: |
-70 <Eh<220 mV |
126
Fig 3. Map of Eh values in soils of the Bure area (measured in May 2001).
In white: 220 mV<Eh<450 mV; in blue: -70 mV<Eh<220 mV; in green: forested areas in the white group.
To each class, a level of soil plant transfer of 99Tc may be associated a level of soil plant transfer of 99Tc. The highest transfer is obtained for the highest redox potential. If a decrease of the transfer of 99Tc occurs, it is most likely to affect the soils from class II. The critical area in terms of 99Tc accumulation in soils over the long term corresponds to the soils of class II. In this area long-term Kd values of 99Tc may differ significantly from 0 (typical values in rendzinas) and reach 1.5 due to temporarily reducing conditions (2). In terms of plant transfer, the critical area in which transfer factors should reach the order of 101-102 (depending on the dilution rate in soil water and evapotranspiration) covers approximately 95 % of the territory, i.e. class I.
3.3. 238U MOBILITY
Calculation of 238U Kd values according to Eq. [1] showed large variations over the range of soils in the Bure area. They varied from 2.6 to 1297 L kg-1. Highest values were found in acid soils (Dystric Cambisols and Luvisols), both cultivated and forested. Lowest values were found in the Rendzic Leptosols and the Calcaric Cambisols on marls. This leads to a quite complex pattern of Kd
127
values in such a small area where there may be a vast variability within 500 m. In the case of U, mapping of Kd values is therefore essentially needed to locate surface of critical areas. In this respect, four classes of soils were established according to their mean Kd values and they were reported on figure 4. Classes were built on the basis of orders of magnitude between soils and not from statistical tests as for 63Ni. However, results from statistical differentiation did not differ much, but they were less discriminating for the map:
Class I: |
Kd<10 l kg-1 |
pH>8 |
Class II: |
10 l kg-1<Kd<100 l kg-1 |
7.1>pH>8 |
Class III: |
100 l kg-1<Kd<1000 l kg-1 |
6.3>pH>7.1 |
Class IV: |
Kd>1000 l kg-1 |
pH<6.3 |
Fig 4. Map of 238U Kd in soils of the Bure area. In white: Kd<10 L kg-1; in pink: 10 L kg-1<Kd<100 L kg-1; in blue 100 L kg-1<Kd<1000 L kg-1; in purple Kd>1000 L kg-1; in green: forested areas in the white group.
The location of the critical group in terms of accumulation of 238U and other radioisotopes of uranium in soils is the area covered by class IV. These soils are mainly forest soils or soils at the boundary between fields and forests. Any change in land use, especially cultivation of former forest soils, would lead to an increase in the critical area (irrigation should not occur in forests in the current
128
state). Some agricultural practices such as soil liming that increase soil pH can also greatly influence this pattern. Soil-to-plant transfer is generally enhanced by low Kd values. For uranium, this is not always the case as complexes such as uranyl carbonate are not as readily taken up by plants as the uranyl ion (7, 14). However, the highest mobility of uranium should lead to highest plant uptake. Consequently, the critical area in terms of U transfer to crops is, as for 99Tc, the area covered by soils from class I, i.e. the limestone plateau.
4. Conclusion
A prediction of the phytoavailability of the 63Ni, 99Tc and 238U at a regional scale was based on the superimposition of the laboratory measurement of the parameters significantly controlling the mobility and the phytoavailability of the three radionuclides and knowledge of soils over a 186 km2 area. The use of a soil map of the area was the most integrated approach to combine the greatest quantity of relevant information as to the mobility and phytoavailability of the radionuclides. A soil type is defined from the material from which the soil has developed and also from the biological, chemical and physical processes that led to its development. It is therefore possible with limited experimental approach, to extrapolate data obtained from a given type of soil to the whole area it covers. Results allowed the determination, for the three radionuclides, of critical areas in which accumulation in soils may be highest and other critical areas where accumulation in plants may be highest. They also allowed definition of the most likely values of Kd and transfer to plants of the three radionuclides in the area of Bure. In the case of 63Ni, inhalation and external radiation exposure to man and other living organisms is highest in stream valleys where villages and gardening areas are situated. Critical areas for soil-to-plant transfer are situated nearby in dry colluvial lowlands, also possibly used for gardening activities. For the two other radionuclides, information is not as precise but critical areas may not be situated in similar location to 63Ni.
However, this work is primarily a preliminary approach. The definition of a critical area is an extremely difficult task when several radionuclides with different chemical and biological behaviour are considered in a same area. The only way to solve the problem is to classify the importance of each radionuclide that is to assess the level of discharge in the site and to verify the radiological impacts of each radionuclide and the sensitivity of organisms to this impact. The scope of equidosimetry also takes into account the interactions with other pollutants derived from other human activities or natural processes. Sensitivity of organisms to pollutants will probably show synergistic or antagonistic effects which should be taken into account. Geographic Information Systems (GIS) present one option to deal with the complexity of the data that needs to be handled, firstly to specialize them and to define critical areas and secondly to link data about the behaviour of different pollutants and their effect on a same location. It is also possible to include models in the GIS approach, which despite being simple,
129
may be very helpful in helping to resolve the problem of equidosimetry in a specific site. The GIS approach is also essential to take into account the time dimension (evolution of soils, human scenarios,…) in the monitoring of the contamination of ecosystems.
Acknowledgements
Author wishes to thank Aurélie Pingot, Parissa Ghazi-Nouri and Louis Florentin for their useful assistance in the project. They are also grateful to the French agency for radioactive waste management (Andra) for funding this research.
References
1.Denys S., G. Echevarria, E. Leclerc-Cessac, S. Massoura and J.L. Morel (2002) Assessment of plant uptake of radioactive nickel from soils. Journal of Environmental Radioactivity. In press.
2.Echevarria, G., P. C. Vong, et E. Leclerc-Cessac and J.L. Morel (1997). Bioavailability of 99Tc as affected by plant species and growth, application form, and soil application. J. Environ. Qual 26: 947-956.
3.Ng, Y.C. (1982). A review of transfer factors for assessing the dose from radionuclides in agricultural products. Nuclear Safety, 23 : 57-71.
4.Sheppard, S. C., M. I. Sheppard, et W. G. Evenden (1990). A novel method used to examine variation in Tc sorption among 34 soils, aerated and anoxic. Journal of Environmental Radioactivity 11: 215-233.
5.Andersen P.R and T.H. Christensen (1988) Distribution coefficient of Cd, Co, Ni and Zn in soils.
Journal of Soil Science 39 : 15-22.
6.Quantin C., T. Becquer and J. Berthelin (2002) Mn-oxide : a major source of easily mobilisable Co and Ni under reducing conditions in New Caledonia Ferrasols. C.R. Geoscience, 334, 273-278.
7.Echevarria, G., M. I. Sheppard and J. L. Morel (2001). Effect of pH on the sorption of uranium in soils. Journal of Environmental Radioactivity 53 : 257-264.
8.Echevarria G., J.L. Morel, J.C. Fardeau and E. Leclerc-Cessac (1998) Assessment of phytoavailability of nickel in soils. Journal of Environmental Quality. 27, 1064-1070.
9.Denys S., G. Echevarria, E. Leclerc-Cessac and J.L. Morel (2001) Fate of 63Ni in undisturbed soil cores. In ICOBTE Proceedings, Guelph, Ontario, Canada. [CD-Rom].
10.Landa, E. R., L. H. Thorvigt, et R. G. Gast (1977). Effect of selective dissolution, electrolytes, aeration, and sterilization on 99Tc sorption by soils. J Environ. Qual. 6 (2) : 181-187.
11.Echevarria G. (1996) Contribution à la prévision des transferts sol-plante de radionucléides. PhD thesis, INPL, Vandoeuvre-les-Nancy, France. Abstract in English. 222 p.
12.Ashworth et D.J., G. Shaw, L. Ciciani and A.P. Butler (2002) Transport of iodine and technetium radionuclides in soils and plant uptake from near-surface contaminated groundwater. In proceedings
of International Workshop Andra-IUR “Mobility in Biosphere of Iodine, Technetium, Selenium and Uranium. Nancy, France, April 3rd-5th.
13.Denys S. (2001) Prédiction de la phytodisponibilité de deux radionucléides (63Ni et 99Tc) dans les sols. PhD thesis, INPL, France. 153 pp.
14.Ebbs, S. D., Brady, D. J. and Kochian, L. V. (1998) Role of uranium speciation in the uptake and translocation of uranium in plants. Journal of Experimental Botany, 49, 1183-1190.
RADIOECOLOGICAL FACTORS OF THE GEOLOGICAL ENVIRONMENT WITHIN UKRAINIAN TERRITORY
Ye. YAKOVLEV
Ukranian State Geological Institute, Kyiv
UKRAINE
1. Assessment of the current status of Ukraine’s geological environment
The Geological Environment (GE) is one of the most important components of the surroundings. Geological, environment implies the upper lithosphere zone which is largely exposed to the impact of human economic activities. Within this zone, a mineral basis-of the biosphere is being formed. GE includes soils, zones of surface aeration and mineral nutrition of the plants, bottom sediments, rocks and ground waters.
The modern concept of GE and its significance in evaluating natural surroundings are based on V.Vernadsky’s doctrine on noosphere which is a multicomponent media of human. life and activities in the upper lithospheric horizons. The influence of these activities is comparable with natural geological processes and often brings about the changes of their character and dynamics.
The mankind is closely associated with GE. Any technogenic change of the status of objects included in GE, or of the previously established connections between them, is accompanied by the disruptions in scales and natural velocities of geological processes taking place in the surroundings.
GE is a major accumulator (repository) of polluting substances (radionuclides, heavy-metals, toxic organic compounds), which appear within wastewater effluents and atmospheric emissions.
Underground and open cast mining, construction of features, creation of powerful technogenic fields of physical and chemical nature resulted in irreversible changes in GE which produced either the disruptions of dynamics of natural processes or the appearance of hazardous technogenic processes. GE in its development interacts with adjacent associated systems of natural surroundings (atmosphere, hydrosphere, biosphere) and actively influences the formation of ecological situations.
These circumstances determine the necessity of studying and mapping of the current status and changes of the GE under the conditions of enhance economic development of Ukraine’s territory.
Ukraine is characterized, on the one hand, by the intensive grows of industry and agriculture, and on the other hand, high density of the population. As a result, technogenic impacts on GE and inherent physical, chemical and energy related processes are from 5 to 15 times greater then those in the neighbouring countries.
A steady deterioration of the environmental parameters of GE, and associated natural media is formed under the influence on the atmosphere, soils, surface and groundwater of 10-12 million tons of various substances emitted by
131
F. Brechignac and G. Desmet (eds.), Equidosimetry, 131–146.
© 2005 Springer. Printed in the Netherlands.
132
industries and power plants, alongside with up to 18 million tons of mineral fertilizers, 190 thousand tons of pesticides and dozens of million tons of industrial liquid effluents.
Within the greater part of major industrial urban agglomerations (IUA) and their outskirts, considerable areas were identified where soils are polluted by toxic heavy metals with concentrations substantially exceeding maximum permissible concentrations (Kyiv, Dnipropetrovsk, Dniprodserzhinsk, Gherkasy, Odesa, Chernivtsi, Donetsk, Gorlivka, Lysychansk, Marioupol, KrasnoperekopskoArmyansky industrial area etc.).
Ukraine’s GE became a recipient of all atmospheric, solid and liquid radionuclide emissions end effluents of the Chernobyl NPP accident. In substantial areas, the pollution of landscapes soils and flora by long-lived, isotopes such as Cs137, Sr-90, Pu -239, 240 was dozens of times greater than the 1963 after-bomb background. As a result, a new nuclear-radiogeochemical province was formed which spreads beyond Ukraine's territory. The long-term radioecological influence of the Chernobyl NPP accident includes:
- a steady and often increasing (due to the decay and redistribution of emitted substances) pollution of upper zone, primarily soils, and subsequently agricultural producers by the radionuclides;
-a high level of risk of their stable penetration into the bottom sediments and the surface runoff of Dnipro river whose water resources are used to supply water to 35 million people (70% of Ukraine's population).
According to the estimates of the Ukrainian State Committee on Geology and the Mineral Recourses and Ukrainian Academy of Sciences, in a number of Ukraine's areas the aggregate negative influence of atmospheric emissions and water effluents on the quality of water resources is dozens of times greater than the maximum permissible concentrations and standards of the protective properties of soils in aeration zone. This led to the development of hundreds hotbeds of actual or potential pollution of ground waters which are regarded as the basic and the most stable source of drinking and technical water supply (Lysychansk, Dnipropetrovsk, Donetsk and other regions, Crimean republic). More than 10% of Ukraine’s speculative ground water resources are polluted to a various extent, whereas surface water sources are irreversibly polluted.
Over the last decade chemical soil cultivation became a powerful factor of regional deterioration of the ecological geochemical situation, giving rise to a long term and steady nitrate and pesticide penetration into groundwater in all Ukraine’s regions. Furthermore, the penetration depth increased from dozens to hundreds meters. Substantial GS changes are taking place under the influence of major engineering systems (Kiev, Dnipropetrovsk, Odessa, Kharkiv etc.), and TerritorialIndustrial Complexes (TIC) such as Donbas, Kryvbas etc.
A large scale equilibrium disturbance in the upper rock zone under the influence of mining, industrial and civil construction, land reclamation, extensive regulation of the surface runoff (28 thousand artificial water storages and ponds were built on the surface of 13000 km2), with the accumulation of large water masses, led to stirring up exogenic geological processes (EGP) including hazardous ones: landslides, carst, phreatic rise, subsidence etc. Some EGP’s are
133
able to accelerate the regional migration of the radionuclides (phreatic rise or technogenic floodings, erosion etc.)
The steady and growing technogenic changes of GE and subsequent deterioration of geological situation necessitate further studying and predicting negative processes in GE in order to provide in advance relevant geologicalecological information to the branches of national economy and to the environment protection entities so that they could plan and implement adequate measures aimed at rational utilization of natural resources, safe location of nuclear power plants and industrial facilities, residential areas etc.
2. Regional technogenic dynamics of the landscape geochemical situation in Ukraine
Practically fifty years after World War II Ukraine was the more developed part of the Soviet Union (SU). Occupying only 3% of SU territory Ukraine had produced about 21-23% of the Total National product (TNP). This was meaning the huge load on all the elements of the environments: surface water objects, biosphere and soil - upper part of the geological environment.
Large-scale development of the agriculture, metallurgical, chemical, built, energetic branches of industry was the base for active ploughing of the landscapes, backwatering of the rivers, active mining of raw mineral materials.
Practically till 1990 Ukrainian economy annually produced about 25 billion cubic m of the polluted water, two billion tons solid wastes (mainly raw mineral materials) and 10-12 million tons air exhausts.
Besides about 12-14 million tons of fertilizers and 160-180 thousands tons pesticides were used within Ukrainian territory (mainly on the territory Dnieper river basin).
To the end of the 20th century Ukrainian territory as the ecological system had the next regional natural-technogenic ecological parameters:
-total backwatering of the large, middle, and small rivers - about 28.5 thousand ponds and water reservoirs with the average groundwater level backwater from the 2-3 till 6-10 metres in the Dnieper’s valley;
-destroying of the natural geochemical landscapes due to ploughing, fertilizing (about 70% of Ukrainian territory), air exhaust accumulation and water irrigation with the contaminated river water;
-extracting of the huge volumes of the raw mineral resources within mining
industrial centres (Donbass, Krivoy Rog, Carpathian region etc.-50 billion tons within 20000 km2);
-creation of the geochemical contaminated zones around industrial - urban agglomerations due to influence of the air exhausts, pouring of the wastewater and accumulation of the solid wastes.
That is why the Chernobyl accident radionuclide exhausts in the subsurface air and surface water were the additional regional source of the landscape (first of all ploughed lands) contamination within about 20% of Ukrainian territory (so-called western and southern tracers). Upper zone of the geological environment including the soils and bottom sediments in the water reservoirs were the main “depot” for the accidental radionuclides.
134
3. Evaluation of radioactive influence on the Chernobyl accident on geological environment
The Chernobyl accident resulted in a substantial deterioration of ecological parameters of GF due to the blow-out of a wide range of radionuclides including long-lived ones:
caesium-137, strontium-90, plutonium-239 and others. The long-term radioecological influence of the NPP accident provoked a stable and steadily increasing pollution of the upper GE zone, primarily soils. The process accelerates with the physical decomposition of radioactive elements leading to the increased mobility of released products. There is also a high degree of risk of a stable radionuclide migration into bottom sediments and the surface runoff of the Dnieper river whose resources provide water supplies for 35 million people.
The extreme contamination of GE took place in zones of the western and southern plumes radioactive nuclide active airborne migration. Environmentally significant soil pollution (evaluated as 10 times greater than the radioactive background value before the accident, or about 0,5 Ci/km2 for caesium-137) was registered over the surface of nearly 120000 km2. As a result, approximately 20% of Ukrainian territories have a long-term base for emergence of low-level radiation.
The heaviest pollution with caesium-137 as to the affected area and concentration levels was registered in soils of Kyiv province (up to 15 Ci/km and more), Zhytomyr province (from 1 to 5 Ci/km), and Rivne province (over 1 Ci/km2).
The following levels of soil pollution with caesium-l37 in Ukraine have been identified:
Concentration
1 - 5 Ci /km2 |
40.5 thousand km2 |
5-15 Ci /km2 |
5.1 thousand km2 |
15-40 Ci /km2 |
1.1 thousand km2 |
40 Ci /km2 and more 0.8 thousand km2
The soils polluted with strontium-90 ranging from 0.05 to 0.5 Ci/km2 practically coincide with areas affected by caesium-137. The strontium-polluted area is negligibly larger in the eastern direction. The sites with a strontium-90 pollution greater than 0.5 Ci/km2 have been registered only in Kiev province, in the vicinity of the Chernobyl NPP.
In 18 provinces, isolated sites were detected with abnormally high plutonium-239, 240 concentrations in soils. The maximum number of such sites was registered in Chernigiv region. The concentration of plutonium ranges from 0.002 + 0.08 Ci /km2. In Southern Ukraine, the radioactive environmental situation is being increasingly influenced by radioactive nuclides migration with bottom sediments in water storages of Dnipro river cascade. Another factor of influence is the penetration of radioactive nuclides into irrigated areas as well as into potable water supply and distribution systems. In Kiev water storage reservoir, cesium-137 reserves amount to 8000 Ci, whereas in Kaniv reservoir they are equal to 2400 Ci.