

brechignac_f_desmet_g_eds_equidosimetry_ecological_standardi
.pdf91
Fig. 4. Combined effect of two stressors on experiment Nicotiana tabacum plants.
1 – intact control plant; 2 – virus-infected plant grown in non-polluted soil; 3 – noninfected plant grown in heavy metal polluted soil; 4 – virus-infected plant grown in heavy metal polluted soil.
Following assessment of plant virus distribution in human-polluted areas will allow to construct a map of plant virus and sanitary state for areas exposed to biological risk, and then to develop a program prognosing the arising of plant diseases of important agricultural crops. In case of remediation of contaminated area soils it could be a serious problem due to the absence of any phytovirus control on this territory for 12 years. Therefore, viruses can be used as an indicative model for evaluation of general changes in the environment.
4.Conclusions
1.Level of virus contamination of plants correlates with the level of pollution of the same area. This fact does not depend on the kind of pollution (radionuclide or heavy metal).
2.Combined effect of viruses and heavy metals provides more serious plant disease development and growth inhibition than in case of every single factor’s influence (synergy).
3.Viruses can be used as an indicative model for evaluation of general changes in the environment.
5.References
1.Barcelo J., Poschenrieder Ch. Plant water relations as affected by heavy metal stress: a review // J.
Plant Nutr. -1990. -V.13, N.1. -pp.1-37.
2.Boyko A.L. Ecology of plant viruses / Kyiv. –Vischa Shcola. -1990. –167p. (In Russian).
3.Boyko A.L., Stepanyuk S.A., Garifulin O.M. Obtaining and analysis of provirus cDNA for C- fragment of TMV CP for plants isolates from radioactively polluted Ukrainian region // Biopolymers and Cell. -1996. –V.12, N.6. –pp.112-115 (In Russian).
4.Clark M.F., Adams A.N. Characteristics of the microplate method of enzyme-linked immunosorbent assay for the detection of plant viruses // J. of Gen. Virol. -1977. -V.34. -pp.475- 483.
92
5.Foy C.D., Chaney R.L., White M.C. The physiology of metal toxicity in plants // Ann. Rev. Plant Physiol. -1978. –V.29. –pp.511-566.
6.Garmash N.U. Effect of increased doses of heavy metals on their accumulation in wheat and beans in ontogenesis // Physiology and biochem. of agricultural plants. -1989. – V.21, N.2. -pp.141-146 (In Russian).
7.Kabbata-Pendias À., Pendias H. Trace elements in soils and plants / CRC press, Ink.- Boca Raton, Florida. -1986. -349p.
8.Kegler H., Spaar D. et al. Viruses in soil and ground water (review) // Arch. Phytopath. Pflanz. - 1995. - N.29. -pp.349-371.
9.Methods in molecular biology. ELISA: theory and practice. Ed. by Crowther J.R. / Humana Press. -1995. -223p.
10.Peterson P.J. Adaptation to toxic metals // Metals and micronutrients: uptake and utilisation by plants / Ed. D.A.Robb, W.S.Pierpoint. –New York: Academic Press. -1983. –pp.51-69.
11.Polischuk V.P., Senchugova N.A., Budzanivska I.G., Holovenko O.L., Boyko A.L. Monitoring and strategy in virus diseases’ prognosing for agricultural plants in various agrocenoses of Ukraine // DAN. -1998. –N.2. –pp.184-187 (In Ukrainian).
12.Rauser W.E., Dumbroff E.B. Effects of excess cobalt, nickel and zinc on the water relations of Phaseolus vulgaris // Env. Exp. Bot. -1981. –V.21, N.2. –pp.249-255.
13.Stiborova M., Doubravova M., Brezinova A., Friedrich A. Effect of heavy metal ions on growth and biochemical characteristics of photosynthesis of barley (Hordeum vulgare) // Photosynthetica. -1986. –V.20, N.4. –pp.418-425.
14.Weckx J., Clijsters H. Heavy metals induce oxidative stress // Physiol. Plant. -1992. –V.85, N.3, Pt.2. –p.73.
SPECIES DIVERSITY AS A FACTOR OF RADIOSTABILITY OF ALGAL CENOSIS
N.L. SHEVTSOVA, L.I. YABLONSKAY
Institute of Hydrobiology, NASU, Prosp.Geroyev Stalingrada, 12, Kyiv,UA04210, UKRAINE
1. Introduction
Anthropogenic contamination of the environment became the determinant factor of destabilization of both terrestrial and aquatic ecosystems. The problem of resistance and flexibility, not only of biosystems of different levels of organization and evolutionary development, but also of ecological alignments under deteriorative conditions of the environment is one of the important issues in modern ecology.
Resistance as a whole, and radioresistance particularly – the main integral index of structural and functional status of biosystems or ecosystems (cenoses, populations), characterizes their ability to withstand to external extreme factors to the habitat.
Owing to structural hierarchy of vital systems each level of organization is interconnected.A higher level is apt to regulate deviations of a lower one by feedback, andvice-versa. Alterations at cellular level can lead to alterations in a population, cenoses etc levels and vice versa. Therefore it is logical to assume that species diversity may be one of the ecological protections (preservatives is something that is used for preventing to making babies) for stability.
2. Role of species diversity and richness in model algaecenoses stability under gamma-irradiation
An appropriate model for testing such an assumption can be the model of cenosis of fresh-water planctonic algae, which offers some advantages.
ξ The possibility of maintainingof the algal collection in laboratory conditions for a rather long time, practically without damage to specific and qualitative structure;
ξ easy access and determination of structural cenosis indexes – cell number abundance and species richness (number of species, their dynamics ratio, other different specific indexes);
ξ well studied radiosensitivity of fresh-water planctonic algae in culture
Algal samples were collected from the Dnieper river near Kiev at different seasonal periods. The mixes of different species numbers were selected (Table 1) for series of experiments. In all cases predominant were the Protococcales Scenedesmus quadricauda, Sc. quadricauda v. vesiculosus, Sc. quadricauda v. africanus, Sc. acuminatus, Sc. acuminatus v. tetradesmoides, Sc. acuminatus v. biseriatus, Sc. acuminatus v. elongatus, Sc. bijugatus, Sc. obliquus, Sc. protuberans, Sc. costatus, Sc. apiculatus, Coelastrum microporum, C. sphaericum, Tetrastrum punctatum, T. glabrum, T. staurogeniforne, Tetraedon incus, Pediastrum duplex, P. duplex v. cornutum, P. boryanum, P. kawraiskyi, Dictyosphaerium pulchellum, Didymocystis planctonica, Ankistrodesmus acicularis, Francia tenuispina, Ankistrodesmus pseudomirabilus v. spiralis, Golenkinia radiata, and Kirchneriella irregularis.
93
F.Brechignac and G. Desmet (eds.), Equidosimetry,93–97.
©2005 Springer. Printed in the Netherlands.
94
Table 1. Outline characteristic of model algaecenosis structure
Total number |
Dominant species (nominator, |
Main |
of species |
in abundance; decrease order) |
groups ratio |
|
|
1/2/3, % |
25 |
Sc.quadricauda |
100/0/0 |
|
Sc.acuminatus |
|
|
Coelastrum microporum |
|
|
|
|
30 |
Sc.quadricauda |
100/0/0 |
|
Sc.acuminatus |
|
|
Didymocystis planctonica |
|
|
|
|
53 |
Sc.quadricauda |
85/11/4 |
|
Sc.acuminatus |
|
|
Coelastrum microporum |
|
|
|
|
68 |
Sc.quadricauda |
80/17/3 |
|
Sc.acuminatus |
|
|
Ankistrodesmus |
|
|
pseudomorabilis |
|
77 |
Sc.quadricauda |
82/13/5 |
|
Sc.acuminatus |
|
|
Coelastrum microporum |
|
|
|
|
Note: Main groups of algae (divisions) 1 – Chlorophyta, 2 –
Bacilariophyta, 3 – Cyanophyta.
The algae were cultivated in Fitzgerald medium No. 11 [1]. Irradiation was produced by gamma rays of 60Co in a UK-250000 apparatus at absorbed doses between 1 and 105 Gy at different exposure rates (Table 2).
Table 2. Dose and power range in experiment
Radiation |
|
2.5 |
5 |
10 |
50 |
250 |
500 |
1000 |
5000 |
10000 |
20 000 |
absorbed |
1 |
||||||||||
dose, Gy |
|
|
|
|
|
|
|
|
|
|
|
Exposure |
|
|
|
|
|
|
|
|
|
|
|
rate, |
1.5 |
1.5 |
1.5 |
1.5 |
15 |
153 |
153 |
326 |
326 |
326 |
326 |
mGy/sec1 |
|
|
|
|
|
|
|
|
|
|
|
A 5-day-old synchronized suspension mixed cultures was irradiated. Synchronization was induced by means of a succession of dark and light phases [2]. After irradiation, the culture was inoculated into fresh liquid medium in 1:5 proportions (density before inoculation 1-106 cells/ml) and exposed to light and dark phases of 8 and 16 h respectively. The cultivation temperature was 20-22°C. The survival rate was determined as the ratio of the number of cells in the irradiated version to the number in the control, which was taken as 100%. In both cases, the cells were counted
95
simultaneously in a Goryayev chamber [1]; numbers of species were also determined. Index of species richness was calculated by formula:
di= Si/Ni [3] ,
here di - index of species richness; Si - species number in i-variant; Ni – medium cells numerous in i-variant
Diversity index – S%= (Si/Sn)ξ100% [4]
Si – species amount in i-variant; Sn - species amount in basic polyculture; S% - index of diversity
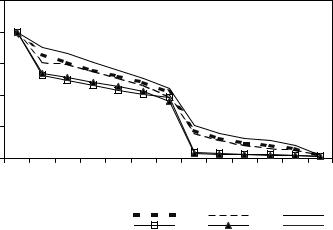
The survival curves of the protococcal algae (Fig. 1) show a pronounced, consistent plateau at doses between 1 and 50 Gy and decline at doses between 50 and 20,000 Gy. The presence of these segments indicates that postirradiation recovery occurs in the model cenosis and that some of the cells have elevated radioresistance. The survival rate corresponding to the beginning of the radioresistant segment of the curve depends on the state of development of modal algal cenosis. Maximum radioactive injury was observed at 15-20 days – logarithmic stage of the algaecenosis development. It was expected relevant number of species corresponded to medium injury range (Fig.1).
|
125 |
|
|
|
|
|
|
|
|
|
|
|
|
|
of control |
100 |
|
|
|
|
|
|
|
|
|
|
|
|
|
75 |
|
|
|
|
|
|
|
|
|
|
|
|
|
|
rate, % |
|
|
|
|
|
|
|
|
|
|
|
|
|
|
50 |
|
|
|
|
|
|
|
|
|
|
|
|
|
|
Survival |
25 |
|
|
|
|
|
|
|
|
|
|
|
|
|
|
|
|
|
|
|
|
|
|
|
|
|
|
|
|
|
0 |
|
|
|
|
|
|
|
|
|
|
|
|
|
|
0 |
2,5 |
5 |
10 |
50 |
100 |
250 |
500 |
1000 |
2500 |
5000 |
|
000 |
20000 |
|
|
|
10 |
|||||||||||
|
Absorbed radiation |
dose, Gy |
||||||||||||
|
|
|
1 |
|
|
2 |
|
|
3 |
|||||
|
|
|
|
|
|
|
|
|
|
|
|
|||
|
|
|
|
|
|
|
|
4 |
|
|
5 |
|
|
|
Fig.1 Survival rate of cells of model algaecenosis with different number of species after gamma-irradiation as a function of dose; Number of species in model cenoses:1 25; 2 - 30; 3-53; 4 –68; 5 – 77.
This was a model algaecenosis with medium numbers of species – 30 - among the tested ones. Due to high species level competitive exclusion the maximum injury was observed for model algaecenosis with 50-70 number of species.
Changes in the dominant species complex were observed. Over the range of absorbed dose of gamma-radiation 1-50 Gy Scenedesmus quadricauda - the dominant species of basic polyculture and control stay the monodominant. But under the doses of 250, 500, 1000, 2000 such subdominant as acuminatus var .biseriatus appeared. Under the highest doses as 5.000, 10.000, 20.000 Gy Senedesmus quadricauda was the monodominant species.
96
Over the range of absorbed radiation dose below or equal to LD50 (= 250 Gy for all examine model cenosis) an increase of the indexes of species richness was observed (Tabl.3).
Table 3. Species richness index changes depend upon absorbed radiation dose
Radiation absorbed |
Species richness index on n-day after irridiation, % |
||||||
dose |
n=1 |
n=5 |
n=10 |
n=15 |
n=20 |
n=25 |
n=30 |
Control |
193 |
53 |
10 |
2 |
1 |
1 |
1 |
1 |
241 |
41 |
30 |
3 |
3 |
2 |
2 |
2.5 |
169 |
63 |
21 |
4 |
2 |
3 |
2 |
5 |
135 |
28 |
15 |
4 |
1 |
1 |
1 |
10 |
46 |
25 |
14 |
4 |
3 |
1 |
1 |
50 |
330 |
54 |
11 |
3 |
2 |
1 |
1 |
250 |
161 |
56 |
38 |
9 |
10 |
8 |
6 |
500 |
218 |
59 |
64 |
116 |
39 |
15 |
10 |
1000 |
304 |
84 |
81 |
45 |
75 |
20 |
15 |
5000 |
232 |
84 |
77 |
60 |
60 |
19 |
9 |
10 000 |
280 |
110 |
62 |
61 |
58 |
11 |
6 |
20 000 |
179 |
97 |
56 |
62 |
74 |
23 |
15 |
(Note: data obtained for model algaecenosis of 30 species)
Orientation of richness index is evidence for the high intensity of the domination process in this dose range and the high level of competitive exclusion.
Within a dose range of 250-20000 Gy indexes of species richness of model algaecenosis were very high for most of the postradiation period. Only on 25th and 30th day the value of indexes decreased, but remained above the one in the control and other irradiated variants.
Table 4.Diversity index changes depend upon absorbed radiation dose
Radiation absorbed |
|
Diversity index on n-days after irridiation |
|||||
dose |
n=1 |
n=5 |
n=10 |
n=15 |
n=20 |
n=25 |
n=30 |
Control |
53 |
43 |
23 |
10 |
10 |
10 |
13 |
1 |
43 |
41 |
30 |
27 |
25 |
27 |
22 |
2.5 |
37 |
36 |
30 |
26 |
22 |
24 |
22 |
5 |
43 |
38 |
35 |
34 |
31 |
21 |
21 |
10 |
42 |
35 |
24 |
24 |
23 |
21 |
21 |
50 |
33 |
20 |
17 |
23 |
17 |
13 |
17 |
250 |
27 |
23 |
20 |
10 |
10 |
13 |
13 |
500 |
30 |
20 |
17 |
20 |
13 |
10 |
10 |
1000 |
30 |
27 |
20 |
17 |
17 |
13 |
13 |
5000 |
27 |
13 |
10 |
10 |
10 |
10 |
10 |
10 000 |
20 |
13 |
10 |
10 |
11 |
10 |
7 |
20 000 |
13 |
13 |
13 |
12 |
12 |
11 |
9 |
(Note: data obtained for model algaecenosis of 30 species)
By confrontation of the values from the tables 3 and 4 and from survival valuesit becomes understandable, that such a picture is labeled by a considerable decrease of mean number of cells of all species, while the number of species stay constant, above or at the level of the control. Such rather exotic situation has allowed to assume that
97
the increase of species richness and diversity is somehow brought aboutto lower (to reset) the oppressing effect of gamma-radiation and to increase the stability of a system. The hypothesis that species diversity increases stability of a system, was supported by Margalef (1968) " the Ecologist have seen the possibility of construction of feedback systems under a species diversity, measured any way" [3] McNaughton has suggested, that at a level of primary producers species diversity is a means of functional stability of the collection. We consider that the data of our experience testify for the promotion of the given hypothesis.
References
1.1975. Metody fiziologo-biokhimicheskogo issledovaniya vodorosley v gidrobiologicheskoy praktike (Methods of Physiological and Biochemical Investigation of Algae in Hydrobiology). Naukova dumka Press, Kiev.
2.Lorenzen, H. 1957. Synchrone Zeilteilung von Chlorella bein verschiedenen Licht-Dunkel-Wechzeln. Flora, 144, No. 4, pp. 473-496.[Rus.]
3.Odum E. P. 1986 Basic ecology, 2 Moscow “Mir”[Rus.]
4.Margalef R. 1968 Perspectives in Ecological Theory, Chicago, University of Chicago Press. 122 pp.
5.McNaughton S.J.,1978. Stability and diversity in grassland communities, Nature, 279, Pp.351-352
Part 3.
Radioecology and Ecotoxicology in General
Ecology
MODERN PROBLEMS OF ECOTOXICOLOGY
G. ARAPIS
Agricultural University of Athens
Iera Odos 75, Athens 11855, GREECE
1. Introduction
With the interest that scientists and the general public show today towards ecology and environmental protection, a number of new ecological branches are emerging, including ecotoxicology.
During the 1960s, 1970s, and 1980s scientists have acknowledged that nature is much more complex than previously thought. Not everything could be reduced to an experiment in the laboratory. Wolfram talked about irreducible systems, to which most biological systems belong, but required a synthesis of many laboratory experiments and/or observations in situ [1, 2].
Ecotoxicology belongs to one of the new sciences which emerged as a consequence of the adverse effects of pollution on complex natural systems. It has been acknowledged in this scientific discipline, that natural (and other) systems are so complex that it is impossible to reach an understanding of all the details of these systems. We have to accept that in the ecological sciences our description of natural systems and their processes will inevitably have a certain degree of uncertainty due to their enormous complexity.
Nevertheless, ecotoxicological research started in the 1960s attempting to reveal as many details as possible of the processing of toxic substances in the environment. This research proved to be extremely valuable as it was able to point towards some general rules and classification of the behaviour of toxic substances. It became, however, clear that the ultimate goals of ecotoxicological research, to determine all processes in nature for all toxic subtonics and pollutants of interest (there are probably about 100,000 chemical compounds used in such an amount that they could threaten the environment), would be comparable to the fate of Sisyphus.
Nowadays, the ecosystem as a whole starts is to be considered as a living, evolving and dynamic entity, and not simply a conglomeration of physical and biotic components. Appropriate examples are drawn from various species, populations, communities, and ecosystems to emphasise and explain the role of ecological factors and phenomena. Thus, at the level of organisms the effects and the way they adapt for example to temperature, moisture, light, photoperiod, ionising radiation, salinity, pH and toxicants are taken into account. At the population level, parameters such as growth, reproduction, mortality, spatial pattern, dispersal, migration and communication are important. At the community level, additional attributes such as diversity, competition, parasitism, predation, etc. are given. Finally, at the ecosystem level, the concepts of trophic levels and webs, nutrient cycles, maturity, succession, niche, stability, homeostasis, etc., are also taken into consideration.
101
F. Brechignac and G. Desmet (eds.), Equidosimetry, 101–109.
© 2005 Springer. Printed in the Netherlands.
102
2. A framework for ecotoxicology
Ecotoxicology can be simplified to the understanding of only three functions: Firstly, there is the interaction of the introduced toxicant, xenobiotic, with the environment. This interaction controls the amount of toxicant or the dose available to the biota. Secondly, the xenobiotic interacts with its site of action. The site of action is the particular protein or other biological molecule that interacts with the toxicant. Thirdly, the interaction of the xenobiotic with a site of action at the molecular level produces effects at higher levels of biological organisation. If ecotoxicologists could write appropriate functions that would describe the transfer of an effect from its interaction with a specific receptor molecule to the effects seen at the community level, it would be possible to accurately predict the effects of pollutants in the environment. We are far from a suitable understanding of these functions. Unfortunately, we do not clearly understand how the impacts seen at the population and community levels are propagated from molecular interactions [3].
Nevertheless, techniques have been derived to evaluate effects at each step from the introduction of a xenobiotic to the biosphere to the final series of effects. These techniques are not uniform for each class of toxicant, and mixtures are even more difficult to evaluate. Given this background however, it is possible to outline the current levels of biological interaction with a xenobiotic: Chemical and physicochemical characteristics, bioaccumulation/biotransformation/biodegrade-tion, site of action, biochemical monitoring, physiological and behavioural, population parameters, community parameters and ecosystem effects [3, 4].
Each level of organisation can be observed and examined at various degrees of resolution. The factors falling under each level are illustrated in the Figure 1. Examples of these factors at each level of biological organisation are given below.
2.1. CHEMICAL AND PHYSICOCHEMICAL CHARACTERISTICS
The contribution of the physicochemical characteristics of a compound to the observed toxicity is called quantitative structure activity relationships (QSAR).
It must be remembered that in most cases the interaction at a molecular level with a xenobiotic is happenstance. Often this interaction is a by-product of the usual physiological function of the particular biological site with some other low molecular weight compound that occurs in the normal metabolism of the organism. Xenobiotics often mimic these naturally occurring organisms, causing degradation and detoxification in some cases, and in others toxicity.
2.2. BIOACCUMULATION/BIOTRANSFORMATION/BIODEGRADATION
Bioaccumulation, which is the increase in concentration of a toxic substance in a tissue compared to the environment, often occurs with materials that are more soluble in lipid and organics (lipophilic) than in water (hydrophilic). Biotransformation is the process when compounds are transformed into other materials by the various metabolic systems that reduce or alter the toxicity of materials introduced to the body. Finally, biodegradation is the process that breaks down a xenobiotic into a simpler form.