

brechignac_f_desmet_g_eds_equidosimetry_ecological_standardi
.pdf189
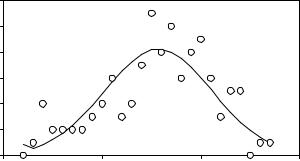
second survey area was the Brogger peninsula to the north-west of Ny Ålesund which has a similar geology (Carboniferous and Permian) to the mined area in Ny Ålesund but which is unaffected by coal wastes. The Brogger peninsula therefore acted as a control area. The results from these in situ surveys are shown as frequency distributions in Figure 1.
|
1,0 |
|
|
|
|
|
|
Ny Alesund |
|
|
|
|
|
|
|
|
|
||
Frequency |
0,8 |
|
|
|
|
|
|
Brogger |
|
0,6 |
|
|
|
|
|
|
|
|
|
|
|
|
|
|
|
|
|
|
|
Normalised |
0,4 |
|
|
|
|
|
|
|
|
0,2 |
|
|
|
|
|
|
|
|
|
|
0,0 |
|
|
|
|
|
|
|
|
|
300 |
400 |
500 |
600 |
700 |
800 |
900 |
1000 |
1100 |
|
|
|
|
Kerma Rate ( |
Gy y-1) |
|
|
|
|
|
|
|
|
|
|
Π |
|
|
|
Fig. 1. Frequency distributions of in situ kerma rate at Ny Ålesund and Brogger.
The frequency distributions of in situ kerma rate at both the Ny Ålesund and Brogger areas are approximately normally distributed. The arithmetic mean kerma rates were 714 µGy y-1 and 663 µGy y-1 for Ny Ålesund and Brogger, respectively. A twotailed t-test showed these means to be significantly different (p<0.001) which indicates that the presence of coal wastes at Ny Ålesund resulted in a generally higher kerma rate than in comparable non-contaminated areas. Though statistically significant, the difference between mean kerma rates in both areas is not dramatic. However, it is perhaps more informative to examine the maximum kerma rates observed in both areas which were 1040 µGy y-1 and 860 µGy y-1 for Ny Ålesund and Brogger, respectively. The highest kerma rates at Ny Ålesund were associated with areas in which combustion of coal had occurred, leaving behind coal ash deposits in which radionuclides were probably concentrated as indicated in Table 2. The maximum kerma rate recorded at Ny Ålesund could, in theory, lead to absorbed dose rates in excess of 1 mSv y-1 and is, therefore, of potential regulatory significance.
In July 1993, samples of soil and surface debris from another coal mining site in Spitsbergen (Sveagruva, in the Van Mijenfjord region) were obtained during an ecological survey of the area. These were subject to analysis by gamma ray spectrometry in the laboratory: gamma-emitting members of the uranium and thorium decay series were quantified and used to calculate in situ kerma rate using the dose conversion factors of Kocher and Sjoreen [6]. Kerma rate at a non-contaminated location, some 5 km to the west of Sveagruva on the northern shore of Van Mijenfjord, was calculated in the same way following analysis of soil samples, also collected in 1993, by gamma ray spectrometry.
190
Kerma rate (ΠGy y-1)
|
7 5 0 |
|
|
|
|
|
|
|
|
|
|
|
|
|
|
|
|
|
|
|
|
|
|
|
|
7 0 0 |
|
|
|
|
|
|
|
|
|
|
|
|
|
|
|
|
|
|
|
|
|
|
|
|
6 5 0 |
|
|
|
|
|
|
|
|
|
|
|
|
|
|
|
|
|
|
|
|
|
|
|
|
|
|
|
|
|
|
|
|
|
|
|
|
|
|
|
|
|
|
|
|
|
|
||
|
|
|
|
|
|
|
|
|
|
|
|
|
|
|
|
|
|
|
|
|
|
|
||
|
6 0 0 |
|
|
|
|
|
|
|
|
|
|
|
|
|
|
|
|
|
|
|
|
|
|
|
|
5 5 0 |
|
|
|
|
|
|
|
|
|
|
|
|
|
|
|
|
|
|
|
|
|
|
|
|
|
|
|
|
|
|
|
|
|
|
|
|
|
|
|
|
|
|
|
|
|
|
||
|
5 0 0 |
|
|
|
|
|
|
|
|
|
|
|
|
|
|
|
|
|
|
|
|
|
|
|
|
|
|
|
rd |
|
|
|
|
er |
|
|
|
|
|
a |
|
|
|
|
|
d |
|||
|
|
nfjo |
|
|
|
g |
|
|
|
uv |
|
|
|
un |
||||||||||
|
|
|
og |
|
|
|
r |
|
|
|
s |
|
|
|
||||||||||
|
ije |
|
|
|
Br |
|
|
|
|
aG |
|
|
|
|
Ale |
|
|
|
|
|
||||
an |
M |
|
|
|
|
|
|
|
|
|
ve |
|
|
|
|
y- |
|
|
|
|
|
|
||
|
|
|
|
|
|
|
|
|
|
S |
|
|
|
|
|
N |
|
|
|
|
|
|
|
|
V |
|
|
|
|
|
|
|
|
|
|
|
|
|
|
|
|
|
|
|
|
|
|
|
|
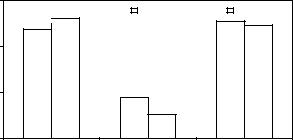
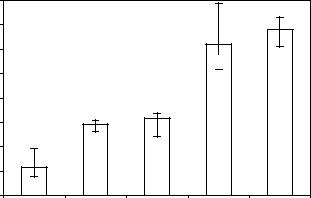
Fig. 2. Comparison of measured and calculated kerma rates at Ny Ålesund and Sveagruva coal mine sites together with their uncontaminated control areas, Brogger and Van Mijenfjord, respectively.
The kerma rates for Ny Ålesund and Sveagruva (measured and calculated, respectively) are shown in Figure 2 together with those of their uncontaminated control areas, Brogger and Van Mijenfjord (measured and calculated, respectively). At both coal mine sites the kerma rate is higher than that of the associated control area although the difference in kerma rate between Sveaguva and its associated control site (18%) is higher than that between Ny Ålesund and its control site (8%). The calculated kerma rate at Sveagruva is very similar to the mean measured kerma rate at Ny Ålesund, suggesting that the method of calculating in situ kerma rate from ex situ gamma ray spectrometry measurements of samples is reasonable. These results support the conclusion that the presence of coal waste materials has the potential to increase exposure of organisms to gamma radiation at coal mining sites.
Laboratory-based gamma ray spectrometry measurements of soil samples taken from Sveagruva and the Van Mijenfjord control area allow the relative contributions of individual radionuclides to the total kerma rates at each site to be determined. Figure 3 shows the contribution to the total kerma rate of uranium and thorium daughters, 137Cs and 40K.
Kerma rate (ΠGy y-1)
1 0 0 0
V a n M ije n fjo rd |
S v e a G ru v a |
1 0 0
1 0
1
U /T h |
1 3 7 C s |
4 0 K |
Fig. 3. Contribution to kerma rates at Sveagruva and Van Mijenfjord of uranium and thorium daughters (208Tl, 210Pb, 212Pb, 214Pb, 214Bi, 226Ra and 228Ac summed),
137Cs (derived from atmospheric weapons testing) and 40K.
191
On average, 40K made the largest individual contribution (49%) to the total kerma rates, while 137Cs contributed less than 1%. This is of particular interest since it is generally accepted that ‘radiocaesium is the most important anthropogenic radionuclide from a human-health perspective’ [1]. This suggests that, in general, exposure to naturally occurring radionuclides is likely to be more significant than exposure to anthropogenic radionuclides in the Arctic. Figure 3 shows that uranium and thorium daughters, combined, contributed a total of approximately 50% to the total kerma rates, though this contribution was almost twice as high at Sveagruva, where coal wastes were present, than at the Van Mijenfjord control site.
4. Concentrations of radionuclides and other carcinogens at coal mine sites
As part of the ecological survey carried out at Sveagruva in 1993, soil samples were taken from 113 sampling points in and around an area containing substantial deposits of coal wastes. These samples were subjected to a multi-element analysis by ICP-AES which yielded the frequency distributions for potassium and arsenic concentrations in soil shown in Figures 4 and 5.
|
12 |
|
|
|
|
10 |
|
|
|
Frequency |
8 |
|
|
|
6 |
|
|
|
|
4 |
|
|
|
|
|
|
|
|
|
|
2 |
|
|
|
|
0 |
|
|
|
|
0 |
5000 |
10000 |
15000 |
|
|
|
[K] (mg kg-1) |
|
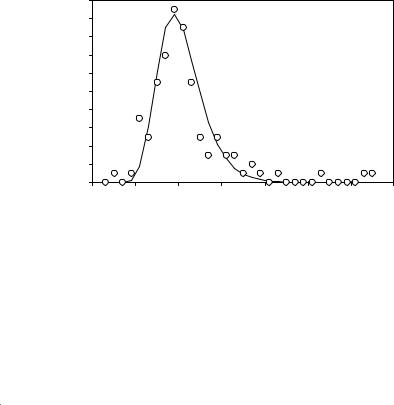
Fig. 4. Frequency distribution of non-radioactive potassium (39K) in 113 soil samples at Sveagruva. The solid curve is an idealised normal distribution with arithmetic mean =7584 mg kg-1 and arithmetic standard deviation =2732 mg kg-1.
Potassium is a naturally abundant element which displays an approximately normal frequency distribution. Assuming a natural abundance of 1.18 × 10⁻⁴ for 40K, an arithmetic mean and range of 40K activity concentrations in the Sveagruva soils can be calculated based on the frequency distribution for 39K, as shown in Table 3. Also shown in Table 3 are the ranges of concentrations for 137Cs, 226Ra and 75As (non-radioactive arsenic) determined directly in Sveagruva soil
samples. Complete frequency distributions of soil concentrations were not obtained for 137Cs and 226Ra because of the length of time needed for low-level gamma ray
spectrometry analyses. The ranges of concentrations presented for these radionuclides are based on a small number of selected samples. The activity
192
concentrations for 137Cs are equivalent to deposition densities of 0.97-13.9 kBq m-2 which can be compared with the range of 137Cs deposition densities of 1 - 5 kBq m-2 estimated by AMAP for Spitsbergen [2].
|
20 |
|
|
|
|
|
|
|
|
18 |
|
|
|
|
|
|
|
|
16 |
|
|
|
|
|
|
|
Frequency |
14 |
|
|
|
|
|
|
|
12 |
|
|
|
|
|
|
|
|
10 |
|
|
|
|
|
|
|
|
8 |
|
|
|
|
|
|
|
|
|
6 |
|
|
|
|
|
|
|
|
4 |
|
|
|
|
|
|
|
|
2 |
|
|
|
|
|
|
|
|
0 |
|
|
|
|
|
|
|
|
0 |
10 |
20 |
30 |
40 |
50 |
60 |
70 |
|
|
|
|
[As] (mg kg-1) |
|
|
|
|
Fig. 5. Frequency distribution of arsenic ( 75As) in 113 soil samples at Sveagruva. The solid curve is an idealised log-normal distribution with geometric mean = 19.1 mg kg-1 and geometric standard deviation = 1.3 mg kg-1.
Table 3. Concentrations of potassium (stable and radioactive), 137Cs, 226Ra and 75As (non-radioactive arsenic) in soil samples obtained from Sveagruva in 1993. PAH concentrations are extreme values for surface sediments in and around Spitsbergen obtained from [2].
|
39K |
40K |
137Cs* |
|
226Ra |
|
75As |
PAH |
Maximum |
13100 |
400.4 |
31.0 |
|
7.3 |
|
63.4 |
50 |
Mean |
7584 |
232.0 |
- |
|
- |
|
19.1 |
- |
Minimum |
1100 |
33.6 |
2.2 |
|
2.5 |
|
3.8 |
0.1 |
|
mg kg-1 |
Bq kg-1 |
Bq kg-1 |
Bq kg-1 |
mg kg-1 |
mg kg-1 |
||
The log-normal distribution for arsenic is typical for many soil contaminants and indicates that high concentrations, potentially representing a high exposure risk, can be found in a relatively small proportion of the area sampled. The same type of distribution is also likely to apply to substances such as PAH. The values in Table 3, however, are the extreme concentrations (maximum and minimum) of PAH in surface sediment in and around Spitsbergen taken from [2]. Direct analysis of samples taken from a site such as Sveagruva is required to verify the applicability of these values to coal mine sites, but the range of PAH values has been inserted in Table 3 for inclusion in the comparative exposure and risk analysis developed in section 5.
193
5. Comparing environmental exposure risks for radioactive and non-radioactive carcinogens
Assessment of the risks of human exposure to radioactive substances in the environment follows a well-known and accepted procedure, as described by Thorne [7].
Identify comparable exposure pathway (e.g. soil ingestion)
Calculate exposure rates
Bq y-1
Dose/intake
Sv Bq-1
Sv y-1
Risk factor Sv-1
mg kg-1 d-1
Slope factor 1/(mg kg-1 d-1)
RISK (y-1 or lifetime-1)
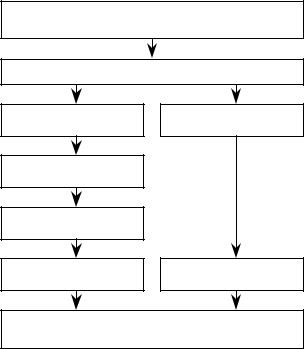
Fig. 6. Flow chart showing comparative calculations of risk posed by radioactive (left) and non-radioactive (right) carcinogens via common exposure pathways.
Exposure pathways are first identified then exposure via these pathways quantified, either by measurement, modelling or a combination of these. Estimates of human exposure to radionuclides are usually converted to estimates of radiation dose by using an appropriate dose conversion factor, such as the dose-per-unit- intake conversion coefficients (Sv Bq-1) published by IAEA [8] for ingestion and inhalation pathways. Finally, for low-level radiation exposures a dose-to-risk conversion factor (Sv-1) can be applied to provide an estimate of the fatal cancer risk associated with the exposure scenario being considered. For stochastic (low dose) effects, ICRP [9] has recommended values of 0.04 Sv-1 for workers and 0.05 Sv-1 for the public. This risk assessment process is represented by the series of linked boxes on the left hand side of Figure 6.
For non-radioactive carcinogens a similar process can be applied, as shown by the linked boxes on the right hand side of Figure 6. In common with the assessment of radionuclide exposure, exposure to a non-radioactive carcinogen must first be calculated following identification of an exposure pathway. Exposures

194
to non-radioactive carcinogens are usually expressed as a daily rate normalized to an individual’s body weight (i.e. mg substance kg-1 body weight d-1). For prolonged daily exposures throughout an individual’s lifetime, risk conversion factors (‘slope factors’) have been proposed by organizations such as the US Environmental Protection Agency (EPA). These slope factors approximate the 95% confidence limit on the increased cancer risk from a lifetime exposure to the substance of concern. The slope factor is expressed in units of proportion (of a population) affected per mg kg-1 d-1 and should usually be applied in the low-dose region of the dose-response relationship, specifically for exposures corresponding to risks less than 10-2. Slope factors for inorganic arsenic and benzo-a-pyrene (a PAH) are given in Table 4.
Table 4. Slope factors for arsenic and benzo-a-pyrene obtained from the US EPA IRIS (Integrated Risk Information System) database (http://www.epa.gov/iris/). Slope factors for other PAH compounds such as anthracene and phenanthrene are not available from the IRIS database.
|
(mg kg-1 d-1)-1 |
As (inorganic) |
1.5 |
benzo-a-pyrene |
7.3 |
Many environmental exposure pathways are common to all types of contaminant and some are, at least conceptually, easy to quantify. A good example is the exposure to soil contaminants following the direct ingestion of soil. This is particularly relevant to children but applies also to adults. A study by Stanek and Calabrese [10] estimated that 50% of children ingested 13 mg of soil per day although the overall distribution of soil ingestion rates is log-normal and ‘extreme’ ingestion rates are possible. Such estimates can be used in a comparative analysis of exposure risks associated with multiple contaminants at sites such as the coal mines examined here. However, when considering arctic coal mines several caveats should be considered. First, due to the obvious climatic characteristics of arctic sites, which limit outdoor activities and result in snow cover for a large proportion of the year, the opportunities for direct exposure to soil are limited compared with more temperate latitudes. Secondly, the occupancy of the arctic regions is, in general, very low compared to temperate latitudes, although an increase in both permanent occupancy and tourism in Longyearbyen, the principal town of Spitsbergen and a former coal mining site, has occurred over the last decade. Furthermore, due to the very dry nature of the arctic in summer dust migration can be a particular problem and exposure to soil particles via this pathway may be significant.
195
Risk (y-1 or lifetime-1)
1,E-04
1,E-05
1,E-06
1,E-07
1,E-08
1,E-09
1,E-10
1,E-11
1,E-12
Cs-137 |
Ra-226 |
K-40 |
BaP |
As |
Soil Contaminant
Fig. 7. Comparative cancer risks for exposure to radioactive and non-radioactive carcinogens via soil ingestion at coal mines in Spitsbergen. The columns represent
risks calculated using best estimates of contaminant concentrations in soils taken from Table 3 (in the case of 137Cs, 226Ra and benzo-a-pyrene, BaP, this is the mid-
point between extreme values) while the bars represent risks calculated using extreme values of soil concentrations.
Following the scheme shown in Figure 6 a comparative risk assessment was performed based on the assumptions that soil ingestion at coal mine sites in Spitsbergen is a significant exposure pathway (13 mg d-1) and that the soils can be contaminated with the substances listed in Table 3 over the full range of concentrations indicated. For arsenic and PAH (benzo-a-pyrene) a constant daily exposure has been assumed while for radionuclides an ingestion period of 365 days has been assumed (in practice this might represent exposure over several years since, as stated above, the soil in arctic regions is only accessible for a small proportion of the year.
Even though the results of this assessment, shown in Figure 7, are based on several assumptions, they indicate that comparative risks associated with radioactive and non-radioactive contaminants in soils can be calculated using concepts and information which currently exist within the disciplines of radioecology and ecotoxicology. While the risks from each substance are generally very low it is the nonradioactive carcinogens which appear to pose a greater comparative risk. Substances such as benzo-a-pyrene pose potentially the highest risk though, due to the lack of sitespecific measurements of this and other PAH compounds, the uncertainty on this risk estimate is high and it should be considered to be purely exploratory. The 3 to 4 order of magnitude difference in risk estimates for arsenic and 40K is noteworthy, however, since these comparative estimates are based on actual measurements of each substance at the Sveagruva site. It is also significant that the risk associated with 137Cs, derived from global weapons fallout, is approximately two orders of magnitude lower than the risk associated with 40K, which is naturally occurring.
196
6. Conclusions
Coal mines, such as those which occur on the arctic island of Spitsbergen, provide potentially useful scenarios in which techniques can be developed for the assessment of comparative risks from simultaneous exposures to a mixture of environmental contaminants. Exposures to ionizing radiation can be enhanced at coal mine sites to a small but significant degree and there is the potential for relatively high exposure at a small number of locations where combustion of coal may have occurred. Of chief concern amongst non-radioactive contaminants of coal wastes are the carcinogens arsenic and the polycyclic aromatic hydrocarbons. Exposures to both these radioactive and non-radioactive contaminants can occur via common pathways such as soil ingestion. Following quantification of exposure via common routes such as soil ingestion, techniques and data currently exist to allow the calculation of the comparative risks associated with both types of contaminant. A scheme is proposed by which such comparative risks can be calculated and the results from an example calculation are presented. This example indicates that the lowest risks are associated with artificially derived (i.e. weapons fallout) radionuclides such as 137Cs while higher risks are to expected from naturally occurring radionuclides and from non-radioactive contaminants of coal wastes. It would be informative to extend the comparative use of radiation dose assessment methodology and slope factors for non-radioactive contaminants to examine the relative impacts and risks associated with the contamination of the environment in other areas where multiple pollution occurs.
7. Acknowledgements
This study would not have been possible without the kind permission of the Governor of Svalbard and of both the Kongs Bay KulCompanie (Ny Ålesund) and the Store Norske Spitsbergen KulCompanie (Sveagruva). The kind assistance of numerous members of the Arctic Research Group (UK) is also gratefully acknowledged.
8. References
1.AMAP (1997) Arctic Pollution Issues: A State of the Arctic Environment Report. Arctic Monitoring and Assessment Programme, P.O. Box 8100 Dep., N-0032 Oslo, Norway.
2.Crane, K. and J. L. Galasso (1999) Arctic environmental atlas. Office of Naval Research , Naval Research Laboratory, Washington DC, USA.
3.Låg, J. (1988) Soil pollution from coal mines in Svalbard. Saertryk av Jord og Myr, No. 6.
4.Låg, J. (1983) Soil pollution from mining waste material used as filling in Longyearbyen, Svalbard. Trykt i Jord og Myr, 6, 208 – 211.
5.Baxter, M. S. (1993) Environmental radioactivity: a perspective on industrial contributions. IAEA Bulletin, Quarterly Journal of the International Atomic Energy Agency, 35, 33 – 8.
6.Kocher, D. C. & A. L. Sjoreen (1985) Dose rate conversion factors for external exposure to photon emitters in soil. Health Physics, 48, 193 – 205.
7.Thorne, M. C. (2001) Assessing the radiological impact of releases of radionuclides to the environment. Pp. 391 – 446 in ‘Radioecology: radioactivity and ecosystems’, eds E. Van der Stricht and R. Kirchmann, ISBN 2-9600316-0-1.
8.IAEA (1996) International basic safety standards for protection against ionizing radiation and for the safety of radiation sources. Safety Series No. 115, IAEA, Vienna.
9.ICRP (1991) Recommendations of the International Commission on Radiological Protection. ICRP Publication 60, Annals of the ICRP 21, Nos. 1-3, 1991.
10.Stanek, E. J. & E. J. Calabrese (1995) Daily estimates of soil ingestion in children. Environmental Health Perspectives, 103, 276 – 285.
RISK DUE TO JOINT CHEMICAL AND RADIATION CONTAMINATION OF FOOD
V. GEORGIEVSKY
Russian Research Centre Kurchatov Institute, 1, Kurchatov sq., Moscow, RUSSIA
A. DVORZHAK
Institute of Mathematical Machines and Systems Problems NASU, Kiev, UKRAINE
1. Introduction
There is a well-known problem analysis of joint risk due to chemical and radiation impact to person. Only part of this problem will be considered concerning ingestion of food contaminated by both chemical and radiation pollutants.
The key difficulty in decision of this problem is necessity to estimate threshold and nonthreshold functions “dose-effect” in unified terms.
This problem is very important for Ukraine because only threshold “Maximum Permissible Concentration” (MPC) is used as chemical standard there [1].
In this paper it is considered the method of the approximation of the threshold criteria (MPC and Reference Doses [2]) by non-threshold criteria.
This method was used for estimation of chemical risk (due to lead, cadmium, copper, zinc, mercury, DDT in food), radiation risk (due to Cs-137, Sr-90 in food) and combined risk (due to chemical plus radiation contamination of food) for 10 regions (Vinnitska, Volinska, Zhitomirska, Sumska, Ternopilska, Khmelnitska, Kievska, Chernigivska, Cherkaska, Rivnenska) of Ukraine.
2. The basis
1.General principle of developing of the unified Index of Harm is based on the estimation of loss of lifetime for person (for example, ICRP Publication 45, [3]).
2.This principle may be taken as a basis for approximation of the threshold values MPC by non-threshold values. In toxicology the determination of MPC is based on the expert estimation of total harm from the chemical pollutants.
3.Methodology
Hypothesis
1.The values of MPC are standards which were limited both non-carcinogenic and carcinogenic effects;
2.It is possible to evaluate the harm from ingestion of any chemical pollutant in term of risk;
3.The ingestion of any chemical pollutant in quantity of MPC for this pollutant leads to the same risk.
4.Combined risk due to chemical and radiation pollutants in food is the sum of the radiation risk and the chemical risk (which is estimated below).
197
F. Brechignac and G. Desmet (eds.), Equidosimetry, 197–203.
© 2005 Springer. Printed in the Netherlands.
198
4. Method (chemical risk)
The method is the synthesis of methodology of MPC [1] and methodology of EPA (U.S. Environmental Protection Agency) [2]. It is used the information about slope factor from IRIS [4] for some chemical pollutants and the information about MPC for the same pollutants. The pseudo-slope-factors are introduced in this method. They are calculated on the base of approximation of threshold criteria by non-threshold criteria.
The following procedure is used.
Step 1.
The chemical pollutant from Integrated Risk Information System [4] is chosen as Reference Chemical Pollutant. This Reference Chemical Pollutant should have the slope factor and MPC.
Step 2.
Risk for person is estimated as if the person ingests the Reference Chemical Pollutant in quantity of its MPC. (The slope factor for Reference Chemical Pollutant is used for risk estimation).
Step 3.
It is considered any pollutant, which has MPC but does not have slope factor. It is supposed that risk for person from ingestion of this pollutant in quantity of its MPC equals to risk which is estimated in step 2.
Step 4.
It is introduced pseudo-slope-factor for pollutant in step 3 so risk, which is estimated by this pseudo-slope-factor, would be equal to risk in step 2.
Note: This procedure (step1 – step 4) may be repeated for several Reference Chemical Pollutants.
5. Data source
1.For above-mentioned regions of Ukraine the following data were used (1995, 1996): ξ Chemical pollutants (mg/kg): lead, cadmium, copper, zinc, mercury, DDT;
ξ Radiation pollutants (pCi/kg): Cs-137, Sr-90;
ξ type of food: potatoes, carrot, beet, cucumber, tomato, cabbage;
ξ the data of milk and meet contamination by both 137Cs and 90Sr for some regions.
2.The data are given for the separate farms.
3.The example of the averaged data (Kievska region) is indicated in the Table 1.