

Baumgarten
.pdf104 4 Modeling Spray and Mixture Formation
|
n |
|
|
6m2 |
|
, |
|
(4.59) |
|||
|
|
Sd23 Ul |
|
||||||||
|
2 |
|
|
|
|||||||
E |
|
n |
1 |
|
S |
d3 U v2 |
, |
(4.60) |
|||
|
|
6 |
|||||||||
|
kin2 |
2 2 |
|
2 |
l r2 |
|
|
||||
I2 2 arctan vr2 / vax , |
(4.61) |
||||||||||
where vax ū w. The ratio of both energies is unknown and must be modeled. It is
assumed that the ratio Ν= Eς2 /E2 or (1-Ν) = Ekin2 /E2 is only dependent on the cylinder pressure, because an increase of cylinder pressure results in a faster bubble
collapse combined with a higher collapse energy. The model gives reasonable results, if the calculation of the energy ratio Ν1bar for a cylinder pressure of 1 bar is performed first and the additional collapse energy due to the rise of pressure is completely added to the kinetic energy (spray angle),
ª |
|
|
1bar |
º |
|
|
|
EV 2 N1bar «Eturb2 |
|
|
|
|
Ecav2 » |
, |
(4.62) |
p |
|
( bar ) |
|||||
¬ |
|
chamber |
|
¼ |
|
|
|
where Ν1bar = 0.15. Although the angle Ι2 between the spray axis and the direction of the new droplets can now be determined, the velocity vector in the plane perpendicular to the spray axis must be modeled in order to specify the exact direction of droplet motion inside the 3D-spray cone, see Fig. 4.13. Because the thickness Lcav (Μ) of the cavitation zone directly effects the distribution of collapse energy, the probability P(Μ) that new droplets will be created at a certain positionΜ is assumed to be proportional to Lcav (Μ. The new droplets are assumed to
Fig. 4.13. 3D spray angle, example: asymmetric flow [14]
4.1 Primary Break-Up |
105 |
|
|
move radial outwards with velocity vr2. Altogether, this results in a larger spray divergence at the cavitation side. The model is thus capable of producing asymmetric primary sprays according to the nozzle hole flow. The high break-up energy per unit mass (high collapse energy, low density) results in small droplets and a large spray divergence near the nozzle. Consequently, zone 2 forms the outer spray region, which appears optically dense but does not contain much mass.
Break-up of the liquid zone: Outside the nozzle, zone 1 forms the extremely dense core in which energy is dissipated due to chaotic collision, break-up, and coalescence processes. The chaotic nature of these dissipation processes is modeled by using an efficiency Κ1, which is sampled randomly for each ligament between 0 and 1 and which reduces the effective break-up energy of zone 1 to E1,eff = Κ1E1. As in the model of Nishimura and Assanis [91], it is assumed that all breakup energy is present as turbulent kinetic energy the velocity fluctuations uturb = (2E1,eff /3m1) of which cause a disruptive turbulence force Fturb. Mass is split off the liquid cylinder of zone 1 until the surface tension force Fς is equal to Fturb:
F |
dynamic pressure surface area = |
Ul |
u2 |
d |
|
L , |
(4.63) |
|
|
||||||
turb |
|
2 turb |
|
eff |
|
|
|
|
FV 2V L deff . |
|
|
|
|
|
(4.64) |
The remaining cylinder with diameter
dcyl |
|
4V L |
(4.65) |
|
U u2 |
L 4V |
|||
|
l |
turb |
|
|
is transformed into a spherical drop, and its turbulent kinetic energy is used to determine its spray angle (radial velocity). The disintegration of the split mass into droplets with a velocity component normal to the main spray direction is modeled in the same way as for zone 2, but the direction Μ of the child parcel in the x-y- plane is sampled from a uniform distribution between 0° and 360°. Altogether this results in a symmetric full-cone spray (angle Ι1, Fig. 4.12). It forms the dense inner spray region with high momentum in the axial direction and is responsible for the spray characteristics in the far field of the nozzle. Because of the small breakup energy per unit mass, the average droplet diameter is larger and the spray angle is smaller than in zone 2.
Cavitation bubble dynamics: It is assumed that the bubbles leaving the nozzle experience a sudden rise in pressure from the vapor pressure pvap to the pressure pφ of the gas inside the chamber and that the bubbles collapse inside zone 2. In order to calculate the time-dependent development of the bubble radius R(t) during the collapse process, the equation of Herring [50] and Trilling [141] (see Prosperetti and Lezzi [108]),
106 4 Modeling Spray and Mixture Formation
§ |
|
|
|
|
|
|
|
3 § |
|
|
|
|
|
|||||
|
2R( t ) · |
|
|
|
|
4R( t ) · |
|
2 |
||||||||||
¨1 |
|
|
a |
¸R( t )R( t ) |
2 |
¨1 |
3a |
|
¸R( t ) |
|||||||||
© |
|
|
|
¹ |
|
|
|
|
© |
¹ |
|
(4.66) |
||||||
|
1 |
|
§ |
|
|
|
2ς |
|
4Π |
|
|
|
|
· |
|
|||
|
|
|
|
|
|
|
|
|
|
|||||||||
|
|
¨ |
p |
|
|
|
|
|
|
|
|
R( t ) p |
φ ¸ |
, |
|
|||
|
|
vap |
|
R( t ) |
|
R( t ) |
|
|
|
|
||||||||
|
Υφ © |
|
|
|
|
|
|
¹ |
|
|
||||||||
is used. The model also accounts for the effect of compressibility (accoustic approximation, a: average sound speed of zone 2) as well as surface tension ς and viscosity µ. R(t) is the bubble radius, R(t) and R(t) are the time-dependent velocity and acceleration of the bubble wall, and Υφ is the density of the fluid around the bubble (zone 2). The kinetic energy of the fluid surrounding the bubble can be estimated as (Knapp et al. [64]):
|
2 |
3 |
(4.67) |
E( t ) 2ΣΥφ R( t ) |
R( t ) . |
||
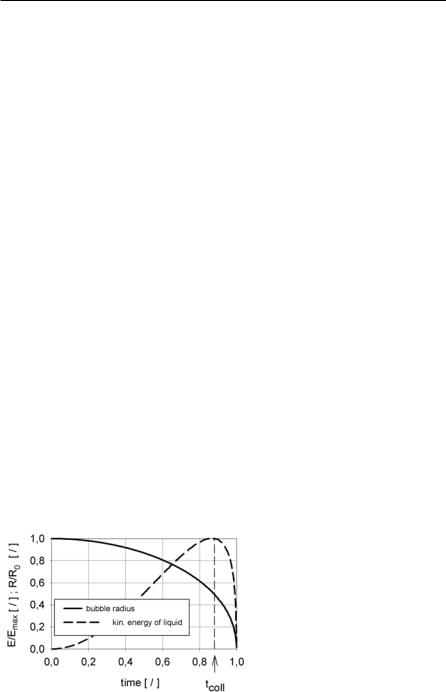
In Fig. 4.14 the curves of radius and kinetic energy for the collapse of a representative bubble are shown. The liquid surrounding the bubble is accelerated towards the bubble center, and the kinetic energy grows. At the end of the collapse, the liquid is decelerated again. The begin of deceleration is regarded as the break-up
time tcoll of the primary ligament, because from this time on the kinetic energy Emax of the collapse process is used for the disintegration process (formation of
droplets and radial velocity). Emax is the amount of energy that is released during the collapse of a single bubble.
Turbulence-modeling outside the nozzle: The turbulent kinetic energy k0 and the dissipation rate Η0 of each zone at the nozzle exit are known from the calculation of the nozzle flow. From the time the ligament leaves the nozzle until breakup, the turbulent kinetic energy is reduced by dissipation. The simplified (no diffusion and production) 0-dimensional k-Η model gives (see Sect. 4.1.3):
|
|
|
|
|
|
|
k0CH |
|
|
1 |
|
|
||||
k t |
§ |
|
|
|
|
|
|
|
|
· |
CH |
1 |
|
(4.68) |
||
¨ |
|
|
|
|
|
|
|
|
|
|
¸ |
|
. |
|||
H |
0 |
t |
|
C |
|
|
1 |
k |
|
|||||||
|
© |
|
|
H |
|
|
|
0 ¹ |
|
|
|
|
||||
Fig. 4.14. Bubble radius and kinetic energy during collapse
4.1 Primary Break-Up |
107 |
|
|
Using this equation, the actual values k(tcoll) and Eturb available for break-up are estimated.
Using their primary break-up model in combination with the Kelvin-Helmholtz model for secondary break-up, the authors have shown that experimentally observed asymmetric spray structures due to asymmetric nozzle hole flows as well as penetration, spray angle, and droplet sizes could be well predicted. Figs. 4.15 and 4.16 show the results for an asymmetric nozzle hole flow resulting in an asymmetric distribution of cavitation and liquid zone inside the primary ligament as shown in Fig. 4.13. Diesel fuel (rail pressure: 65 MPa) is injected in compressed air (5 MPa, 25°C).
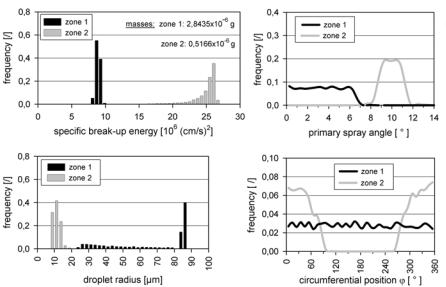
In Fig. 4.15, the results of a statistical analysis (frequency distribution) of the relevant primary break-up parameters during the disintegration of the primary ligaments are shown. As expected, zone 2 has the highest break-up energy per unit mass because of the collapse of cavitation bubbles and its low mass, Fig. 4.15a. This results in larger primary spray angles and smaller droplets compared to zone 1 (Figs. 4.15b and 4.15c). The frequency distribution of the formation of new droplets at different circumferential positions Μ in the x-y-plane, see also Fig. 4.13, is, as implied by the model, proportional to the thickness of the cavitation zone in case of zone 2, and equally distributed in case of zone 1, Fig. 4.15d. The combination of the diagrams gives the following picture of the 3D primary spray: zone 1 forms a dense full-cone spray consisting of big droplets (spray center). Zone 2 forms the outer spray region, whose asymmetry is directly dependent on the asymmetric distribution of the cavitation zone inside the nozzle holes.
b
a
c |
d |
Fig. 4.15. Statistical analysis of relevant parameters during primary break-up [12]
108 4 Modeling Spray and Mixture Formation
a |
b |
c
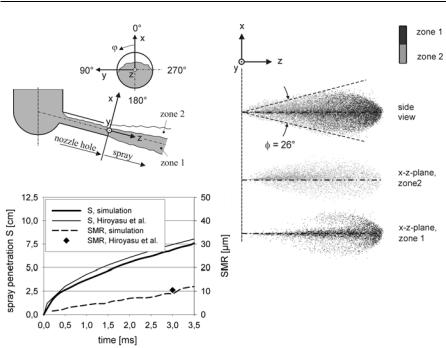
Fig. 4.16. Influence of the new primary break-up model on the dilute spray [12]
Figure 4.16 shows the influence of the primary break-up model on the dilute spray. In Fig. 4.16b two slices of the spray containing only droplets of zone 1 or only droplets of zone 2 are presented. As expected, the droplets of zone 2 lead to the strong and asymmetric spray divergence near the nozzle (main mass of zone 2 on the cavitation side), while zone 1 forms a symmetric spray with small divergence near the nozzle, which is responsible for the spray in the far field of the nozzle due to its high momentum (macroscopic spray angle, penetration). Global spray parameters like spray angle (Fig. 4.16b, side view), temporal development of spray penetration, and Sauter mean radius (SMR) (Fig. 4.16c) show feasible values compared to the ones estimated using the well-known correlations of Hiroyasu et al. [53]. The slight increase of SMR over time is a consequence of the collision model (droplet coalescence) and the low ambient temperatures.
The most important features of the primary break-up model of Baumgarten et al. [12, 13, 14] are the detailed consideration of cavitation, the close linking of nozzle hole flow and spray, and the ability to simulate the influence of asymmetric nozzle flows on the 3D spray structure. This model is well suited for the simulation of high-pressure diesel injection, but, similar to the model of von Berg et al. [143], a complete CFD simulation of the nozzle hole flow is needed as input data.
4.1 Primary Break-Up |
109 |
|
|
4.1.6 Sheet Atomization Model for Hollow-Cone Sprays
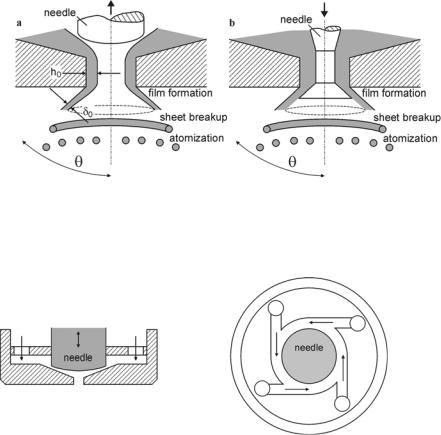
In direct injection spark ignition (DISI) engines, nozzles producing a hollow-cone spray are usually used in order to achieve maximum dispersion of the liquid phase at moderate injection pressures of about 5 to 10 MPa. Compared to the boundary conditions in the case of diesel engines, the backpressures and temperatures are small and the use of full-cone sprays would result in poor mixture formation and increased wall impingement. Hollow-cone sprays are typically characterized by small droplet diameters, effective fuel-air mixing, reduced penetration, and thus high atomization efficiencies. Fig. 4.17 shows two nozzle concepts, an inwardly opening pressure-swirl atomizer and an outwardly opening nozzle. In case the of a swirl-atomizer, the fuel passes through tangentially arranged swirl ports and gets a rotational motion inside the swirl chamber, Fig. 4.18. The centrifugal motion of the liquid forms a hollow air core.
Fig. 4.17. a Inwardly opening pressure-swirl atomizer, b outwardly opening nozzle
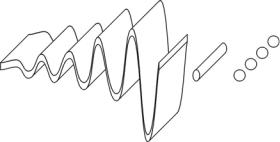
Fig. 4.18. Schematic illustration of the tangentially arranged swirl ports
110 4 Modeling Spray and Mixture Formation
Because the area of the swirl chamber reduces to a nozzle, the rotational motion is further increased. The liquid passes through the nozzle and forms a free coneshaped liquid sheet inside the combustion chamber, which becomes thinner because of the conservation of mass as it departs from the nozzle and subsequently disintegrates into droplets.
Schmidt et al. [125] have developed a model which is well suited to describe the primary break-up of hollow-cone sprays. First, a zero-dimensional approach is used to represent the internal injector flow and to determine the velocity Uinj at the nozzle hole exit. The rotational motion of the fuel inside the swirl chamber creates an air core surrounded by a liquid film, Fig. 4.17a, the thickness Γ0 of which is related to the mass flow rate by
m SUlu D G0 , |
(4.69) |
|
|
where u is the axial velocity component at the nozzle exit, D is the hole diameter at the exit, and m is the mass flow rate, which must be measured experimentally. The axial velocity component u is approximated using the approach of Han et al. [49]. It is assumed that the total velocity Uinj can be related to the injection pres-
sure p = prail - pback ,
Uinj |
Cd |
2'p |
, |
(4.70) |
|
||||
|
|
Ul |
|
|
where Cd is the discharge coefficient of the swirl injector. The value of Cd is derived by treating the swirl ports as nozzles, and by assuming that the major pressure drop through the injector occurs at the ports. Eq. 4.70 is then an expression for the coefficient of discharge for the swirl ports. Typical values of Cd for single phase nozzles with sharp inlet corners are 0,78 or less [76], depending on the amount of momentum loss due to friction and reduction of cross-sectional area. Cd must be less than one in order to conserve energy. On the other hand Cd must be large enough to conserve mass and to avoid the prediction of negative air core sizes. These restrictions are satisfied using the following expression for Cd :
|
|
|
|
|
|
½ |
|
|
° |
|
|
|
4m |
° |
|
||
Cd max ®0.7, |
|
|
|
¾ . |
(4.71) |
|||
S D2 U u |
||||||||
° |
|
|
° |
|
||||
¯ |
|
|
|
|
l |
¿ |
|
|
The axial velocity u is |
|
|
|
|
|
|
||
u U |
inj |
, |
|
(4.72) |
||||
|
cos T |
|
|
|||||
where Τ is the spray angle, which is assumed to be known. In the case of an outwardly opening nozzle, the sheet thickness at the nozzle orifice is equal to the size of the annular gap, and the injection velocity is determined from the conservation of mass.
In the near spray region, the transition from the injector flow to the fully developed spray is modeled as a three-step mechanism, see Figs. 4.17 and 4.19, consisting of film formation, sheet break-up, and, finally, disintegration into droplets.
4.1 Primary Break-Up |
111 |
|
|
Fig. 4.19. Break-up of the liquid sheet into ligaments and droplets
First, a liquid film with initial thickness h, spray angle Τ , axial velocity u, and total velocity Uinj is formed, which penetrates into the combustion chamber. The liquid sheet becomes thinner because of the conservation of mass as it departs from the nozzle. Further on, Kelvin-Helmholtz instabilities are assumed to develop and grow on the film surface resulting in a first break-up and in the formation of ring-shaped ligaments. These ligaments finally break up into droplets.
Schmidt et al. [125] have shown that when the film exits the injector as a free liquid sheet, the tangential velocity (which is present in the case of a swirl atomizer) is completely transformed into radial velocity, and the trajectory approaches a straight line. The angle Τ from the centerline is determined by the ratio of radial and axial velocity. Hence, at the point of film break-up and drop formation, the swirl velocity of the drops can be neglected. This is a very convenient approach because the swirl velocity at the nozzle orifice is usually unknown. Nevertheless, because the swirl velocity is responsible for the formation of the spray half-cone angle Τ, the spray cone angle must be known from experimental investigations in this case. Alternatively, the detailed liquid film movement model of Gavaises et al. [39] could be used at this point in order numerically to predict the spray angle, the reduction of the film thickness, and the decay of the swirl velocity during the film disintegration process.
The disintegration of the liquid film is modeled in direct analogy to the KelvinHelmholtz model for diesel sprays, see Sect. 4.2.4. The model, which is presented in detail in Senecal et al. [129], assumes that a two-dimensional, viscous and incompressible liquid sheet with thickness 2h moves with velocity U through a quiescent, inviscid, and incompressible gas. A spectrum of infinitesimal disturbances
K t R K0 exp>ikx Zt@ |
(4.73) |
is imposed on the sheet surface producing pressure and velocity fluctuations in both the liquid and the gas. The amplitudes of these disturbances grow due to the liquid-gas interaction. In Eq. 4.73, Κ0 is the initial wave amplitude, k = 2Σ/Ο is the wave number, and Ζ = Ζr + iΖi is the complex wave growth rate. It is assumed that the most unstable disturbance with growth rate Ζr = : causes sheet break-up. Hence, a dispersion relation Ζ = Ζ(k) is derived, from which the most unstable wave can be deduced. In ref. [45], it has been shown that two modes of film dis-
112 4 Modeling Spray and Mixture Formation
turbances exist, both of which satisfy the liquid-governing equations subject to the boundary conditions at the upper and lower interfaces of the sheet. In the case of the first mode (sinuous mode), the waves at both surfaces are exactly in phase, while in the case of the second mode (varicose mode), the waves are 180 degrees out of phase. Senecal et al. [129] have shown that the sinuous mode dominates the growth of the varicose waves for low velocities, and that both modes become indistinguishable for high flow velocities U. Hence, only the sinuous waves are regarded in the further analysis, resulting in the dispersion relation [129]
|
ª |
U |
l |
º |
ª |
|
|
|
U |
l |
|
|
º |
|
|
|
Z2 |
«tanh kh |
|
» « |
4Ql k2 tanh kh 2i |
|
kU |
» |
|
||||||||
|
|
Ug |
|
|||||||||||||
|
« |
Ug » |
« |
|
|
|
|
|
» |
|
|
|||||
|
¬ |
|
|
¼ |
¬ |
|
|
|
|
|
|
|
¼ |
|
(4.74) |
|
|
|
|
|
|
|
|
Ul |
|
|
|
|
V k3 |
|
|||
4Ql k4 tanh kh 4Ql2 k3l tanh lh |
U 2k2 |
|
0 , |
|||||||||||||
|
|
|||||||||||||||
|
|
|
|
|
|
|
Ug |
|
|
|
Ul |
|
|
|
||
where l2 = k2 + Ζ/Θl, µl is the liquid viscosity, and Υl and Υg are the liquid and gas densities. Furthermore, Senecal et al. [129] have shown that a simplified version of the dispersion relation,
Zr |
2Ql k2 4Ql2k4 |
Ul |
U 2k2 |
V k3 |
, |
(4.75) |
|
Ug |
Ul |
||||||
|
|
|
|
|
can be used if the following three assumptions are valid: first of all, an order of magnitude analysis using typical values from the inviscid solutions shows that the terms of second order viscosity can be neglected. Second, it can be shown that above a critical Weber number of We = 27/16 (based on the relative velocity, the gas density, and the sheet half-thickness) short waves, the growth rate of which are independent of the sheet thickness, grow on the sheet surface. Finally, the gas- to-liquid density ratio has to be small (Υg /Υl << 1). All these assumptions are valid in the case of typical pressure-swirl injectors used in modern DISI engines.
If the unstable waves on the sheet surface have reached a critical amplitude, the sheet is assumed to break up into primary ligaments. Because the wave growth is independent of the sheet thickness, the break-up time Ωb and the corresponding break-up length Lb can be formulated based on an analogy with the break-up of cylindrical liquid jets (e.g. Reitz [114]),
Kb K0 exp :Wb , |
Wb |
1 |
§K |
b |
· |
|
|
|
|
ln ¨ |
|
¸ |
, |
(4.76) |
|||
: |
|
|
||||||
|
|
©K0 ¹ |
|
|
||||
where : is obtained by numerically maximizing Eq. 4.75 as a function of k. Assuming that the velocity Uinj of the liquid sheet is not reduced until break-up occurs yields the break-up length
L |
U |
|
W |
|
U |
ln |
§K |
b |
· |
, |
(4.77) |
|
inj |
b |
|
¨ |
|
¸ |
|||||||
|
|
|
||||||||||
b |
|
|
: |
|
|
|
|
|
||||
|
|
|
|
|
|
©Ko ¹ |
|
|
||||
4.1 Primary Break-Up |
113 |
|
|
where the value of ln(Κb /Κ0) is taken to be 12 as suggested by Dombrowski and Hoper [29]. It must be noted that the quantity U in Eq. 4.75 is the relative velocity between liquid and gas while Uinj in Eq. 4.77 is the absolute velocity of the sheet. However, it is assumed in the numerical implementation that the relative velocity is equal to the absolute velocity because the liquid is usually injected into quiescent gas.
The diameter of the primary ligaments is obtained from a mass balance. It is assumed that every tear in the sheet forms a primary ligament. The resulting diameter is given by
dligament |
16hb |
. |
(4.78) |
|
|||
|
Ks |
|
|
Ks is the wave number of the fastest growing surface wave. Because the sheet thins as it departs from the nozzle, the position of first the break-up determines the ligament diameter. The sheet half-thickness hb at the point of break-up is
h |
|
|
h0 D Wb |
|
|
. |
(4.79) |
|
|
2L |
sin T |
D |
W |
|
|||
b |
|
b |
|
|||||
|
|
b |
|
|
|
|
||
The initial half-thickness |
of the film |
at |
the nozzle orifice is |
approximately |
||||
h0 ū0.5Γ0 cos(Τ).
The subsequent disintegration of the ligament into drops is calculated using another stability analysis, which is based on an analogy to Weber’s result for the growth of waves on cylindrical, viscous liquid columns. The wave number for the fastest growing wave on the ligament is
|
|
1 |
§ |
|
3Pl |
· 1/ 2 |
|
|
|
Kligament |
|
|
¨0.5 |
|
|
|
¸ |
. |
(4.80) |
d |
|
2 U |
V d |
|
|||||
|
ligament |
¨ |
ligament |
¸ |
|
|
|||
|
|
© |
l |
|
¹ |
|
|
||
As proposed in Dombrowski and Johns [30], it is assumed that break-up occurs if the amplitude of the wave is equal to the radius of the ligament, and that one drop is formed per wavelength. A mass balance gives the drop diameter:
ddrop 3 |
3Sdligament2 |
(4.81) |
|
|
. |
||
|
|||
|
Kligament |
|
|
The starting conditions of the drops formed at the point of break-up are used as input for the CFD calculation of spray formation. The parcels are injected into a hollow-cone with a mean spray angle Τ from the spray axis. The exact trajectory of each discrete parcel is determined by randomly distributing the angle over a range Τ ρ Τ, where Τ | 10 deg. is the dispersion angle. In the numerical implementation, it is assumed that the sheet does not interact with the gas phase. The sheet is represented by dormant parcels, which are injected with velocity Uinj (Eq. 4.70), and do not experience any drag nor undergo any break-up, evaporation, or