

Terminals, Loops and Turnbacks
There are three ways of turning a train requiring to reverse its direction at the end of a trip. First a simple change of direction where a locomotive is placed at the other end of the train or, where driving cabs are available at both end of the train, can be achieved in a train in a single terminal platform with a track on either side as shown left.

Second, you can drive the train around a loop track beyond the terminal station - provided you have the space to build the loop (diagram left).
Finally, you can provide a reversing track (or turnback, as it is called in the US). The train deposits arriving passengers in one platform and goes forward to the siding where it changes direction and then proceeds into a departure platform. In the diagram below, a single reversing track is shown at the left hand end while the double set of reversing tracks are shown at the right hand end. The latter is the usual option and can be seen in such places as Paris Metro and Tokyo Underground and London.
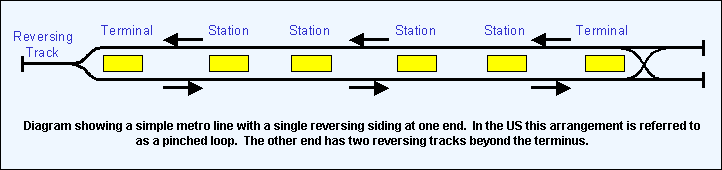
The first option - a simple reversal procedure - is the most popular since it uses least space and is reasonably quick. For the second option, tram or light rail operators who equipped their trains with a cab at one end only favour the loop. Some metro operators also use it, notably Paris and New York.
The third option is a reversing or turnback track as shown above (left hand end) but it is often used also when turning trains at a location mid-route. The siding is provided beyond the station between the main running lines and is connected to both, as shown below.
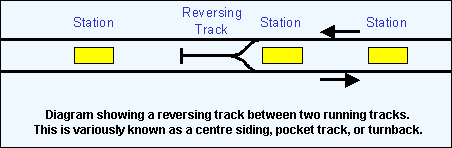
This solution is popular for urban and suburban systems where the inner section of a route has a requirement for a higher frequency service than the outer section.

An alternative layout is where a two-track terminus has its tracks extended beyond the station (diagram above). This arrangement allows trains to be stored between the peak hours or at night. A defective train can be stored there until it can be repaired or sent back to the depot.
Train Service Planning
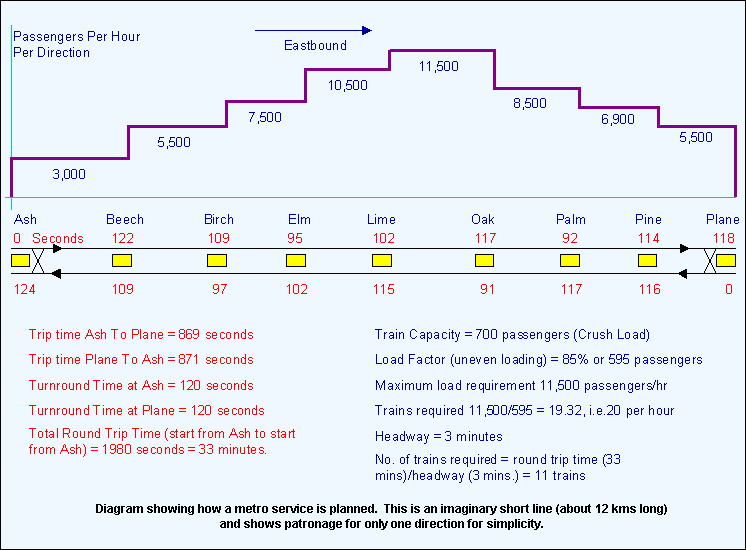
Here is an example of how a train service is planned for the peak hour of a short metro line. The diagram below shows the elements involved in planning the train service.
First, you have to find out how many passengers will use the service. This involves assessing the numbers of people in a given area who will come to the station during each hour of the day and how they will get there. Some will walk, some will use a bus service (if there is a good connection) and some will drive, if there is cheap parking. For walkers, 500 to 800 metres is about the limit. Bus users will usually prefer to get a direct route and good integration of transport will allow bus routes to be organised to feed rail stations. Often, this process requires political commitment - essential if the resources are to be used properly.
The next stage is to determine where the people want to go and when. For planning a new railway, this will be critical in deciding the best route. For existing lines, the development of the city may already have resulted from the routing of lines as it did in New York and London.
All of this "origin and destination" patronage data (укр. – клієнтура) is fed into a computer program and the numbers for each station, each direction and during each hour are derived. Such programs are usually owned by consulting companies who are engaged to do the work or who licence the operator to use the software. The end result is a set of numbers for each station which show:
Passengers boarding trains in each direction
Passengers alighting from trains in each direction
Passengers riding on trains between stations for each direction
Passengers transferring from line to line at interchange stations (if any)
To allow the train service to be planned, the patronage study generates "passengers per hour per direction" (pphpd) as shown at the top of the diagram above. In our case, we see the passenger numbers travelling between each station but, for simplicity, only the eastbound direction. The "curve" generated will not necessarily look like the one above on a suburban route, where there is often a build up starting at one end of the line which carries on building up until the terminus is reached and the train is full (to bursting sometimes).