Farmer income capitalization model
Listed Ukrainian companies earn on average USD 280/ha –ON/FROM WHAT EXACTLY?, a figure that we believe somewhat underestimates their earnings potential but that we are comfortable with using at the current stage of market development. Should the farmer own the land, the figure grows by the size of current lease payments, USD 75/ha on average.
We arrive at a USD 2,536/ha fair value after applying a 3% long-term growth rate and 17% discount rate (100% equity, sum of the current 9% Ukraine Eurobond yield, 6% equity risk premium and 2% sector-specific premium that we apply to farming businesses).
Farmland value = Income * (1+ growth rate) / (discount rate – growth rate) =
(USD 280 + USD 75)*(1+3%) / (17%-3%) = USD 2,612/ha
Normative value
We use the normative value of land currently set by the government as our third reference. While the figure varies by plot, the average value is known to be around UAH 20,000/ha or USD 2,500/ha.
As a reality check, below we provide land value in other countries and EV/ha multiples for listed companies.
Land value by country, USD/ha |
|
Listed farming companies, EV/ha owned, USD |
|
|
|
Sources: FAO, Margenes Agropecuarious, CARD, Black Rock, SLC Agricola, Brasilagro, Cresud, Adecoagro |
|
Source: Concorde Capital estimates
|

Biological asset revaluation
IAS 41 standard, effective since 2003 for all agricultural companies reporting under IFRS, requires companies to book agricultural produce and biological assets at “fair value less estimated cost of sell”, not at cost. Resulting revaluation gains or losses are recognized on the income statement; affecting all lines starting from COGS. Given that IFRS allows for a significant amount of freedom in estimating fair value and its amount could exceed total sales for farmers, we believe elimination of the revaluation components (effectively adjusting accounting to a cost-basis) is required for (1) assessment of true operating performance and (2) cross-company comparison.
How do we adjust the income statement to be on a cost basis?
To restate the income statement on a cost basis, we deduct two elements from the gross profit line:
(1) net change in fair value of biological assets and agricultural produce. Reported on the income statement just below revenues.
(2) the difference between fair value of agricultural produce sold and cash costs incurred during the production of agricultural produce. This is the revaluation part of the COGS line and could be either reported in COGS composition in the notes or not reported on the financial statements at all. If not reported, we requested the figure from management.
Where does revaluation come from?
Ukrainian farmers’ typical biological assets include crops in the ground and living animals. Typical agricultural produce are harvested crops.
Ias 41 application summary
Timing |
Assets |
Income statement |
Notes on revaluation |
Quarterly revaluation |
Prior “significant transformation occurred” |
Sowing costs are booked as inventories |
No effect |
At cost |
|
When “significant transformation of the biological asset has occurred” |
Inventories reclassified to biological assets with revaluation to the fair value less estimated cost to sell |
Fair value less estimated cost to sell is recognized as the net change in the fair value of biological assets and agricultural produce in the income statement just below the revenue line. It is included in the gross profit line and all subsequent lines |
Fair value is estimated using a cash flow model. Management decides: (1) when transformation is significant and (2) expected yields, costs, and discount rate Current market prices for crops are taken from a third-party |
Revalued quarterly with the change in the fair value less estimated cost to sell appearing in the same income statement line |
Harvesting |
Biological assets revalued and reclassified to agricultural produce at the moment of harvesting |
The net effect from revaluation is recognised in the income statement’s line usually named the net change in fair value of biological assets and agricultural produce |
Actual yields and production costs are used. Market prices at the moment of harvesting are used, selling costs are estimated |
Agricultural produce is not revalued |
Sale |
Inventory sold is deducted from the agricultural produce line in the asset part of the balance sheet |
(1) Actual revenue reported as revenue (2) The value of agricultural produce sold is recognised in COGS |
COGS includes both (1) cash production costs and (2) the difference between fair value of agricultural produce and cash costs |
n/a |
Note: See Appendix TT for crop production schedule for different crops
Source: Concorde Capital
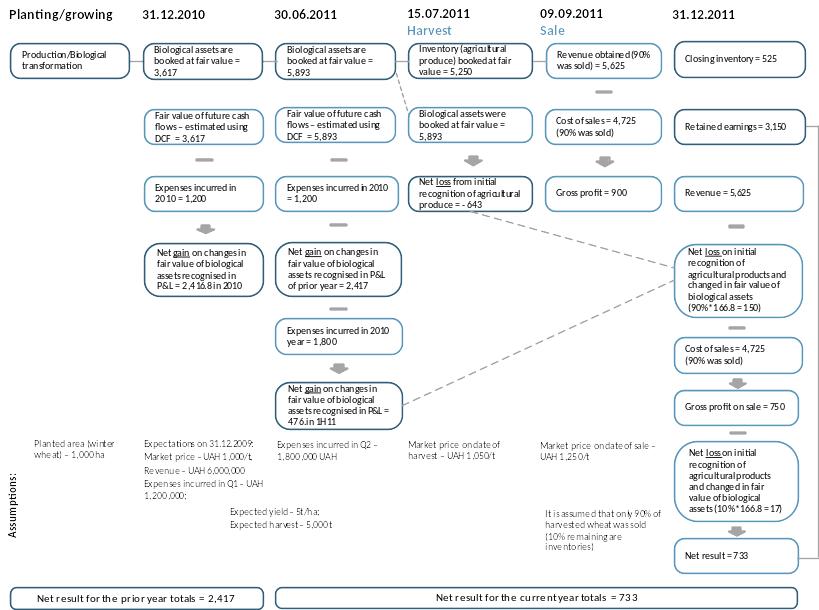
Below we present an example of application of IAS 41 to winter wheat (sown in the second half of the year) and semi-annual reporting, based on a case provided by Mriya:
|
|
Source: Mriya |
How can earnings be manipulated because of IAS 41?
Though use of the IAS 41 standard does not change earnings itself, if measured over the long-term, its application results in profits shifting from one period to another. Below, we present a list of actions management might undertake in order to increase profits in a previous period at the cost of a future period:
Increase the assumption of future crop yields
Underestimate costs to be incurred in the future
Use a lower discount rate
Increase the share of winter crops (for annual reporting, assuming management expects winter crops to be profitable)
Does revaluation make up a significant part of earnings? Yes
We find that biological asset revaluation comprised from TT% to TT% of total revenues for farming companies in this report. On the EBITDA line, IAS 41 revaluation was responsible for from TT% to TT% of the total and its impact was even more significant on the bottom line XYZ.
Charts
Are companies` approaches to revaluation identical? No
We also find that companies in this report have different approaches to biological asset revaluation, which makes us believe cross-company comparison is meaningless on unadjusted figures. Though companies are not required to disclose all assumptions used in estimating the fair value of biological assets, many of them disclose fair value structure per crop and hectares sown.
Book value of one hectare at yearend, USD/ha Wheat |
|
All winter crops |
|
|
|
Source: Concorde Capital estimates |
|
Source: Concorde Capital estimates |

We also look at the relative size of biological assets to total assets, which basically shows how management estimates the value of winter crops in the ground as a percentage of total assets. For all companies except Agroton, IMC and Kernel, the value of winter crops in the ground represents a significant part of total assets, with the share varying significantly among companies.
Biological assets (winter crops) as a % of total assets, end-2010 vs. share of winter crops in the total harvest structure of the next year |
|
Note: Bold marks those companies that use revaluation aggressively, in our view. MHP was excluded from this dataset as the company does not provide asset figures for its agriculture operations separately Source: Concorde Capital estimates |