Kernel Grain trader actively integrating upstream
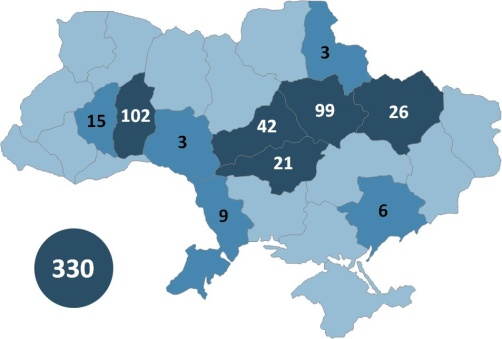
Rapid growth of the landbank through acquisitions: TTT ths ha added in 2011, another 119.2 ths ha added in April 2012 to a total of 330 ths ha, the largest among listed companies
One of the best location of the landbank: we estimate the land delivers 50% more in gross profit per ha than Ukraine`s average
Landbank dynamics, ths ha |
|
Crop structure, by ha, 2011 |
|
|
|
Source: Company data |
|
Source: Company data |
Production costs, USD/ha, 2011 Wheat |
|
Production costs, USD/ha, 2011 Corn |
|
|
|
Source: Company data |
|
Source: Company data |
Crop yields, t/ha, 2011 |
|
|
|
|
|
Source: Company data, State Statistics Committee of Ukraine |
||
Market data |
|
Bloomberg |
AGT PW |
Reuters |
AGT=PW |
Recommendation |
SELL |
Price, PLN |
17.5 |
12M target, PLN |
17.0 |
Upside |
-3% |
No of shares, mln |
21.7 |
Market Cap, PLN mln |
379.2 |
52-week performance |
|
52-week range, PLN |
|
ADT, 12M, PLN mln |
|
Free float, % |
0.4 |
Free float, PLN mln |
177.2 |
Source: Bloomberg |
|
Ownership structure |
|
Andrii Verevskyy |
38% |
Free float |
62% |
Source: Company data |
|
Share price performance |
|
Source: Bloomberg |
|
|
|
|
|
|
|
|
Company description Ukraine`s largest diversified agricultural company with sunflower oil production and grain trading as a core activities (66% and 29% of revenues in FY 2011 respectively). Aggressively expanded in farming by adding a total 240 ths ha via acquisitions over the last 1.5 years.
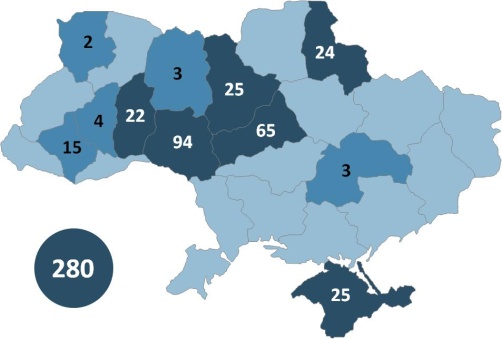
Company`s landbank, ths ha
Source: Company data |
|||
MHP
Poultry producer
Farming segment provides feedstock for poultry farming, a key segment for the company. Extra crops are sold to third partie
We calculate farming accounted for 18% of revenues and 30% of EBITDA in 2011
The most efficient farmer able to achieve largest crop yields premiums to its benchmark region averages which more than compensate the industry highest costs applied to ha
One of the best land location
Landbank dynamics, ths ha |
|
Crop structure, by ha, 2011 |
|
|
|
Source: Company data |
|
Source: Company data |


Production costs, USD/ha, 2011 Wheat |
|
Production costs, USD/ha, 2011 Corn |
|
|
|
Source: Company data |
|
Source: Company data |
Crop yields, t/ha, 2010 |
|
2011 |
|
|
|
Source: Company data, State Statistics Committee of Ukraine |
||
Market data |
|
Bloomberg |
AGT PW |
Reuters |
AGT=PW |
Recommendation |
SELL |
Price, PLN |
17.5 |
12M target, PLN |
17.0 |
Upside |
-3% |
No of shares, mln |
21.7 |
Market Cap, PLN mln |
379.2 |
52-week performance |
|
52-week range, PLN |
|
ADT, 12M, PLN mln |
|
Free float, % |
0.4 |
Free float, PLN mln |
177.2 |
Source: Bloomberg |
|
Ownership structure |
|
Yury Kosyuk |
80.7% |
Free float |
19.3% |
Source: Company data |
|
Share price performance |
|
Source: Bloomberg |
|
|
|
|
|
|
|
|
Company description Largest poultry producer in Ukraine, with a market share of 50% of industrially produced chicken. Also cultivates 280 ths ha. Owns a sunflower oilseed pressing plant with a total capacity of 590 kt p.a. In 2011, produced 384 kt of poultry working at full capacity, 174 kt of sunflower oil and 1.7 mln mt of crops. Key investment project is Vinnytsia poultry facility: total target production capacity of 440 kt of chicken meat per year, first stage with 220 kt to be launched in 1Q13.
Company`s landbank, ths ha
Source: Company data |
|||