Mriya in six charts
Landbank dynamics, ths ha |
|
Crop structure, by ha |
|
|
|
Source: Company data, State Statistics Committee of Ukraine |
|
Source: Company data, State Statistics Committee of Ukraine |


Crop yields, 2010 |
|
Crop yields, 2011 |
|
Sugar beet yields, 2010-11 |
|
|
|
|
|
Source: Company data |
|
Source: Company data |
|
Source: Company data |


Production costs, USD/ha, 2011 Wheat |
|
Rapeseed |
|
Sugar beets |
|
|
|
|
|
Source: Company data |
|
Source: Company data |
|
Source: Company data |


Sintal Agriculture
A non-core business
A reduction in costs per ha by 25% yoy in 2011, as guided by the management, should improve EBITDA margin to 21% in 2011 from 5% in 2010
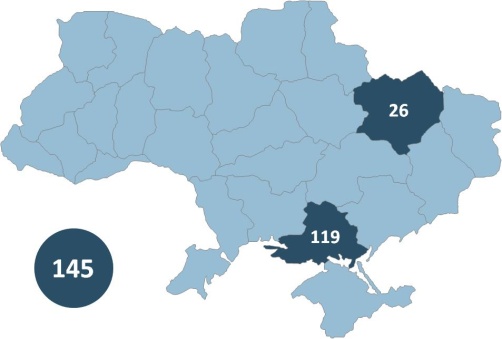
Land bank is mostly (119 of 146 ths ha) located in Kherson region in Southern Ukraine, a relatively dry and hot region. Crop yields in the region are below the Ukrainian average and our asset-base valuation shows the lowest fair value of Sintal’s lease rights among public agricultural names
A 1.5x landbank increase through its Agri&Ca acquisition in autumn 2011 was a value-accretive deal, in our view. The deal was completed at a multiple of USD 210/ha of lease rights, the lowest among its sector peers, and lease terms of 49 years are the longest possible in Ukraine
We fail to see current management working to create value for all minorities, as evident from the company`s selling prices being below the market average and overall business EBITDA margins being relatively low (15% in 2009 and 5% in 2010) and generally poor disclosure
12 TP of EUR 1.5/GDR, upside of 52%. HOLD due to high stock-specific risks.
Company description
Large-scale farming company with operations on 146 ths ha as of end of 2011. Operates in Kherson and Kharkiv regions. Owns a 100 kt grain silo in the northern part of Crimea.
Selected financials, USD mln and ratios |
|||||
|
2010 |
2011 |
yoy |
2012E |
yoy |
Net revenue |
31.8 |
46.5 |
46% |
49.0 |
5% |
Gross margin, % |
25% |
35% |
10pp |
50% |
15pp |
EBITDA |
1.6 |
9.8 |
532% |
17.6 |
79% |
EBITDA margin, % |
5% |
21% |
16pp |
36% |
15pp |
Net income |
-1.6 |
6.5 |
-499% |
12.5 |
93% |
Net margin, % |
-5% |
14% |
19pp |
25% |
12pp |
|
|
|
|
|
|
PP&E, net |
11.1 |
16.2 |
46% |
25.6 |
58% |
Shareholder equity |
56.3 |
71.8 |
27% |
84.2 |
17% |
LT debt |
0.0 |
0.0 |
n/m |
5.0 |
n/m |
ST debt |
5.6 |
16.4 |
191% |
12.8 |
-22% |
Total liabilities & equity |
15.9 |
27.3 |
72% |
28.0 |
3% |
|
|
|
|
|
|
Operating Cash Flow |
-3.8 |
-1.4 |
n/m |
10.5 |
n/m |
CapEx |
4.4 |
3.0 |
-31% |
11.7 |
4x |
|
|
|
|
|
|
Working Capital |
44.7 |
50.3 |
13% |
54.5 |
8% |
|
|
|
|
|
|
Harvest value, USD/ha |
415 |
610 |
47% |
496 |
-19% |
Gross profit, USD/ha |
27 |
321 |
11x |
187 |
-42% |
|
|
|
|
|
|
ROA |
-2% |
7% |
9pp |
11% |
5pp |
ROE |
-3% |
9% |
12pp |
15% |
6pp |
ROIC |
0% |
8% |
8pp |
16% |
7pp |
Source: Company Data, Concorde Capital estimates |
|||||
SNPS GR |
Current: |
USD 5.0 |
HOLD |
Target: |
USD 4.0 |
Market data |
|
Bloomberg |
|
Reuters |
|
Recommendation |
|
Price, USD |
|
12M target, USD |
|
Upside |
|
No of shares, mln |
|
Market Cap, USD mln |
|
52-week performance |
|
52-week range, USD |
|
ADT, 12M, USD mln |
|
Free float, % |
|
Free float, USD mln |
|
Source: Bloomberg |
|
Ownership structure |
|
Nikolay Tolmachev |
50% |
Management |
10% |
Icon Private Equity |
6% |
Free float |
34% |
*Holds an option for another 4.8% shares with strike price at USD 4.25/GDR. Source: Company data, Concorde Capital estimates |
|
Share price performance (1) |
|
(1) Hereafter, share prices as of XXX XX, XXXX Source: Bloomberg |
Multiples and per-share data |
|||
|
2008 |
2009E |
2010E |
EV/Capacity |
xx |
xx |
xx |
|
|
|
|
|
|
|
|
EV/Sales |
xx |
xx |
xx |
EV/EBITDA |
xx |
xx |
xx |
P/E |
xx |
xx |
xx |
|
|
|
|
P/B |
xx |
xx |
xx |
|
|
|
|
|
|
|
|
|
|
|
|
Source: Bloomberg, Company data, Concorde Capital estimates
Company`s operations, ths ha
Source: Company data |
|||