Mcb Agricole in six charts
Landbank dynamics, ths ha |
|
Crop structure, by ha |
|
|
|
Source: Company data, Concorde Capital |
|
Source: Company data, Concorde Capital |

Crop yields, 2010 |
|
Crop yields, 2011 |
|
|
|
Source: Company data, State Statistics Committee of Ukraine |
|
Source: Company data, State Statistics Committee of Ukraine |

Production costs, USD/ha, 2011 Corn |
|
Sunflower |
|
Wheat |
||
|
|
|
|
|
||
Source: Company data |
|
|
||||

Mriya Too sweet to be true
Low quality of earnings: 42% of revenues and 45% of EBITDA in 2011 came from sugar beet sales to related parties at USD 73/t vs. our calculation of market average price of USD 45/t. Sugar beet production costs per ha were 1.8x below those Astarta reports, which we find hard to believe
The sugar price drop in 2011/12 vs. 2010/11 (USD 525-660 vs. USD 830-1,000) should lead to lower earnings from sugar beets in 2012, unless the company sells to related parties at a price which implies booking losses at related parties-?
Overly aggressive CapEx in greenfield silos does not pay back, in our view: we estimate Mriya`s average selling prices only 5% above Ukraine`s average in 2011 and 12% less in 2010, sugar beets excluded
Highest land lease rights acquisition costs among public farmers: USD 1,500/ha in 2011 vs. USD 250-1,050/ha paid by other farmers
Watch list:
Site visit: May 29-30
2012 harvest: July-October 2012
Company description
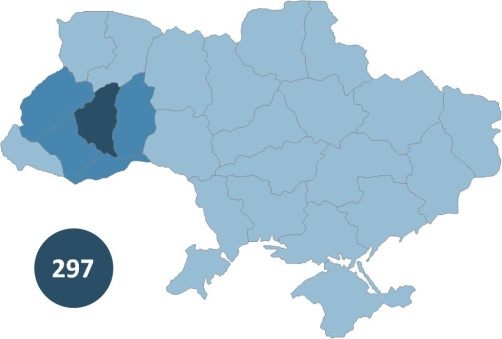
Second largest listed farming company with operations on 295 ths ha as of end of 2011. Operates primarily in Ternopil region with involvement in neighboring Khmelnitsk, Chernivtsi and Ivano-Frankivsk regions. Derives 2/3 of revenues from sales of sugar beets (14%-22% in crop rotation) to related parties. Yields are at a premium to region`s average for sugar beets (33% in average for 2010-11) and wheat (11%), key crops for the company, but 4%-57% below for remaining crops. Invests heavily in related infrastructure.
Selected financials, USD mln and ratios |
|||||
|
2010 |
2011 |
yoy |
2012E |
yoy |
Net revenue |
161.5 |
268.3 |
66% |
247.8 |
-8% |
Gross margin, % |
62% |
67% |
5pp |
60% |
-7pp |
EBITDA |
102.1 |
172.6 |
69% |
141.6 |
-18% |
EBITDA margin, % |
63% |
64% |
1pp |
57% |
-7pp |
Net income |
109.2 |
155.5 |
42% |
80.9 |
-48% |
Net margin, % |
68% |
58% |
-10pp |
33% |
-25pp |
|
|
|
|
|
|
PP&E, net |
181.0 |
381.3 |
2.1x |
526.6 |
38% |
Shareholder equity |
424.3 |
595.4 |
40% |
676.4 |
14% |
LT debt |
26.7 |
238.0 |
8.9x |
250.0 |
5% |
ST debt |
84.1 |
113.0 |
34% |
61.5 |
-46% |
Total liabilities & equity |
591.3 |
1,052.9 |
78% |
1,093.6 |
4% |
|
|
|
|
|
|
Operating Cash Flow |
-4.3 |
125.1 |
n/m |
97.7 |
-22% |
CapEx |
59.8 |
142.4 |
2.4x |
168.2 |
18% |
|
|
|
|
|
|
Working Capital |
246.6 |
278.3 |
13% |
280.6 |
1% |
|
|
|
|
|
|
Harvest value, USD/ha |
870 |
1,166 |
34% |
968 |
-17% |
Gross profit, USD/ha |
438 |
675 |
54% |
460 |
-32% |
|
|
|
|
|
|
ROA |
18% |
15% |
-4pp |
8% |
-7pp |
ROE |
26% |
26% |
0pp |
13% |
-13pp |
ROIC |
24% |
20% |
-4pp |
9% |
-12pp |
Source: Company Data, Concorde Capital estimates |
|||||
Market data |
|
Bloomberg |
|
Reuters |
|
Recommendation |
|
Price, USD |
|
12M target, USD |
|
Upside |
|
No of shares, mln |
|
Market Cap, USD mln |
|
52-week performance |
|
52-week range, USD |
|
ADT, 12M, USD mln |
|
Free float, % |
|
Free float, USD mln |
|
Source: Bloomberg |
|
MAYA GR |
Current: |
EUR 5.5 |
SELL |
Target: |
EUR 4.8 |
Ownership structure |
|
Guta family (management) |
80.0% |
Free float |
20.0% |
Source: Company data, Concorde Capital estimates |
|
Share price performance (1) |
|
(1) Hereafter, share prices as of XXX XX, XXXX Source: Bloomberg |
Multiples and per-share data |
|||
|
2008 |
2009E |
2010E |
EV/Capacity |
xx |
xx |
xx |
EV/Output |
xx |
xx |
xx |
|
|
|
|
EV/Sales |
xx |
xx |
xx |
EV/EBITDA |
xx |
xx |
xx |
P/E |
xx |
xx |
xx |
P/B |
xx |
xx |
xx |
|
|
|
|
|
|
|
|
|
|
|
|
|
|
|
|
Source: Bloomberg, Company data, Concorde Capital estimates
Company`s landbank, ths ha
Source: Company data
|
|||