
- •Investment Case 11
- •Valuation summary 37
- •Investment case 53
- •Investment Case
- •Companies Compared Stock data
- •Key metrics
- •Per ha comparison
- •Management credibility
- •Market Overview Summary
- •Ukraine in global context Ukraine produces 2-3% of world soft commodities
- •Sunflower oil, corn, wheat, barley and rapeseed are Ukraine’s key soft commodities to export
- •Ukraine is 8th in arable land globally
- •Key inputs used in crop farming Ukraine`s climate favorable for low-cost agriculture
- •Soil fertility map
- •Machinery use far below developed countries
- •Land trade moratorium makes more benefits
- •Fertilizer use
- •Inputs prices: lease cost is Ukraine’s key cost advantage
- •Case study: Production costs in Ukraine vs. Brazil for corn and soybean
- •Farming Efficiency Ukrainian crop yields lag the eu and us, on par with Argentina and Brazil, above Russia’s
- •5Y average yields, t/ha and their respective 10y cagRs
- •Yields at a premium in Ukraine on the company level
- •Growth Growth should come from yield improvement, crop structure reshuffle and acreage increase
- •Crop structure is gradually shifting to more profitable cultures
- •Combined crop structure of listed companies
- •Ukraine`s 2012 harvest outlook
- •Valuation
- •Valuation summary
- •Asset-based approach
- •Asset-based valuation
- •Valuation premium/discount summary
- •Location matters: Value of land by region
- •Yields efficiency comparing to benchmark region
- •Cost efficiency
- •Adding supplementary businesses
- •Valuation summary for other assets
- •Cost of equity assumptions
- •Model assumptions
- •Landbank growth capped at 30%
- •Crop structure
- •Biological revaluation (ias 41) excluded
- •Land ownership
- •Company Profiles Agroton a high cost producer
- •Investment case
- •Valuation
- •Operating assumptions
- •Financials
- •Income statement*, usd mln
- •Agroton in six charts
- •Operati
- •Industrial Milk Company Corn story
- •Investment case
- •A focus on the corn explains high margins
- •Location favourable for corn
- •Well on track with ipo proceeds
- •Weak ebitda margin in 2012 explained by non-cash items
- •Valuation
- •Valuation
- •Operating assumptions
- •Financials
- •Income statement*, usd mln
- •Ksg Agro On the road to space/Not ready to be public
- •Investment Case
- •A 5x yoy boost in total assets looks strange to us
- •Valuation
- •Operating assumptions
- •Financials
- •Income statement*, usd mln
- •Ksg Agro in six charts
- •Mcb Agricole Acquisition target with lack of positives for minorities
- •Investment Case
- •Inventories balance, usd mln
- •Overview of acquisitions of public farming companies in Ukraine
- •Valuation
- •Operating assumptions
- •Financials
- •Income statement, usd mln
- •Mcb Agricole in six charts
- •Mriya Too sweet to be true
- •Investment Case
- •Valuation
- •Operating assumptions
- •Financials
- •Income statement*, usd mln
- •Mriya in six charts
- •Sintal Agriculture
- •Investment Case
- •25% Yoy cost reduction in 2011 should improve margins
- •Irrigation is a growth option
- •Inventory balance, usd mln
- •Valuation
- •Valuation
- •Operating assumptions
- •Financials
- •Income statement*, usd mln
- •Sintal Agriculture in six charts
- •Astarta Sugar maker
- •Kernel Grain trader actively integrating upstream
- •Poultry producer
- •Appendices Land value
- •Current landowner income capitalization model
- •Farmer income capitalization model
- •Normative value
- •Biological asset revaluation
- •How do we adjust the income statement to be on a cost basis?
- •Ias 41 application summary
- •Appendix: Crop production schedule Crop schedule, based on 2012 harvesting year
- •Investment ratings
- •Contacts
Ksg Agro On the road to space/Not ready to be public
Lowest cost Ukrainian agriproducer: only USD 228 applied to ha of sunflower in 2010 vs. USD 386 on average for listed peers; USD 115/ha of wheat vs. USD 355/ha on average for listed peers
One of the highest margins thanks to its low-cost operations and heavy bias toward sunflowers in its crop rotation: 44%-64% EBITDA margin in 2009-10, net of biological revaluation
Located in sunflower-favourable Dnipropetrovsk region, resulting in a high risk, high return operation
Scattered and overambitious growth strategy with announced projects requiring CapEx of 12x-30x of 2010 EBITDA
Risks: ability to keep costs low, management accountability, high concentration in one region and on one crop, poor disclosure
Watch list:
2011 annual report: end of May
Landbank acquisition: up to 20 ths ha expected during summer
2012 harvest results: July-October 2012
Company description
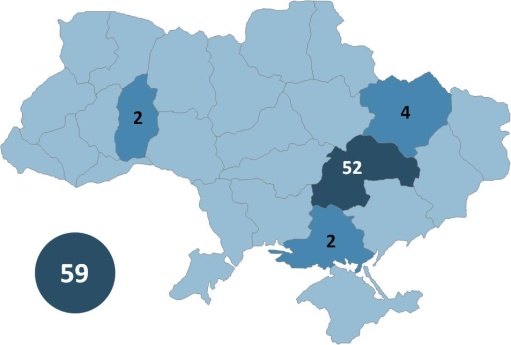
Low-cost mid-sized farming company located in sunflower-favorable Dnipropetrovsk region. Landbank has grown from 33 ths ha at IPO in May 2010 to 59.3 ths ha as of early 2012, with further growth plans still the most ambitious among listed names. Owns 16 kt grain storage facility. Acquired 50% stake in a pork farm in the same region in October 2011. Announced plans in January 2012 to construct a 60-90 kt pellet production plant.
Selected financials, USD mln and ratios |
|||||
|
2010 |
2011E |
yoy |
2012E |
yoy |
Net revenue |
15.6 |
18.1 |
16% |
31.2 |
72% |
Gross margin, % |
67% |
68% |
1pp |
58% |
-10pp |
EBITDA |
10.1 |
11.9 |
18% |
17.3 |
46% |
EBITDA margin, % |
64% |
65% |
1pp |
55% |
-10pp |
Net income |
7.9 |
8.5 |
9% |
12.5 |
46% |
Net margin, % |
50% |
47% |
-3pp |
40% |
-7pp |
|
|
|
|
|
|
PP&E, net |
5.0 |
20.3 |
4.0x |
36.2 |
78% |
Shareholder equity |
11.7 |
45.3 |
3.9x |
57.9 |
28% |
LT debt |
2.4 |
0.0 |
-100% |
0.0 |
n/m |
ST debt |
5.4 |
5.3 |
-2% |
5.4 |
2% |
Total liabilities & equity |
26.3 |
53.7 |
2.0x |
66.9 |
24% |
|
|
|
|
|
|
Operating Cash Flow |
10.0 |
-3.6 |
n/m |
10.1 |
n/m |
CapEx |
0.8 |
17.3 |
21x |
19.5 |
13% |
|
|
|
|
|
|
Working Capital |
8.6 |
13.6 |
59% |
19.7 |
44% |
|
|
|
|
|
|
Harvest value, USD/ha |
583 |
549 |
-6% |
544 |
-1% |
Gross profit, USD/ha |
388 |
307 |
-21% |
252 |
-18% |
|
|
|
|
|
|
ROA |
30% |
21% |
-9pp |
21% |
-1pp |
ROE |
68% |
30% |
-38pp |
24% |
-6pp |
ROIC |
35% |
36% |
1pp |
20% |
-15pp |
Source: Company Data, Concorde Capital estimates |
Market data |
|
Bloomberg |
|
Reuters |
|
Recommendation |
|
Price, PLN |
|
12M target, PLN |
|
Upside |
|
No of shares, mln |
|
Market Cap, PLN mln |
|
52-week performance |
|
52-week range, PLN |
|
ADT, 12M, PLN mln |
|
Free float, % |
|
Free float, PLN mln |
|
Source: Bloomberg |
|
KSG PW |
Current: |
PLN 21.7 |
HOLD |
Target: |
PLN 25.0 |
Ownership structure |
|
Sergey Mazin |
xx.x% |
Free float |
xx.x% |
Source: Company data, Concorde Capital estimates |
Share price performance (1) |
|
(1) Hereafter, share prices as of XXX XX, XXXX Source: Bloomberg |
Multiples and per-share data |
|||
|
2008 |
2009E |
2010E |
EV/Capacity |
xx |
xx |
xx |
EV/Output |
xx |
xx |
xx |
|
|
|
|
EV/Sales |
xx |
xx |
xx |
EV/EBITDA |
xx |
xx |
xx |
|
|
|
|
|
|
|
|
|
|
|
|
|
|
|
|
|
|
|
|
|
|
|
|
Source: Bloomberg, Company data, Concorde Capital estimates
Company`s
landbank, ths ha
Source: Company data, Concorde Capital
|