Agroton in six charts
Landbank dynamics, ths ha |
|
Crop structure, by ha |
|
|
|
Source: Company data, Concorde Capital |
|
Source: Company data, Concorde Capital |
Crop yields, 2010 |
|
Crop yields, 2011 |
|
|
|
Source: Company data, State Statistics Committee of Ukraine |
|
Source: Company data, State Statistics Committee of Ukraine |
Sunflower production costs, USD/ha, 2010 |
|
Wheat production costs, USD/ha, 2010 |
|
|
|
Source: Company data, State Statistics Committee of Ukraine |
|
Source: Company data, State Statistics Committee of Ukraine |

Operati
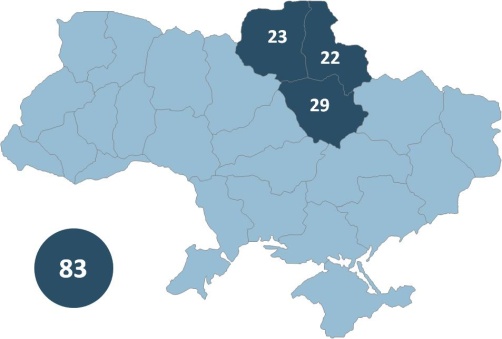
Industrial Milk Company Corn story
With land roughly equally split among Poltava, Chernihiv and Sumy region, we find company`s location the best among listed pure farmers, measured by gross profit per ha for average farmer in region
Focus on high IMC delivered 19%-27% yield premiums to its benchmark region average figures in 2010-11 for its key crops: corn, wheat, sunflower and soybean
Expanded landbank from 38 ths ha as of IPO in May 2011 to 83 ths ha in May 2012
Self-sufficient in storage with 303 kt capacity being the second-largest after Mriya
BUY with TP of PLN 18.7/share, upside of TT%. Undervalued both on DCF and asset-based models
Watch list:
1H12 financials: August 2012
2012 harvest figures: August – October 2012
Company description
Large-scale farming company that operates 83 ths ha split in clusters in Poltava, Chernihiv and Sumy regions. Focus on the cultivation of corn: 48%-63% of acreage in 2008-12 vs.8%-15% in average for Ukraine. Crop yields are 27% more than the region`s average for corn for 2010-11, 24% for sunflower and 27% for wheat, achieved through larger-than-average costs per ha. Owns elevators with a total grain storage capacity of 303 kt. Involved in cattle farming (20% of 2010 and 33% of 2011 revenues). Raised USD 24.4 mln through IPO in April 2011 floating 24% of the share capital.
Selected financials, USD mln and ratios |
|||||
|
2010 |
2011 |
yoy |
2012E |
yoy |
Net revenue |
34.8 |
29.1 |
-16% |
63.6 |
119% |
Gross margin, % |
50% |
46% |
-4pp |
57% |
+11pp |
EBITDA |
15.6 |
5.7 |
-63% |
32.1 |
463% |
EBITDA margin, % |
45% |
20% |
-25pp |
50% |
+30pp |
Net income |
16.6 |
-1.6 |
-109% |
19.8 |
n/m |
Net margin, % |
48% |
-5% |
-53pp |
31% |
+36pp |
|
|
|
|
|
|
PP&E, net |
54.0 |
61.6 |
14% |
81.5 |
32% |
Shareholder equity |
67.2 |
109.0 |
62% |
128.8 |
18% |
LT debt |
8.7 |
14.1 |
62% |
25.0 |
78% |
ST debt |
3.5 |
8.0 |
126% |
31.4 |
294% |
Total liabilities & equity |
87.4 |
138.7 |
59% |
193.5 |
40% |
|
|
|
|
|
|
Operating Cash Flow |
12.3 |
-10.1 |
-182% |
-0.4 |
-97% |
CapEx |
3.0 |
7.9 |
163% |
25.8 |
228% |
|
|
|
|
|
|
Working Capital |
21.3 |
54.7 |
156% |
80.8 |
48% |
|
|
|
|
|
|
Revenues, USD/ha |
895 |
1,312 |
47% |
1,115 |
-15% |
Gross profit, USD/ha |
500 |
751 |
50% |
516 |
-31% |
|
|
|
|
|
|
ROA |
19% |
-1% |
-20pp |
12% |
+13pp |
ROE |
25% |
-1% |
-26pp |
17% |
+18pp |
ROIC |
0% |
1% |
1pp |
14% |
+13pp |
Source: Company Data, Concorde Capital estimates |
|||||
|
|
||||||
Bloomberg |
IMC PW |
||||||
Reuters |
IMC=PW |
||||||
Recommendation |
BUY |
||||||
Price, PLN |
9.9 |
||||||
12M target, PLN |
29.8 |
||||||
Upside |
56% |
||||||
No of shares, mln |
31.3 |
||||||
Market Cap, PLN mln |
309.9 |
||||||
52-week performance |
|
||||||
52-week range, PLN |
|
||||||
ADT, 12M, PLN mln |
|
||||||
Free float, % |
23.9% |
||||||
Free float, PLN mln |
74.1 |
||||||
Source: Bloomberg |
|
Ownership structure |
|
Alexander Petrov |
68.2% |
Management |
7.9% |
Free float |
23.9% |
Source: Company data |
|
Share price performance (1) |
|
(1) Hereafter, share prices as of XXX XX, XXXX Source: Bloomberg |
Multiples and per-share data |
|||
|
2008 |
2009E |
2010E |
EV/Capacity |
|
|
|
EV/Output |
|
|
|
|
|
|
|
EV/Sales |
|
|
|
EV/EBITDA |
|
|
|
P/E |
|
|
|
P/B |
|
|
|
|
|
|
|
|
|
|
|
|
|
|
|
|
|
|
|
Source: Bloomberg, Company data, Concorde Capital estimates
Company`s landbank, ths ha
Source: Company data |
|||