

Land ownership
Due to the moratorium on agricultural land trade in Ukraine, all agricultural companies lease the land they operate, primarily from households. There are discussions on the abolition of the land trade moratorium present in parliament for the last decade with numerous law drafts and respective implications. We don’t see any of the current law drafts being close enough to reality and expect the discussion to resume following the parliamentary elections in October 2012.
Tax benefits discontinuation
Under Ukrainian law, producers of agricultural products are permitted to benefit from two special taxation regimes: (1) they are allowed to retain VAT on the agricultural produce and (2) to pay negligible fixed agricultural tax instead of corporate income tax (21% currently). We calculate that VAT benefits amounted to 2%-9% of revenues for listed Ukrainian farmers in 2010. We don’t expect a change in either of taxation regimes in foreseeable future.
Export quotas/ban
Ukraine`s government may introduce export quotas/ban on selected crops from time to time, with motivation usually driven by expected shortage of the crop on the local market. Given the historical experience the quotas/ban introduction leads to the lowering of the local selling prices. We find wheat and barley as two most-sensitive crops to the potential quotas and bans in the future.
Export duties
Export duty on selected crops is another negative government regulation which could appear from time to time (currently present for barley, since June 2012 and sunflower oilseed, since 2003). While the usual reasoning behind duties is the intention to limit local inflation, the discussion during the last summer duties shows that government might be willing to profit if global soft commodity prices grow significantly. We believe that in case of duties introduction most of the duty lies on the farmers’ margin.
Acquisition risk
We stress the additional risk for minorities of stocks listed on Frankfurt Stock Exchange: MCB Agricole, Mriya and Sintal Agriculture. In case the majority shareholders will be willing to sell their stakes (which could be the case of MCB Agricole and Sintal Agriculture, in our opinion), there is no guarantee for fair treatment of minorities during the acquisition; case studies of acquisitions of Ukrros, Landwest and Dakor (all listed in Frankfurt) shows minorities were offered little to nothing and disclosure disappeared post-acquisition.
Company Profiles Agroton a high cost producer
Low margin producer (9% and 25% EBITDA margins in 2010 and 2011, respective) on a relatively small revenue per ha
Location allows for high share of profitable sunflowers (~1/3 of total crops vs. Ukraine’s average of 1/6) but requires higher costs
Overly aggressive CapEx plans for storage facilities: 260 kt over three years
Little visibility on where IPO and bond placement proceeds have gone: usage of only 30% is clear and many pre-placement promises remain unfulfilled
Red flag: 2/3 revenues in 2011 were qualified by auditors, 2/5 of 2011 revenues still outstanding in receivables as of end of April 2012
While our DCF model suggests little value in the stock, significant upside is found in asset-based valuation, which could be unlocked by a management turnaround or majority ownership change
Watch list:
Collection of USD 41 mln in receivables: June 2012
Spring sowing campaign results
Construction pace of its greenfield grain silo which should be commissioned in 2012
2012 harvest results: July-October 2012
Company description
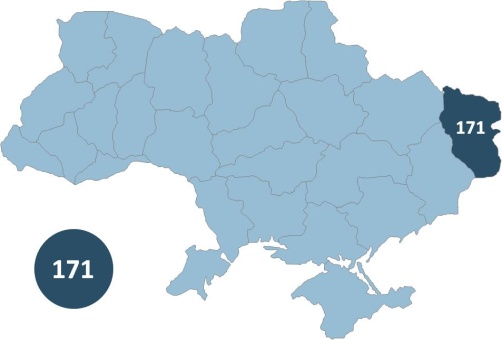
Large-scale farming company that operates 171 ths ha concentrated in Luhansk region (Eastern Ukraine). Focus on the cultivation of high-margin sunflower: 36%-37% of acreage vs. 36% for the region and 17% for Ukraine. Crop yields are 34% more than the region`s average for sunflower (5Y average is taken into account), 10%-67% more for other crops, achieved through larger-than-average costs per ha. Owns elevators with a total capacity of 105 kt and leases another 180 kt from the state. Involved in cattle farming (17% of 2011 revenues) and food processing (3%).
Selected financials, USD mln and ratios |
|||||
|
2010 |
2011 |
yoy |
2012E |
yoy |
Net revenue |
57.3 |
99.7 |
74% |
94.1 |
-6% |
Gross margin, % |
28% |
47% |
19pp |
34% |
-13pp |
EBITDA |
5.0 |
24.5 |
4.9x |
21.0 |
-14% |
EBITDA margin, % |
9% |
25% |
16pp |
22% |
-2pp |
Net income |
-14.6 |
12.0 |
n/m |
7.6 |
n/m |
Net margin, % |
-25% |
12% |
38pp |
8% |
-4pp |
|
|
|
|
|
|
PP&E, net |
38.3 |
31.2 |
-19% |
57.0 |
83% |
Shareholder equity |
122.1 |
119.8 |
-2% |
127.4 |
6% |
LT debt |
2.8 |
47.9 |
17x |
50.0 |
4% |
ST debt |
13.6 |
3.8 |
-72% |
1.0 |
-75% |
Total liabilities & equity |
144.3 |
179.9 |
25% |
187.0 |
4% |
|
|
|
|
|
|
Operating Cash Flow |
-1.8 |
-2.5 |
37% |
32.0 |
-1407% |
CapEx |
11.6 |
25.5 |
2.2x |
32.9 |
29% |
|
|
|
|
|
|
Working Capital |
75.8 |
95.5 |
26% |
78.2 |
-18% |
|
|
|
|
|
|
Revenues, USD/ha |
534 |
635 |
19% |
572 |
-10% |
Gross profit, USD/ha |
186 |
206 |
11% |
130 |
-37% |
|
|
|
|
|
|
ROA |
-10% |
7% |
17pp |
4% |
-3pp |
ROE |
-12% |
10% |
22pp |
6% |
-4pp |
ROIC |
0% |
10% |
11pp |
6% |
-4pp |
Source: Company Data, Concorde Capital estimates |
|||||
AGT PW |
Current: |
PLN 17.5 |
SELL |
Target: |
PLN 7.8 |
Market data |
|
Bloomberg |
|
Reuters |
|
Recommendation |
|
Price, PLN |
|
12M target, PLN |
|
Upside |
|
No of shares, mln |
|
Market Cap, PLN mln |
|
52-week performance |
|
52-week range, PLN |
|
ADT, 12M, PLN mln |
|
Free float, % |
|
Free float, PLN mln |
|
Source: Bloomberg |
|
Ownership structure |
|
Iurii Zhuravlov |
51.4% |
Free float |
48.6% |
Source: Company data |
|
Share price performance |
|
Source: Bloomberg |
Multiples and per-share data |
|||
|
2010 |
2011 |
2012E |
EV/ha leased |
xx |
xx |
xx |
EV/ha harvested |
xx |
xx |
xx |
|
|
|
|
EV/Sales |
xx |
xx |
xx |
EV/EBITDA |
xx |
xx |
xx |
P/E |
xx |
xx |
xx |
P/B |
xx |
xx |
xx |
|
|
|
|
|
|
|
|
|
|
|
|
|
|
|
|
Source: Bloomberg, Company data, Concorde Capital estimates
Company`s landbank, ths ha
|
|||
 Source:
Company data
Source:
Company data