

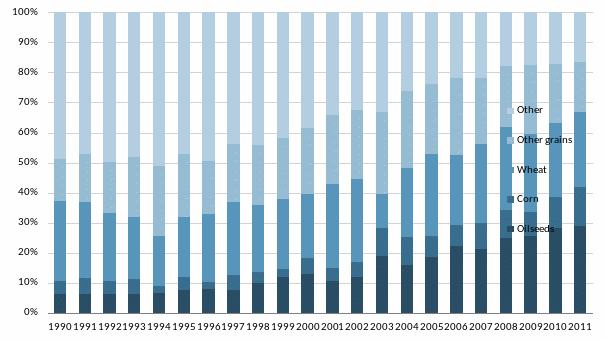
Crop structure is gradually shifting to more profitable cultures
Ukraine`s climate and soil quality have historically made wheat and barley the most popular crops, with sunflower, potatoes and sugar beets second order cultures. Within the last decade, farmers have started to increase the share of more profitable crops: corn and sunflower shares has grown while soybeans and rapeseed have successfully emerged.
Ukraine`s harvest area structure |
|
Source: State Statistics Committee of Ukraine, USDA, Concorde Capital calculations |
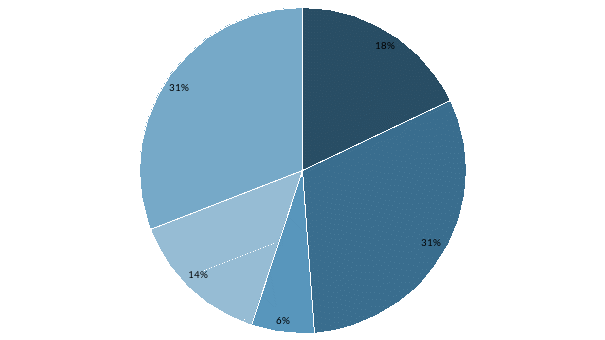
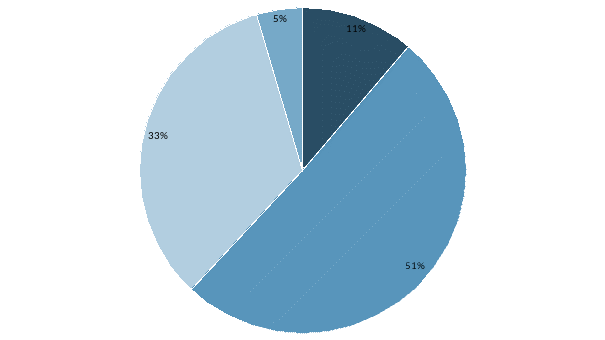
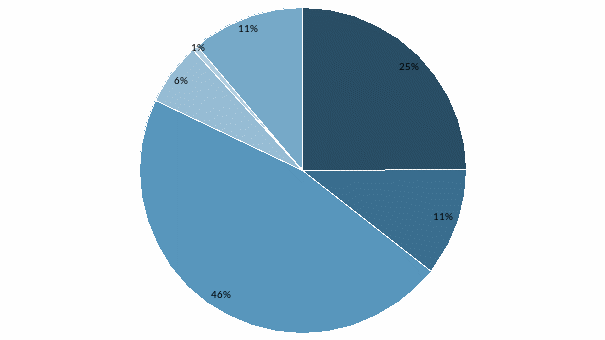
The crop mix of listed Ukrainian companies is shifted toward more profitable crops, but is far from the structure of their Brazilian and Argentinian peers. Corn accounted for 18% of the combined area harvested for Ukrainian listed companies vs. 11% on average for Ukraine (vs. 11% and 25%, respectively, for Brazilian and Argentinean peers), while oilseeds accounted to 29% of Ukrainian listed companies acreage vs. 24% on average for Ukraine and 51% for Brazilian and 46% for Argentinean listed companies.
Combined crop structure of listed companies
Ukraine |
Russia |
Brazil |
Argentina |
|
|
|
|
|
|
Note: Based on 2010-11 reports of Agroton, Sintal Agriculture, MCB Agricole, Mriya, Industrial Milk Company, KSG Agro, Astarta, Kernel, MHP, Alpcot Agro, Black Earth Farming, Trigon Agri, SLC Agricola, Brasilagro, Cresud, Adecoagro. Source: Company data
|
||||


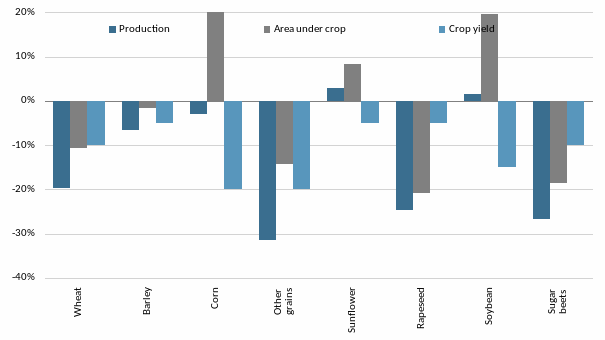
Ukraine`s 2012 harvest outlook
We expect crop yields will decrease by 5-20% yoy in 2012, as we do not expect the positive weather effect observed in 2011 to repeat this year. The cold weather in winter with limited snow added some negatives, killing an estimated 20% of winter grains and 40% of winter rapeseed, or 9% of the total expected acreage under grains and oilseeds. We expect corn, sunflower and soybean will add in acreage on the ground of killed winter wheat and rapeseed. As a result, we expect total grain production in Ukraine at 50 mln mt, down 11% yoy and oilseed production at 13 mln mt, flat yoy.
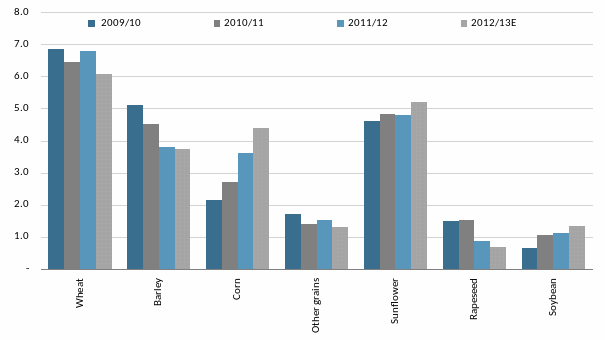
Area under crop, mln ha |
|
|
|
|
|
Source: APK-Inform, Concorde Capital projections |
|
Source: APK-Inform, State Statistics Committee of Ukraine, Concorde Capital projections |

Production, mln mt |
|
2012 vs. 2011, yoy |
|
|
|
Source: APK-Inform, Concorde Capital projections |
|
Source: APK-Inform, State Statistics Committee of Ukraine, Concorde Capital projections |

Ukraine`s grain supply-demand balance, mln mt |
|
|
|
|
|
|
|
|
2006/07 |
2007/08 |
2008/09 |
2009/10 |
2010/11 |
2011/12 |
2012/13 |
Initial stocks |
4.8 |
3.6 |
3.6 |
4.4 |
3.2 |
4.5 |
13.1 |
Gross harvest |
34.3 |
29.3 |
51.0 |
46.0 |
39.3 |
56.7 |
50.3 |
Import |
0.2 |
0.1 |
0.1 |
0.1 |
0.1 |
0.1 |
0.1 |
Total supply |
39.3 |
33.0 |
54.7 |
50.5 |
42.6 |
61.4 |
63.6 |
|
|
|
|
|
|
|
|
Consumption |
25.7 |
25.2 |
27.1 |
26.4 |
25.8 |
26.4 |
26.4 |
food |
5.7 |
6.1 |
6.2 |
5.9 |
5.7 |
5.7 |
5.7 |
feed |
14.7 |
14.1 |
14.8 |
14.8 |
14.9 |
15.0 |
15.2 |
seeds |
2.6 |
2.6 |
2.7 |
2.5 |
2.5 |
2.5 |
2.5 |
losses |
1.4 |
1.2 |
1.9 |
1.8 |
1.4 |
2.1 |
1.9 |
other |
1.3 |
1.2 |
1.5 |
1.4 |
1.2 |
1.1 |
1.1 |
Export |
9.8 |
4.2 |
23.0 |
20.9 |
12.3 |
21.8 |
30.5 |
Total utilization |
35.5 |
29.4 |
50.1 |
47.3 |
38.1 |
48.2 |
57.0 |
|
|
|
|
|
|
|
|
Ending stocks |
3.8 |
3.6 |
4.6 |
3.2 |
4.5 |
13.1 |
6.6 |
as % of consumption |
15% |
14% |
17% |
12% |
18% |
50% |
25% |
Source: APK-Inform, Concorde Capital forecasts