- •Static Characteristics of Instrument Systems
- •Drift
- •Hysteresis and Backlash
- •Saturation
- •Bias
- •Error of Nonlinearity
- •Dynamic Characteristics of Instrument Systems
- •Forcing Functions
- •Characteristic Equation Development
- •Response of the Different Linear Systems Types
- •Zero-Order Blocks
- •First-Order Blocks
- •Second-Order Blocks
- •Calibration of Measurements
- •References

FIGURE 3.7 Generalized graph of output/input relationship where hysteresis is present. (From P. H. Sydenham, Handbook of Measurement Science, Vol. 2, Chichester, U.K., John Wiley & Sons, 1983. With permission.)
can be amplified by a single semiconductor element. Raising the level of all of the waveform equally takes all parts into the reasonably linear zone of an amplifier, allowing more faithful replication. If bias were not used here, then the lower half cycle would not be amplified, resulting in only the top half appearing in the output.
Error of Nonlinearity
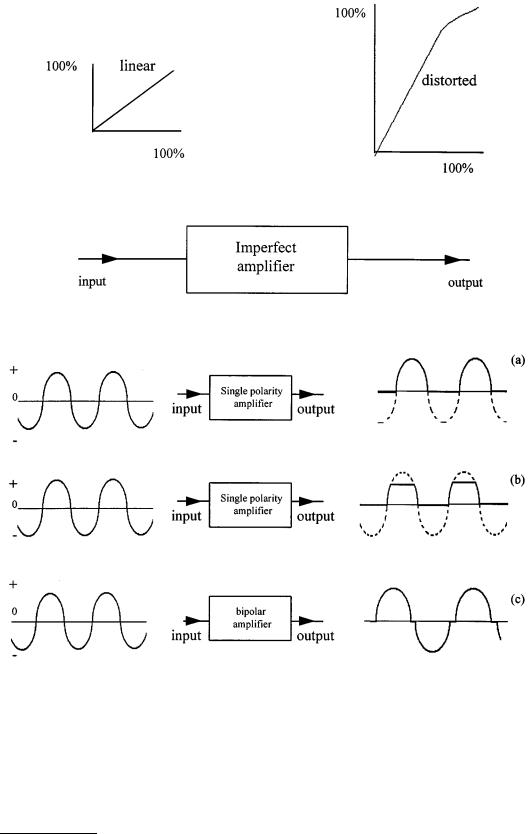
Ideally, it is often desired that a strictly linear relationship exists between input and output signals in amplifiers. Practical units, however, will always have some degree of nonconformity, which is called the nonlinearity. If an instrument block has constant gain for all input signal levels, then the relationship graphing the input against the output will be a straight line; the relationship is then said to be linear.
© 1999 by CRC Press LLC

FIGURE 3.8 Nonlinear amplification can give rise to unwanted output distortion.
FIGURE 3.9 Blocks can incorrectly alter the shape of waveforms if saturation and crossover effects are not controlled: (a) rectification; (b) saturation; and (c) crossover distortion.
Linearity is the general term used to describe how close the actual response is compared with that ideal line. The correct way to describe the error here is as the error of nonlinearity. Note, however, that not all responses are required to be linear; another common one follows a logarithmic relationship.
Detailed description of this error is not easy for that would need a statement of the error values at all points of the plot. Practice has found that a shorthand statement can be made by quoting the maximum departure from the ideal as a ratio formed with the 100% value.
© 1999 by CRC Press LLC

FIGURE 3.10 Bias is where a signal has all of its value raised by an equal amount. Shown here is an ac input waveform biased to be all of positive polarity.
Difficulties arise in expressing error of nonlinearity for there exist many ways to express this error. Figure 3.11 shows the four cases that usually arise. The difference arises in the way in which the ideal (called the “best fit”) straight line can be set up. Figure 3.11(a) shows the line positioned by the usually calculated statistical averaging method of least squares fit; other forms of line fitting calculation are also used. This will yield the smallest magnitude of error calculation for the various kinds of line fitting but may not be appropriate for how the stage under assessment is used. Other, possibly more reasonable, options exist. Figure 3.11(b) constrains the best fit line to pass through the zero point. Figure 3.11(c) places the line between the expected 0% and the 100% points. There is still one more option, that where the theoretical line is not necessarily one of the above, yet is the ideal placement, Figure 3.11(d).
In practice then, instrument systems linearity can be expressed in several ways. Good certification practice requires that the method used to ascertain the error is stated along with the numerical result, but this is often not done. Note also that the error is the worst case and that part of the response may be much more linear.
The description of instrument performance is not a simple task. To accomplish this fully would require very detailed statements recording the performance at each and every point. That is often too cumbersome, so the instrument industry has developed many short-form statements that provide an adequate guide to the performance. This guide will be seen to be generally a conservative statement.
Many other descriptors exist for the static regime of an instrument. The reader is referred to the many standards documents that exist on instrument terminology; for example, see Reference [3].
3.2 Dynamic Characteristics of Instrument Systems
Dealing with Dynamic States
Measurement outcomes are rarely static over time. They will possess a dynamic component that must be understood for correct interpretation of the results. For example, a trace made on an ink pen chart recorder will be subject to the speed at which the pen can follow the input signal changes.
© 1999 by CRC Press LLC

FIGURE 3.11 Error of nonlinearity can be expressed in four different ways: (a) best fit line (based on selected method used to decide this); (b) best fit line through zero; (c) line joining 0% and 100% points; and (d) theoretical line. (From
P.H. Sydenham, Handbook of Measurement Science, Vol. 2, Chichester, U.K., John Wiley & Sons, 1983. With permission.)
©1999 by CRC Press LLC
