


vk.com/id446425943
2018 Wind Technologies Market Report
5 Performance Trends
Following the previous discussion of technology trends, this chapter presents data from a compilation of project-level capacity factors.40 The full data sample consists of 965 wind projects built between 1998 and 2017 totaling 86,217 MW (97% of nationwide installed wind capacity at the end of 2017).41 Excluded from this assessment are older projects installed prior to 1998. In addition, fourteen projects totaling more than 1.4 GW that were either partially or fully repowered in 2018 are excluded from the 2018 capacity factor sample, given that they were at least partly offline during a portion of the year.
The chapter is divided into six subsections: the first presents raw capacity factor data, both by project age and fleet-wide; the second explores variations in capacity factor by region and state; the third focuses on the influence of turbine design and site characteristics; the fourth discusses the impact of wind power curtailment; the fifth examines temporal variations in the wind resource; and the sixth analyzes the possibility of performance degradation over time. A Text Box highlights performance enhancements from projects that were partially repowered in 2017. Unless otherwise noted, all capacity factors in this chapter are reported on an asobserved and unadjusted basis (i.e., after any losses from curtailment, less-than-full availability, wake effects, ice or soil on blades, etc.). In two cases—when looking for performance degradation over time, and when exploring the impact of repowering—we make adjustments for inter-annual variability in the wind resource.
The average capacity factor in 2018 exceeded 40% among wind projects built in recent years, and reached 35% on a fleet-wide basis
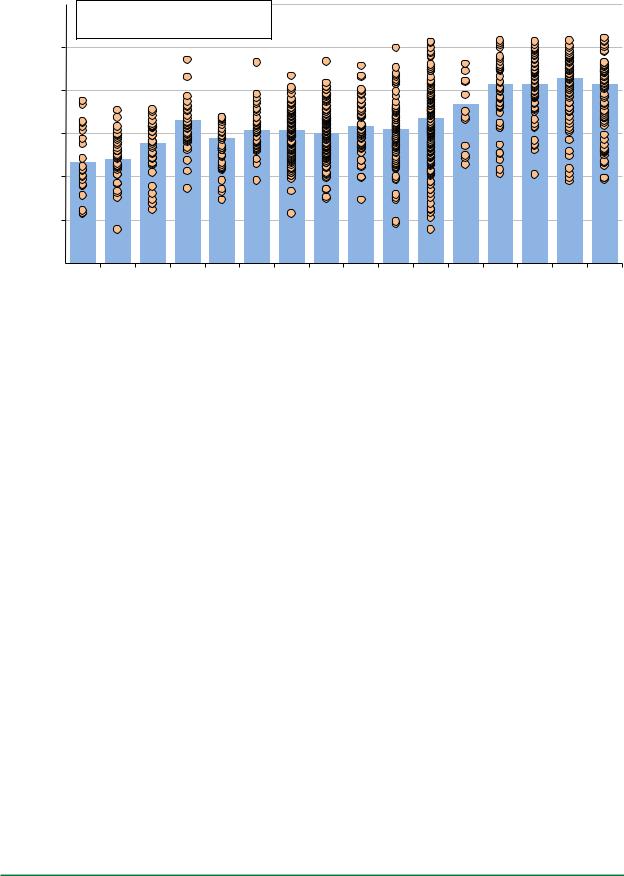
Figure 35 shows both individual project and average capacity factors in 2018, broken out by commercial operation date.42 Projects built in 2018 are excluded, as full-year performance data are not yet available for those projects. From left to right, Figure 35 shows an increase in weighted-average 2018 capacity factors when moving from projects installed in the 1998–2001 period to those installed in the 2004–2005 period. Subsequent project vintages through 2011 show little if any improvement in average capacity factors recorded in 2018. This pattern of stagnation is broken by projects installed in 2012–2013, and even more so by those that achieved commercial operations in 2014–2017.43 The average 2018 capacity factor among projects built from 2014 to 2017 was 41.9%, compared to an average of 30.8% among all projects built from 2004 to 2011, and 23.8% among all projects built from 1998 to 2001. This apparent improvement in capacity factor among morerecently built projects is impacted by several factors that are explored later, including project location and the quality of the wind resource at each site, turbine scaling and design, and performance degradation over time.
40Capacity factor is a measure of the actual energy generated by a project over a given timeframe (typically annually) relative to the maximum possible amount of energy that could have been generated over that same timeframe if the project had been operating at full capacity the entire time.
41Although some performance data for wind power projects installed in 2018 are available, those data do not span an entire year of operations. As such, for the purpose of this section, the focus is on projects with commercial operation dates from 1998 through 2017, often focusing on 2018 capacity factors for those projects.
42Focusing on capacity factors in a single year, 2018, controls (at least loosely) for time-varying influences such as the degree of wind power curtailment or inter-annual variability in the strength of the wind resource. But it also means that the absolute capacity factors shown in Figure 35 may not be representative over longer terms if 2018 was not a representative year in terms of curtailment or the strength of the wind resource (though as noted later, 2018 was a fairly average wind year overall).
43The 2018 capacity factor of projects that were built in 2017 may be biased low, due to possible first-year “teething” issues, as projects may take a few months to achieve normal, steady-state production after first achieving commercial operations.
37
vk.com/id446425943
2018 Wind Technologies Market Report
Capacity Factor in 2018 (by project COD)
60% 
 Generation-Weighted Average
 Individual Project
50%
40%
30%
20%
10%
0% |
|
|
|
|
|
|
|
|
|
|
|
|
|
|
|
|
|
|
Year:'98-99 '00-01 '02-03 '04-05 |
2006 |
2007 |
2008 |
2009 |
2010 |
2011 |
2012 |
2013 |
2014 |
2015 |
2016 |
2017 |
||||||
# of GW: 0.9 |
0.9 |
1.7 |
2.3 |
1.6 |
5.2 |
7.7 |
9.7 |
4.7 |
5.9 |
13.6 |
1.0 |
5.1 |
8.3 |
8.2 |
7.0 |
|||
Source: Berkeley Lab
Figure 35. Calendar year 2018 capacity factors by commercial operation date
Figure 36 presents data on essentially the same sample of projects built from 1998–2017, but organized in a different way: the blue bars show the average sample-wide capacity factor in each calendar year among a progressively larger cumulative sample each year. Viewed this way, we would expect to see a gradual improvement in capacity factor over time, as the advancements in turbine design (e.g., reductions in specific power, increases in tower height) that have driven the dramatic trend seen above in Figure 35 take longer to infiltrate and influence the overall fleet. In general, the data appear to support this trend, with somewhat higher capacity factors in more recent years—reaching 35% for the first time in 2018. But there is also considerable year-to-year variability in the data, driven in part by two factors—wind energy curtailment and inter-year variability in the strength of the wind resource—that are discussed below.
38

vk.com/id446425943
2018 Wind Technologies Market Report
Average Capacity Factor in Calendar Year
40% |
|
35% |
|
30% |
|
25% |
|
20% |
|
15% |
|
10% |
|
5% |
|
0% |
2000 2001 2002 2003 2004 2005 2006 2007 2008 2009 2010 2011 2012 2013 2014 2015 2016 2017 2018 |
Year: |
|
# of GW: |
0.6 0.9 2.7 3.1 4.5 5.1 8.0 9.9 14.9 23.6 33.3 38.5 44.7 58.2 59.4 64.3 72.7 78.6 86.2 |
Source: Berkeley Lab
Figure 36. Average sample-wide capacity factors by calendar year
Regional variations in capacity factors reflect the strength of the wind resource and adoption of new turbine technology
The project-level spread in capacity factors shown in Figure 35 is enormous, with capacity factors in 2018 ranging from a minimum of 20% to a maximum of 52% among those projects built in 2017. (This spread is even wider for projects built in earlier years.) Some of the spread in project-level capacity factors—for projects built in 2017 and earlier—is attributable to regional variations in average wind resource quality. As such, Figure 37 shows the regional variation in capacity factors in 2018 (using the regional definitions shown in Figure 1, earlier) based on the sample of wind power projects built from 2014 through 2017—a 4-year period that Figure 35 shows to be relatively stable in terms of the nationwide average capacity factors.
39

vk.com/id446425943
2018 Wind Technologies Market Report
Capacity Factor in 2018
55%
50% |
Sample includes projects built from 2014 to 2017 |
|
|
|||
|
|
|
|
|
||
45% |
|
|
|
|
|
|
40% |
|
|
|
|
|
|
35% |
|
|
|
|
|
|
30% |
|
|
|
|
|
|
25% |
|
|
|
|
|
|
20% |
|
|
|
|
|
|
15% |
|
|
|
Weighted Average (by region) |
||
10% |
|
|
|
|||
|
|
|
Weighted Average (total U.S.) |
|||
5% |
|
|
|
|||
|
|
|
Individual Project (by region) |
|||
0% |
|
|
|
|||
Northeast |
Southeast |
Great Lakes |
West |
Interior |
||
|
||||||
|
723 MW |
381 MW |
2,353 MW |
762 MW |
24,406 MW |
|
Source: Berkeley Lab
Figure 37. Calendar year 2018 capacity factors by region: 2014–2017 projects only
Four of the five regions have a rather limited sample, due to the fact that 85% of the total capacity installed from 2014 to 2017 was located in the Interior region. Nonetheless, generation-weighted average capacity factors appear to be highest in the Interior region (43.1%) and the lowest in the Northeast (31.3%), with the Southeast (33.0%), Great Lakes (35.8%), and West (36.6%) falling in between.44 Even within these regions, however, there is still considerable spread.
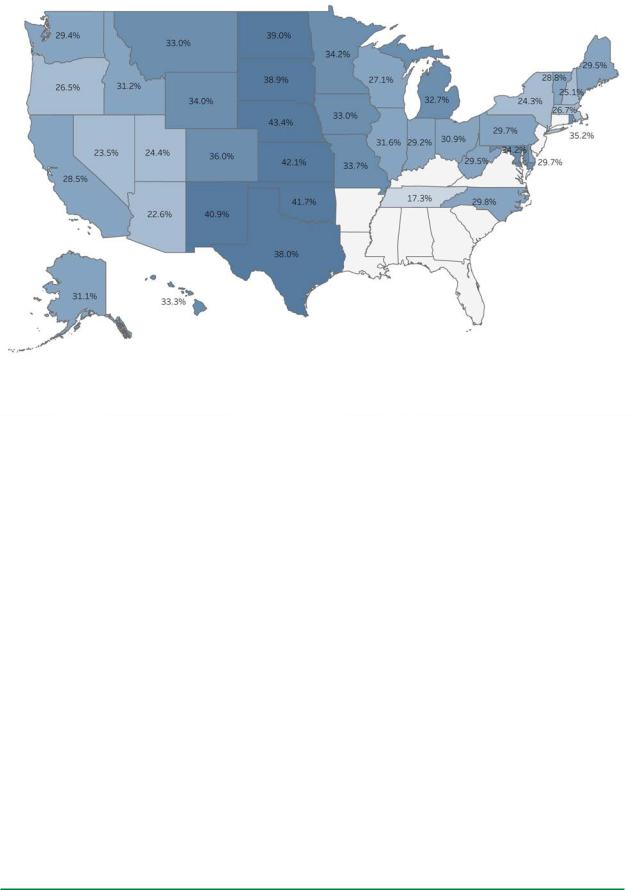
Figure 38 includes data on the full sample of projects built from 1998 through 2017, but breaks things down further by showing average state-level capacity factors in 2018. The overall range runs from 17%–43%, with a notable amount of variation even among states within the same region.
44 Care should be taken in extrapolating these results, given the relatively small sample size in some regions, as well as the possibility that certain regions may have experienced a particularly good or bad wind resource year or different levels of wind energy curtailment in 2018.
40
vk.com/id446425943
2018 Wind Technologies Market Report
Source: Berkeley Lab
Figure 38. Average 2018 capacity factors by state: 1998–2017 projects
As shown earlier in Chapter 4, the rate of adoption of turbines with taller towers and lower specific power ratings has varied by region. For example, Figure 29 (earlier) shows a greater preponderance of tall towers in the Great Lakes and Northeast regions than elsewhere, while Figure 30 shows lower specific power turbines being most prevalent in the Great Lakes and Interior regions. The relative degree to which projects in each region have employed these turbine design options (which is driven, in part, by the wind resource conditions in each region) influences, to some extent, their capacity factors shown in Figure 37 and Figure 38.
Turbine design and site characteristics influence performance, with declining specific power leading to sizable increases in capacity factor
The trends in average capacity factor by commercial operation date seen in Figure 35 can largely be explained by several underlying influences described in Chapter 4 and shown again in Figure 39. First, there has been a trend toward progressively lower specific power and higher hub heights. Second, there was a progressive build-out of lower-quality wind resource sites through 2012, followed by deployment at more energetic sites thereafter. Finally, as shown later, project age itself could be a fourth driver, given the possible degradation in performance among older projects.
The first two of these influences—the decline in average specific power and the increase in average hub height among more recent turbine vintages—have already been well-documented in Chapter 4. They are shown again in Figure 39 in index form, relative to projects built in 1998–1999 (with specific power shown in the inverse, to correlate with capacity factor movements). All else equal, a lower specific power will boost capacity factors, because there is more swept rotor area available (resulting in greater energy capture) for each watt of rated turbine capacity. This means that the generator is likely to run closer to or at its rated capacity more often. Meanwhile, at sites with positive wind shear, increasing turbine hub heights can help the rotor to access higher wind speeds. Counterbalancing the decline in specific power and the increase in hub height, however, has been
41

vk.com/id446425943
2018 Wind Technologies Market Report
a tendency to build new wind projects in lower-quality resource areas,45 especially among projects installed from 2009 through 201246 as shown by the wind resource quality index in Figure 39. This trend reversed course in 2013 and 2014, and has largely held steady since then, though with a dip in 2017 and 2018.
Average Capacity Factor in 2018
55% |
Index of Built Turbine Hub Height (right scale) |
|
|
|
|
|
|
180 |
99=100)- |
||||
Weighted-Average Capacity Factor in 2018 (left scale) |
|
|
|
|
|
|
|
||||||
50% |
Index of the Inverse of Built Specific Power (right scale) |
|
|
|
|
|
170 |
|
|||||
45% |
Index of Built Wind Resource Quality at 80m (right scale) |
|
|
|
|
|
160 |
(1998 |
|||||
40% |
|
|
|
|
|
150 |
|||||||
|
|
|
|
|
|
||||||||
|
|
|
|
|
|
|
|
|
|
Influences |
|||
35% |
|
|
|
|
|
|
|
|
|
|
140 |
||
30% |
|
|
|
|
|
|
|
|
|
|
130 |
||
|
|
|
|
|
|
|
|
|
|
|
|||
25% |
|
|
|
|
|
|
|
|
|
|
120 |
Factor |
|
20% |
|
|
|
|
|
|
|
|
|
|
110 |
||
|
|
|
|
|
|
|
|
|
|
|
|||
15% |
|
|
|
|
|
|
|
|
|
|
100 |
Capacity |
|
10% |
|
|
|
|
|
|
|
|
|
|
90 |
||
|
|
|
|
|
|
|
|
|
|
|
|||
5% |
|
|
|
|
|
|
|
|
|
|
80 |
of |
|
0% |
|
|
|
|
|
|
|
|
|
|
70 |
||
2000-01 |
2002-03 |
2004-05 |
2006 2007 2008 2009 2010 2011 2012 |
2013 |
2014 |
2015 |
2016 |
2017 |
2018 |
Index |
|||
1998-99 |
|
||||||||||||
|
|
|
|
Commercial Operation Date |
|
|
|
|
|
|
|
||
Note: In order to have all three indices be directionally consistent with their influence on capacity factor, this figure indexes the inverse of specific power (i.e., a decline in specific power causes the index to increase rather than decrease).
Source: Berkeley Lab
Figure 39. 2018 capacity factors and various drivers by commercial operation date
In Figure 39, the significant improvement in average 2018 capacity factors from among those projects built in 1998–2001 to those built in 2004–2005 is driven by both an increase in hub height and a decline in specific power, despite a shift toward somewhat-lower-quality wind resource sites. The stagnation in average capacity factors that subsequently persists through 2011-vintage projects reflects relatively flat trends in both hub height and specific power, coupled with an ongoing decline in wind resource quality at built sites. Finally, the sharp increase in average capacity factors among projects built after 2011 is driven by a steep reduction in average specific power coupled with a marked improvement in the quality of wind resource sites. (Average hub height increased modestly over this period.) Looking ahead to 2019, projects with commercial operation dates in 2018 could possibly record higher capacity factors on average than those built in 2017, in light of a slight reduction in average specific power coupled with an uptick in average hub height, while average site quality held steady.
45As described earlier relating to Figure 27 (with further details found in the Appendix), estimates of wind resource quality are based on site estimates of gross capacity factor at 80 meters, as derived from nationwide wind resource maps created for NREL by AWS Truepower. We index the values to those projects built in 1998–1999.
46The text immediately preceding Figure 27 lists several possible explanations for the buildout of less-energetic sites from 2009 to 2012, including the availability of the Section 1603 grant.
42
vk.com/id446425943
2018 Wind Technologies Market Report |
|
|
|
|
|
|
|
|
|
|
|
|
|
|
|
|
|
To help disentangle the primary and sometimes |
|
|
|
|
|
|
|
|
|
|
|
|
|
|
|
|
|
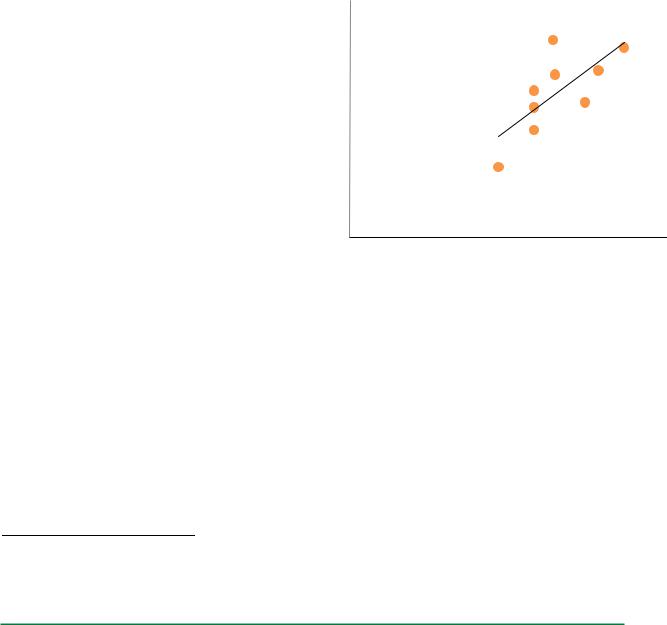
First wave of partial repowering demonstrates higher |
|||||||||||||||||
competing influences of turbine design |
|||||||||||||||||
|
capacity factors from lower specific power |
|
|
||||||||||||||
evolution and wind resource quality on capacity |
|
|
|
||||||||||||||
factor, Figure 40 controls for each. Across the |
Nine projects totaling 2.2 GW partially repowered their turbines in |
||||||||||||||||
x-axis, projects are grouped into four different |
|||||||||||||||||
2017, increasing rotor size in all nine cases and boosting turbine |
|
|
|||||||||||||||
categories, depending on the wind resource |
|
|
|||||||||||||||
capacity in two of the nine cases (all nine projects re-used the |
|
|
|||||||||||||||
quality estimated for each site. Within each |
|
|
|||||||||||||||
existing towers, resulting in no change to hub height). |
|
|
|
|
|||||||||||||
wind resource category, projects are further |
|
|
|
|
|||||||||||||
|
|
|
|
|
|
|
|
|
|
|
|
|
|
|
|
||
differentiated by their specific power. As one |
For each of these projects, the figure below shows the increase in |
||||||||||||||||
would expect, projects sited in higher wind |
capacity factor in 2018 (relative to the 4-year average from 2013 to |
||||||||||||||||
speed areas generally realized higher capacity |
2016; 2017 is omitted) as a function of the reduction in average |
|
|
||||||||||||||
factors in 2018 than those in lower wind speed |
specific power (itself a reflection of increased blade length). Not |
||||||||||||||||
areas, regardless of specific power. Likewise, |
surprisingly, those projects that reduced specific power the most |
||||||||||||||||
within each of the four wind resource categories |
generally saw the largest boost in capacity factor. |
|
|
|
|
||||||||||||
along the x-axis, projects that fall into a lower |
Factor |
|
|
|
|
|
|
|
|
|
|
|
|
|
|
|
|
specific power range realized significantly |
7% |
|
|
|
|
|
|
|
|
|
|
|
|
|
|
||
|
|
|
|
|
|
|
|
|
|
|
|
|
|
||||
higher capacity factors in 2018 than those in a |
|
|
|
|
|
|
|
|
|
|
|
|
|
|
|
||
higher specific power range. |
6% |
|
|
|
|
|
|
|
|
|
|
|
|
|
|
||
Capacity |
|
|
|
|
|
|
|
|
|
|
|
|
|
|
|||
|
|
|
|
|
|
|
|
|
|
|
|
|
|
||||
As a result, it is clear that turbine design |
5% |
|
|
|
|
|
|
|
|
|
|
|
|
|
|
||
changes (specifically, lower specific power, but |
|
|
|
|
|
|
|
|
|
|
|
|
|
|
|||
|
|
|
|
|
|
|
|
|
|
|
|
|
|
|
|||
in |
|
|
|
|
|
|
|
|
|
|
|
|
|
|
|
||
also, to a lesser extent, higher hub heights) are |
4% |
|
|
|
|
|
|
|
|
|
|
|
|
|
|
||
Increase |
|
|
|
|
|
|
|
|
|
|
|
|
|
|
|||
driving realized capacity factors higher among |
|
|
|
|
|
|
|
|
|
|
|
|
|
|
|||
|
|
|
|
|
|
|
|
|
|
|
|
|
|
|
|||
projects located within a given wind resource |
3% |
|
|
|
|
|
|
|
|
|
|
|
|
|
|
||
regime. This finding is further illustrated in the |
|
|
|
|
|
|
|
|
|
|
|
|
|
|
|||
|
|
|
|
|
|
|
|
|
|
|
|
|
|
|
|||
Point |
|
|
|
|
|
|
|
|
|
|
|
|
|
|
|
||
side bar on this page, as well as in Figure 41, |
2% |
|
|
|
|
|
|
|
|
|
|
|
|
|
|
||
which again groups projects into the same four |
|
|
|
|
|
|
|
|
|
|
|
|
|
|
|||
different categories of wind resource quality, |
Percentage |
1% |
|
|
|
|
|
|
|
|
|
|
|
|
|
|
|
and then reports average realized 2018 capacity |
|
|
|
|
|
|
|
|
|
|
|
|
|
|
|||
|
|
|
|
|
|
|
|
|
|
|
|
|
|
|
|||
factors by commercial operation date within |
0% |
|
|
|
|
|
|
|
|
|
|
|
|
|
|
||
each category.47 As before, projects sited in |
|
|
|
|
|
|
|
|
|
|
|
|
|
|
|||
|
|
20 |
40 |
60 |
80 |
100 |
120 |
||||||||||
higher wind speed areas have, on average, |
|
0 |
|||||||||||||||
higher capacity factors. More importantly, |
|
|
|
|
|
Reduction in Specific Power (W/m2) |
|
|
|||||||||
although there is some variability in the year-to- |
Note: All capacity factor data used in this graph are corrected for inter-annual |
||||||||||||||||
year trends, it is clear that within each of the |
|||||||||||||||||
four wind resource categories there has been an |
variability in the wind resource (see Appendix for normalization methodology). |
||||||||||||||||
|
|
|
|
|
|
|
|
|
|
|
|
|
|
|
|
||
improvement in capacity factors over time, by |
Within this chapter, these nine projects are omitted from all graphs |
||||||||||||||||
commercial operation date. In other words, the |
in 2017 (the year in which the partial repowering occurred) as well |
||||||||||||||||
fleet-wide improvement in capacity factors by |
as from most graphs in 2018 (due to difficulties in appropriately |
|
|
||||||||||||||
project vintage shown above in Figure 35 is |
characterizing their vintage), with the exception of both Figure 36 |
||||||||||||||||
seen across all four wind resource bins, and is |
and Figure 40, where vintage is not a consideration. |
|
|
|
|
||||||||||||
not simply a result of shifting toward more- |
|
|
|
|
|
|
|
|
|
|
|
|
|
|
|
|
|
|
|
|
|
|
|
|
|
|
|
|
|
|
|
|
|
||
energetic sites over time (in fact, Figure 27 and Figure 39 above show the opposite—i.e., that the wind industry has generally built out less-energetic sites over time).
47 The figure only includes those data points representing at least three projects in any single resource-year pair. In years where insufficient sample size prohibits the inclusion of a data point (e.g., in 2013), dashed lines are used to interpolate from the prior year to the subsequent year.
43

vk.com/id446425943
2018 Wind Technologies Market Report
Average Capacity Factor in 2018
50% |
|
|
|
|
|
|
|
|
|
|
|
|
|
|
|
|
|
|
|
|
|
|
|
|
|
|
|
45% |
|
|
|
|
|
|
|
|
|
|
|
|
|
|
|
|
|
|
|
|
|
|
|
|
|
|
|
40% |
|
|
|
|
|
|
|
|
|
|
|
|
|
|
|
|
|
|
|
|
|
|
|
|
|
|
|
35% |
|
|
|
|
|
|
|
|
|
|
|
|
|
|
|
|
|
|
|
|
|
|
|
|
|
|
|
30% |
|
|
|
|
|
|
|
|
|
|
|
|
|
|
|
|
|
|
|
|
|
|
|
|
|
|
|
25% |
|
|
|
|
|
|
|
|
|
|
|
|
|
|
|
|
|
|
|
|
|
|
|
|
|
|
|
20% |
|
|
|
|
|
|
|
|
|
|
|
|
|
|
|
|
|
|
|
|
|
|
|
|
|
|
|
15% |
|
|
|
|
|
|
|
|
|
Specific Power≥400(2.9GW) |
|
||
|
|
|
|
|
|
|
|
|
|
||||
|
|
|
|
|
|
|
|
|
Specific Power range of 350–400 (6.1 GW) |
|
|||
|
|
|
|
|
|
|
|
|
|
||||
|
|
|
|
|
|
|
|
|
|
|
|||
10% |
|
|
|
|
|
|
|
|
|
Specific Power range of 300–350 (35.6 GW) |
|
||
|
|
|
|
|
|
|
|
|
|
||||
|
|
|
|
|
|
|
|
|
|
||||
5% |
|
|
|
|
|
|
|
|
|
Specific Power range of 250–300 (21.7 GW) |
|
||
|
|
|
|
|
|
|
|
|
|
||||
|
|
|
|
|
|
|
|
|
|
||||
|
|
|
|
|
|
|
|
|
Specific Power < 250 (19.6 GW) |
|
|||
0% |
|
|
Lower |
|
|
|
|
|
|
|
|||
|
|
|
|
|
|
|
|
|
|||||
|
|
|
Medium |
|
|
|
|
Higher |
|
Highest |
|
||
|
|
|
|
|
|
|
|
|
|
||||
|
|
|
16.8 GW |
|
18.9 GW |
|
|
|
|
25.6 GW |
|
24.7 GW |
|
Estimated Wind Resource Quality at Site
Note: See the Appendix for details on how the wind resource quality at each individual project site is estimated. Source: Berkeley Lab
Figure 40. Calendar year 2018 capacity factors by wind resource quality and specific power: 1998-2017 projects
Average Capacity Factor in 2018
50%
45%
40%
35%
30%
25%
20%
15% |
|
|
|
|
Highest Wind Resource Quality |
|
|
|
|
|
Higher Wind Resource Quality |
|
|
|
|
|
|
|
||
10% |
|
|
|
|
|
|
|
|
|
|
Medium Wind Resource Quality |
|
|
|
|
|
|
|
||
|
|
|
|
|
||
5% |
|
|
|
|
|
|
|
|
|
|
Lower Wind Resource Quality |
|
|
|
|
|
||||
|
|
|
|
|
|
|
0% 1998-2000-2002-2004- 2006 2007 2008 2009 2010 2011 2012 2013 2014 2015 2016 2017
99 |
01 |
03 |
05 |
Commercial Operation Date |
|
|
|
|
Source: Berkeley Lab
Figure 41. Calendar year 2018 capacity factors by commercial operation date and wind resource quality
44
vk.com/id446425943
2018 Wind Technologies Market Report
Wind curtailment can differentially impact project performance across sites and regions
Curtailment of wind project output results from transmission inadequacy and other forms of grid and generator inflexibility. For example, over-generation can occur when wind generation is high but transmission capacity is insufficient to move excess generation to other load centers, or thermal generators cannot feasibly ramp down any further or quickly enough. This can push local wholesale power prices negative, thereby potentially triggering curtailment for economic reasons.
Curtailment might be expected to increase as wind energy penetrations rise, though as shown in Figure 42, this has not always been the case. For example, the Southwest Power Pool (SPP) has the highest wind penetration rate of any of the ISOs shown in Figure 42, yet just 1.3% of potential wind energy generation within the SPP region was curtailed in 2018—down from 2.8% in 2017, and below the curtailment levels in several other ISOs with much lower wind penetration rates.
Moreover, in areas where curtailment has been particularly acute in the past—principally in Texas—steps taken to address the issue have significantly reduced curtailment, even as wind penetration has increased. For example, Figure 42 shows that just 0.5% of potential wind energy generation within the main Texas grid (ERCOT) was curtailed in 2014, down sharply from 17% in 2009, roughly 8% in both 2010 and 2011, and nearly 4% in 2012. This decline in curtailment corresponds to the significant build-out of new transmission serving West Texas (collectively referred to as the Competitive Renewable Energy Zone upgrades), most of which were completed by the end of 2013. Since 2014, however, wind penetration has continued to increase in ERCOT, and so too has wind curtailment, rising to an average of 2.5% in 2018.48
|
20% |
|
|
|
|
|
|
25% |
|
|
18% |
|
|
|
Wind Curtailment (left axis) |
20% load) |
|||
|
16% |
|
|
|
Wind Penetration (right axis) |
||||
Wind Curtailment |
14% |
|
|
|
|
|
|
|
Penetration (as a % of |
12% |
|
|
|
|
|
|
15% |
||
10% |
|
|
|
|
|
|
|
||
8% |
|
|
|
|
|
|
10% |
||
6% |
|
|
|
|
|
|
|
||
|
4% |
|
|
|
|
|
|
5% |
Wind |
|
2% |
|
|
|
|
|
|
|
|
|
|
|
|
|
|
|
|
|
|
|
0% |
|
|
|
|
|
|
0% |
|
|
2014-18 |
2007-18 2009-18 |
2015-18 2012-18 2014-18 2012-18 2007-18 |
|
|||||
|
SPP |
ERCOT |
MISO |
CAISO |
NYISO |
ISO-NE |
PJM |
Total |
|
Notes: All curtailment percentages shown in the figure represent both forced and economic curtailment. PJM's 2012 curtailment estimate is for June through December only. For each year, the total reflects only those ISOs for which we have curtailment data.
Sources: ERCOT, MISO, CAISO, NYISO, PJM, ISO-NE, SPP
Figure 42. Wind curtailment and penetration rates by ISO
Though SPP and ERCOT have by far the highest wind penetration rates, other ISOs are also experiencing wind curtailment to varying degrees. The California Independent System Operator (CAISO) and PJM both
48 This 2.5% ERCOT-wide average masks a long tail on the distribution of individual project-level curtailment, with 11 projects (totaling nearly 1.4 GW) curtailed more than 10% and four of those projects (totaling nearly 600 MW) curtailed 18%–25% in 2018.
45

vk.com/id446425943
2018 Wind Technologies Market Report
experienced only negligible wind curtailment in 2018, but curtailment was more significant within the Midcontinent Independent System Operator (MISO), ISO New England (ISO-NE) and the New York Independent System Operator (NYISO) at 4.2%, 2.8% and 1.7%, respectively. The overall wind power curtailment rate in 2018 across all seven regions shown in Figure 42 was 2.2%. Curtailment rates for all regions include both “forced” (i.e., required by the grid operator for reliability reasons) and “economic” (i.e., voluntary as a result of wholesale market prices) curtailment.
Obviously, wind power curtailment reduces capacity factors. Sample-wide capacity factors in 2018 would have been on the order of 0.7 percentage points higher nationwide absent curtailment in just these seven ISOs.49
Temporal variations in wind speed also impact performance
The strength of the wind resource varies from year to year; moreover, the degree of inter-annual variation differs from site to site (and, hence, also region to region). This temporal and spatial variation, in turn, impacts project performance from year to year. Figure 43 shows national and regional indices of the historical interannual variability in the wind resource among the U.S. fleet over time.50 Though inter-annual variation has, at times, exceeded +/-20% at the regional level, geographical averaging has enabled nationwide variation to remain within +/-10%. More recently, for the third year in a row, wind speeds across the continental United States in 2018 were generally close to their long-term averages, both within each region and on average across all regions (separate data presented by AWS Truepower (2019) tells a similar story).
Average Annual Wind Resource Indices (Long-TermAverage= 1.0)
1.3 |
West |
|
Interior |
||
|
||
1.2 |
Great Lakes |
|
Northeast |
||
|
||
|
Southeast |
|
1.1 |
National |
|
1.0 |
|
|
0.9 |
|
|
0.8 |
|
0.7
1999 |
2000 |
2001 |
2002 |
2003 |
2004 |
2005 |
2006 |
2007 |
2008 |
2009 |
2010 |
2011 |
2012 |
2013 |
2014 |
2015 |
2016 |
2017 |
2018 |
Source: Berkeley Lab; methodology behind the index of inter-annual variability is explained in the Appendix
Figure 43. Inter-annual variability in the wind resource by region and nationally
49The seven ISOs included in Figure 42 collectively contributed 84% of total U.S. wind generation in 2018. The estimated precurtailment sample-wide capacity factor would have been even higher if comprehensive curtailment data were available for all areas of the country.
50These indices estimate changes in the strength of the average regionor fleet-wide wind resource from year to year and are constructed from ERA5 reanalysis wind speed data for individual project locations by applying applicable wind turbine power curves and then aggregating up to the region or fleet level (see the Appendix for more details). Note that these indices of interannual variability differ from the AWS Truepower wind resource quality data presented elsewhere, in that the former show variability from year to year across the entire region or fleet, while the latter focuses on the multi-year long-term average wind resource at specific wind project sites.
46
vk.com/id446425943
2018 Wind Technologies Market Report
Wind project performance degradation may also explain why older projects did not perform as well in 2018
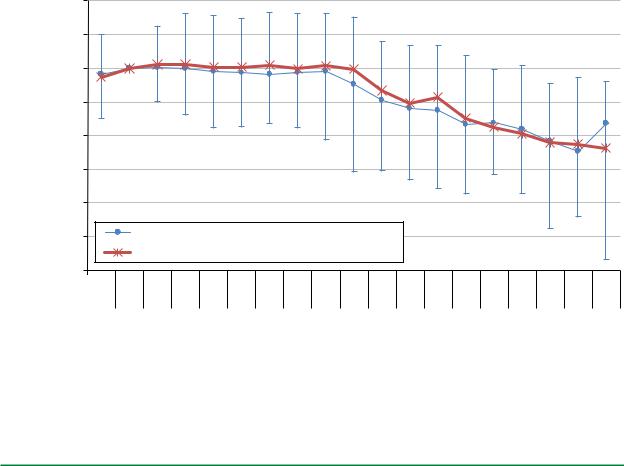
One final variable that could be influencing the apparent improvement in capacity factors in 2018 among more recent projects is project age. If wind turbine (and project) performance tends to degrade over time, then older projects—e.g., those built from 1998 to 2001—may have performed worse in 2018 than more recent projects simply due to their relative age. Figure 44 explores this question by graphing both median (with 10th and 90th percentile bars) and capacity-weighted average “weather-normalized” (i.e., to correct for inter-annual variability in the strength of the wind resource) capacity factors over time. Here, time is defined as the number of full calendar years after each individual project’s commercial operation date (COD), and each project’s capacity factor is indexed to 100% in year two in order to focus solely on changes to each project’s capacity factor over time, rather than on absolute capacity factor values. Year two is chosen as the index base, rather than year 1, to reflect the initial production ramp-up period that is commonly experienced by wind projects as they work through and resolve initial “teething” issues during their first year of operations.
Figure 44 suggests some amount of performance degradation, though perhaps only once projects age beyond 9 or 10 years. Potential drivers of any such degradation might include a change in how projects are operated once they age beyond the 10-year PTC window, less-rigorous maintenance protocols following the expiration of warranties and initial service agreements, and/or more frequent component failures and downtime as equipment ages. All of these potential drivers are, in turn, affected by the terms and conditions embedded within power purchase agreements (PPAs)—e.g., whether the PPA includes an availability and/or performance guarantee. Whatever the cause, the decline in capacity factors as projects age could partially explain why, for example, in Figure 36 the sample-wide capacity factors in 2000 and 2001 exceeded 31.5%, while in Figure 35 the projects built in 2000–2001 posted average capacity factors of just 24% in 2018.
2=100%) |
120% |
|
|
|
|
|
|
|
|
|
|
|
|
|
|
|
|
|
|
|
110% |
|
|
|
|
|
|
|
|
|
|
|
|
|
|
|
|
|
|
|
|
(Year |
|
|
|
|
|
|
|
|
|
|
|
|
|
|
|
|
|
|
|
|
100% |
|
|
|
|
|
|
|
|
|
|
|
|
|
|
|
|
|
|
|
|
|
|
|
|
|
|
|
|
|
|
|
|
|
|
|
|
|
|
|
|
|
Factor |
90% |
|
|
|
|
|
|
|
|
|
|
|
|
|
|
|
|
|
|
|
80% |
|
|
|
|
|
|
|
|
|
|
|
|
|
|
|
|
|
|
|
|
Capacity |
|
|
|
|
|
|
|
|
|
|
|
|
|
|
|
|
|
|
|
|
70% |
|
|
|
|
|
|
|
|
|
|
|
|
|
|
|
|
|
|
|
|
|
|
|
|
|
|
|
|
|
|
|
|
|
|
|
|
|
|
|
|
|
Indexed |
50% |
Sample includes projects with COD from 1998 to 2017 |
|
|
|
|
|
|
|
|
|
|||||||||
|
Median (with 10th/90th percentile error bars) |
|
|
|
|
|
|
|
|
|||||||||||
|
60% |
|
|
|
|
|
|
|
|
|
|
|
|
|
|
|
|
|
|
|
|
|
|
Capacity-Weighted Average |
|
|
|
|
|
|
|
|
|
|
|
||||||
|
40% |
1 |
2 |
3 |
4 |
5 |
6 |
7 |
8 |
9 |
10 |
11 |
12 |
13 |
14 |
15 |
16 |
17 |
18 |
19 |
Years post-COD: |
||||||||||||||||||||
|
Sample GW: 79.5 |
79.8 |
71.5 |
63.3 |
58.1 |
57.1 |
43.5 |
37.7 |
32.4 |
23.2 |
14.6 |
8.8 |
8.0 |
5.1 |
4.2 |
2.9 |
1.7 |
0.8 |
0.8 |
|
Source: Berkeley Lab
Figure 44. Post-COD changes in capacity factors over time suggest performance degradation
Although these suppositions surrounding Figure 44 are intriguing and worthy of further study, a number of caveats are in order. First, the sample is not the same in each year. The sample shrinks as the number of postCOD years increases, and is increasingly dominated by older projects using older turbine technology that may not be representative of today’s turbines. Second, as with all figures presented in this chapter, turbine decommissioning is accounted for by adjusting the nameplate project capacity as appropriate over time (all the
47

vk.com/id446425943
2018 Wind Technologies Market Report
way to zero if a project is fully decommissioned), such that each figure, including Figure 44, shows the performance of those turbines that are operating in each period, rather than relative to the original nameplate capacity of the overall project. Similarly, repowered projects are considered to be new projects in the year in which the repowered capacity comes online.
Taken together, Figure 35 through Figure 44 suggest that, in order to understand trends in empirical capacity factors, one needs to consider (and ideally control for) a variety of factors. These include not only wind power curtailment and the evolution in turbine design, but also a variety of spatial and temporal wind resource considerations—such as the quality of the wind resource where projects are located, inter-year wind resource variability, and even project age.
48