


vk.com/id446425943
1 Introduction
Wind power capacity additions in the United States continued at a robust pace in 2018. Recent and projected near-term growth is supported by the industry’s primary federal incentive—the production tax credit (PTC)— having been extended (with a phase-out schedule) through 2019 as well as a myriad of state-level policies.
Continued improvements in the cost and performance of wind power technologies have also driven wind capacity additions, yielding low-priced wind energy for utility, corporate, and other power purchasers. At the same time, the magnitude of growth beyond the current PTC cycle remains uncertain, given declining federal tax support, expectations for continued low natural gas prices, increasing competition from solar, and modest electricity demand growth.
This annual report—now in its thirteenth consecutive year—provides an overview of developments and trends in the U.S. wind power market, with a particular focus on the year 2018. The report begins with an overview of installation-related trends: U.S. wind power capacity growth; how that growth compares to other countries and generation sources; the amount and percentage of wind energy in individual U.S. states; and the quantity of proposed wind power capacity in various interconnection queues in the United States. Next, the report covers an array of wind industry trends: developments in turbine manufacturer market share; manufacturing and supply-chain developments; wind turbine and component imports into and exports from the United States; project financing developments; and trends among wind power project owners and power purchasers. The report then turns to a summary of wind turbine technology trends: turbine size, hub height, rotor diameter, specific power, and International Electrotechnical Commission (IEC) Class. After that, the report discusses wind power performance, cost, and pricing. In doing so, it describes trends in project-level capacity factors, wind turbine transaction prices, installed project costs, and operations and maintenance (O&M) expenses. It also reviews the prices paid for wind power through power purchase agreements (PPAs) and how those prices compare to the value of wind generation in wholesale energy markets as well as forecasts of future natural gas prices. Next, the report examines market and policy factors impacting the domestic wind industry, including federal and state policy as well as transmission and grid integration issues. The report concludes with a preview of possible near-term market developments based on the findings of other energy analysts.
Many of these trends vary by state or region, depending in part on the strength of the local wind resource. To that end, Figure 1 superimposes the boundaries of five broad regions on a map of average annual U.S. wind speed at 80 meters above the ground.3 These five regions will be referenced on many occasions throughout this report, whenever regional breakdowns or analysis is warranted, so they are defined here. Note that any such breakdowns, regional or otherwise, may not always add up to 100% due to rounding.
This edition of the annual report updates data presented in previous editions while highlighting trends and new developments that were observed in 2018. The report concentrates on larger, utility-scale wind turbines, defined here as individual turbines that exceed 100 kW in size.4 The U.S. wind power sector is multifaceted, and also includes smaller, customer-sited wind turbines used to power residences, farms, and businesses. Further information on distributed wind power, which includes smaller wind turbines as well as the use of larger turbines in distributed applications, is available through a separate annual report funded by the U.S.
3The regional boundaries shown in Figure 1 have been delineated in an attempt to simultaneously satisfy three goals: have a relative uniformity in average annual wind speed within each individual region, include enough states in each region to enable sufficient wind project sample size for regional breakdowns and analysis, and adhere as closely as possible to traditional regional boundaries.
4This 100-kW threshold between “smaller” and “larger” wind turbines is applied starting with 2011 projects to better match the American Wind Energy Association’s historical methodology, and is also justified by the fact that the U.S. tax code makes a similar distinction. In years prior to 2011, different cut-offs are used to better match AWEA’s reported capacity numbers and to ensure that older utility-scale wind power projects in California are not excluded from the sample.
1

vk.com/id446425943
2018 Wind Technologies Market Report
Department of Energy (DOE)—the 2018 Distributed Wind Market Report.5 Additionally, because this report has a historical focus—and because only one offshore wind project is operational in the United States—this report does not address trends in offshore wind power. A companion study funded by DOE that focuses exclusively on offshore wind power is also available—the 2018 Offshore Wind Technologies Market Report.6
Sources: AWS Truepower, National Renewable Energy Laboratory (NREL)
Figure 1. Regional boundaries overlaid on a map of average annual wind speed at 80 meters
Much of the data included in this report were compiled by DOE’s Lawrence Berkeley National Laboratory (Berkeley Lab) from a variety of sources, including the U.S. Energy Information Administration (EIA), the Federal Energy Regulatory Commission (FERC), and the American Wind Energy Association (AWEA). The Appendix provides a summary of the many data sources. In some cases, the data shown represent only a sample of actual wind power projects installed in the United States; furthermore, the data vary in quality. Emphasis should therefore be placed on overall trends, rather than on individual data points. Finally, each section of this report primarily focuses on historical and recent data. With some limited exceptions—including the final section of the report—the report does not seek to forecast wind energy trends.
5See: https://energy.gov/eere/wind/downloads/2018-distributed-wind-market-report
6See: https://energy.gov/eere/wind/downloads/2018-offshore-wind-market-report
2

vk.com/id446425943
2018 Wind Technologies Market Report
2 Installation Trends
Wind power additions continued at a robust pace in 2018, with 7,588 MW of new capacity added in the United States and $11 billion invested
U.S. wind power capacity additions equaled 7,588 MW in 2018, up slightly from 2017 additions and bringing the cumulative total to 96,433 MW (Figure 2).7 This growth represented $11 billion of investment in new wind power project installations in 2018, for a cumulative investment total of roughly $196 billion since the beginning of the 1980s.8,9 Over 80% of the new wind power capacity installed in 2018 is located within the Interior region (as defined in Figure 1).
A new trend is that of partial wind project repowering, in which major components of turbines are replaced in order to access favorable tax incentives, increase energy production with more-advanced turbine technology, and extend project life. In addition to the newly installed wind capacity reported above, 1,312 MW of partial repowerings were completed in 2018 across 10 projects, down from the 2,133 MW of partial repowering across 13 projects completed in 2017. Upgrades and refurbishments often lead to increased rotor diameters and the replacement of major nacelle components, with fewer changes to tower heights and nameplate capacity.10
|
14 |
|
|
|
|
|
|
|
|
|
|
|
|
|
|
|
|
|
|
|
|
|
|
|
|
|
|
|
|
|
|
|
|
|
|
|
|
|
|
|
|
|
|
|
|
|
|
|
|
|
|
|
|
|
|
|
|
|
|
|
|
|
|
|
|
|
|
|
13 |
|
|
|
|
|
|
Southeast (annual, left scale) |
|
|
|
|
|
|
|
|
|
|
|
|
|
|
|
|
|
|
|
|
|
|
|
|
|
|
|
|
|
|
|
|
|
|
|
|
|||||||||||||||||||||||
|
|
|
|
|
|
|
|
|
|
|
|
|
|
|
|
|
|
|
|
|
|
|
|
|
|
|
|
|
|
|
|
|
|
|
|
|
|
|
|
|
|
|
|||||||||||||||||||||||||
|
|
|
|
|
|
|
Northeast (annual, left scale) |
|
|
|
|
|
|
|
|
|
|
|
|
|
|
|
|
|
|
|
|
|
|
|
|
|
|
|
|
|
|
|
|
|
|
|
|
||||||||||||||||||||||||
|
12 |
|
|
|
|
|
|
|
|
|
|
|
|
|
|
|
|
|
|
|
|
|
|
|
|
|
|
|
|
|
|
|
|
|
|
|
|
|
|
|
|||||||||||||||||||||||||||
|
|
|
|
|
|
|
|
|
|
|
|
|
|
|
|
|
|
|
|
|
|
|
|
|
|
|
|
|
|
|
|
|
|
|
|
|
|
|
|
|
|
|
|||||||||||||||||||||||||
|
|
|
|
|
|
|
|
|
|
|
|
|
|
|
|
|
|
|
|
|
|
|
|
|
|
|
|
|
|
|
|
|
|
|
|
|
|
|
|
|
|
|
|||||||||||||||||||||||||
(GW) |
11 |
|
|
|
|
|
|
Great Lakes (annual, left scale) |
|
|
|
|
|
|
|
|
|
|
|
|
|
|
|
|
|
|
|
|
|
|
|
|
|
|
|
|
|
|
|
|
|
||||||||||||||||||||||||||
|
|
|
|
|
|
|
|
|
|
|
|
|
|
|
|
|
|
|
|
|
|
|
|
|
|
|
|
|
|
|
|
|
|
|
|
|
|
|
|||||||||||||||||||||||||||||
10 |
|
|
|
|
|
|
West (annual, left scale) |
|
|
|
|
|
|
|
|
|
|
|
|
|
|
|
|
|
|
|
|
|
|
|
|
|
|
|
|
|
|
|
|
|
|||||||||||||||||||||||||||
|
|
|
|
|
|
|
|
|
|
|
|
|
|
|
|
|
|
|
|
|
|
|
|
|
|
|
|
|
|
|
|
|
|
|
|
|
|
|
|
|
|
||||||||||||||||||||||||||
9 |
|
|
|
|
|
|
|
|
|
|
|
|
|
|
|
|
|
|
|
|
|
|
|
|
|
|
|
|
|
|
|
|
|
|
|
|
|
|
|
|
|
|
|||||||||||||||||||||||||
Capacity |
|
|
|
|
|
|
Interior (annual, left scale) |
|
|
|
|
|
|
|
|
|
|
|
|
|
|
|
|
|
|
|
|
|
|
|
|
|
|
|
|
|
|
|
|
|
|
|
|
||||||||||||||||||||||||
8 |
|
|
|
|
|
|
|
|
|
|
|
|
|
|
|
|
|
|
|
|
|
|
|
|
|
|
|
|
|
|
|
|
|
|
|
|
|
|
|
|
|
|
|||||||||||||||||||||||||
|
|
|
|
|
|
|
|
|
|
|
|
|
|
|
|
|
|
|
|
|
|
|
|
|
|
|
|
|
|
|
|
|
|
|
|
|
|
|
|
|
|
||||||||||||||||||||||||||
|
|
|
|
|
|
|
|
|
|
|
|
|
|
|
|
|
|
|
|
|
|
|
|
|
|
|
|
|
|
|
|
|
|
|
|
|
|
|
|
|
|||||||||||||||||||||||||||
|
7 |
|
|
|
|
|
|
Total U.S. (cumulative, right scale) |
|
|
|
|
|
|
|
|
|
|
|
|
|
|
|
|
|
|
|
|
|
|
|
|
|
|
|
|
|
|
|
|
|
|
|||||||||||||||||||||||||
|
|
|
|
|
|
|
|
|
|
|
|
|
|
|
|
|
|
|
|
|
|
|
|
|
|
|
|
|
|
|
|
|
|
|
|
|
|
|
|
|
|
|
|||||||||||||||||||||||||
Annual |
6 |
|
|
|
|
|
|
|
|
|
|
|
|
|
|
|
|
|
|
|
|
|
|
|
|
|
|
|
|
|
|
|
|
|
|
|
|
|
|
|
|
|
|
|
|
|
|
|
|
|
|
|
|
|
|
|
|
|
|
|
|
|
|
|
|
|
|
|
|
|
|
|
|
|
|
|
|
|
|
|
|
|
|
|
|
|
|
|
|
|
|
|
|
|
|
|
|
|
|
|
|
|
|
|
|
|
|
|
|
|
|
|
|
|
|
|
|
|
|
|
|
|
|
|
|
|
|
|
|
|
|
|
|
||
|
|
|
|
|
|
|
|
|
|
|
|
|
|
|
|
|
|
|
|
|
|
|
|
|
|
|
|
|
|
|
|
|
|
|
|
|
|
|
|
|
|
|
|
|
|
|
|
|
|
|
|
|
|
|
|
|
|
|
|
|
|
|
|
|
|
||
5 |
|
|
|
|
|
|
|
|
|
|
|
|
|
|
|
|
|
|
|
|
|
|
|
|
|
|
|
|
|
|
|
|
|
|
|
|
|
|
|
|
|
|
|
|
|
|
|
|
|
|
|
|
|
|
|
|
|
|
|
|
|
|
|
|
|
|
|
|
|
|
|
|
|
|
|
|
|
|
|
|
|
|
|
|
|
|
|
|
|
|
|
|
|
|
|
|
|
|
|
|
|
|
|
|
|
|
|
|
|
|
|
|
|
|
|
|
|
|
|
|
|
|
|
|
|
|
|
|
|
|
|
|
|
|
|
|
4 |
|
|
|
|
|
|
|
|
|
|
|
|
|
|
|
|
|
|
|
|
|
|
|
|
|
|
|
|
|
|
|
|
|
|
|
|
|
|
|
|
|
|
|
|
|
|
|
|
|
|
|
|
|
|
|
|
|
|
|
|
|
|
|
|
|
|
|
|
|
|
|
|
|
|
|
|
|
|
|
|
|
|
|
|
|
|
|
|
|
|
|
|
|
|
|
|
|
|
|
|
|
|
|
|
|
|
|
|
|
|
|
|
|
|
|
|
|
|
|
|
|
|
|
|
|
|
|
|
|
|
|
|
|
|
|
3 |
|
|
|
|
|
|
|
|
|
|
|
|
|
|
|
|
|
|
|
|
|
|
|
|
|
|
|
|
|
|
|
|
|
|
|
|
|
|
|
|
|
|
|
|
|
|
|
|
|
|
|
|
|
|
|
|
|
|
|
|
|
|
|
|
|
|
|
|
|
|
|
|
|
|
|
|
|
|
|
|
|
|
|
|
|
|
|
|
|
|
|
|
|
|
|
|
|
|
|
|
|
|
|
|
|
|
|
|
|
|
|
|
|
|
|
|
|
|
|
|
|
|
|
|
|
|
|
|
|
|
|
|
|
|
|
2 |
|
|
|
|
|
|
|
|
|
|
|
|
|
|
|
|
|
|
|
|
|
|
|
|
|
|
|
|
|
|
|
|
|
|
|
|
|
|
|
|
|
|
|
|
|
|
|
|
|
|
|
|
|
|
|
|
|
|
|
|
|
|
|
|
|
|
|
|
|
|
|
|
|
|
|
|
|
|
|
|
|
|
|
|
|
|
|
|
|
|
|
|
|
|
|
|
|
|
|
|
|
|
|
|
|
|
|
|
|
|
|
|
|
|
|
|
|
|
|
|
|
|
|
|
|
|
|
|
|
|
|
|
|
|
|
1 |
|
|
|
|
|
|
|
|
|
|
|
|
|
|
|
|
|
|
|
|
|
|
|
|
|
|
|
|
|
|
|
|
|
|
|
|
|
|
|
|
|
|
|
|
|
|
|
|
|
|
|
|
|
|
|
|
|
|
|
|
|
|
|
|
|
|
|
|
|
|
|
|
|
|
|
|
|
|
|
|
|
|
|
|
|
|
|
|
|
|
|
|
|
|
|
|
|
|
|
|
|
|
|
|
|
|
|
|
|
|
|
|
|
|
|
|
|
|
|
|
|
|
|
|
|
|
|
|
|
|
|
|
|
|
|
0 |
|
|
|
|
|
|
|
|
|
|
|
|
|
|
|
|
|
|
|
|
|
|
|
|
|
|
|
|
|
|
|
|
|
|
|
|
|
|
|
|
|
|
|
|
|
|
|
|
|
|
|
|
|
|
|
|
|
|
|
|
|
|
|
|
|
|
1998 |
1999 |
2000 |
2001 |
2002 |
2003 |
2004 |
2005 |
2006 |
2007 |
2008 |
2009 |
2010 |
2011 |
2012 |
2013 |
2014 |
2015 |
2016 |
2017 |
2018 |
Source: AWEA WindIQ
Figure 2. Annual and cumulative growth in U.S. wind power capacity
98
91
84
77
70
63
56
49
42
35
28
21
14
7
0
Cumulative Capacity (GW)
As in previous years, growth was driven in part by continued improvements in the cost and performance of wind power technologies. State renewables portfolio standards (RPS) and corporate demand also played a role.
7When reporting annual wind power capacity additions, this report focuses on gross capacity additions, and does not consider partial repowering. The net increase in capacity each year can be somewhat lower, reflecting turbine decommissioning, or higher, reflecting partial repowering that increases nameplate capacities. Reported cumulative capacity does include both decommissioning and repowering.
8All cost and price data are reported in real 2018 dollars.
9These investment figures are based on an extrapolation of the average project-level capital costs reported later in this report and do not include investments in manufacturing facilities, research and development expenditures, or O&M costs; nor do they include investments to partially repowered plants.
10The 1,312 MW and 2,133 MW of partially repowered capacity reflect the initial capacity, prior to refurbishment. Any change in capacity from partial repowering is included in the cumulative data but not the annual data reported in Figure 2.
3

vk.com/id446425943
2018 Wind Technologies Market Report
A crucial factor was the PTC, which, in December 2015, was extended for an additional five years—applying to projects that begin construction before January 1, 2020, but with a progressive reduction in the value of the credit for projects starting construction after 2016. Meanwhile, the ability of partially repowered wind projects to access the PTC was the primary motivator for the growth in partial repowering in 2017 and 2018.
Wind power represented the third-largest source of U.S. electric-generating capacity additions in 2018, behind solar and natural gas
Wind power has comprised a sizable share of generation capacity additions in recent years. In 2018, it constituted 21% of all U.S. capacity additions and was the third-largest source of new capacity, behind solar and natural gas (Figure 3).11 Wind power’s share of overall annual capacity additions declined slightly in 2018 relative to 2017, largely due to a sizable increase in natural gas capacity additions.
Total Annual Capacity Additions (GW)
50
40
30
20
10
0 |
|
|
|
|
|
|
|
|
|
|
|
|
|
|
|
2009 |
2010 |
2011 |
2012 |
2013 |
|||||||||||
|
Wind |
|
Solar |
|
|
|
|
Other Renewable |
|||||||
|
|
|
|
|
|
||||||||||
|
|
|
|
|
|
|
|
|
|
|
|
|
|
|
|
|
50% |
|
|||
|
|
|
|
|
|
|
|
|
|
|
|
|
|
|
|
||||||
|
|
|
|
|
Wind % of Total (right axis) |
|
|||||||||||||||
|
|
|
|
|
|
|
|
|
|
|
|
|
|
|
|
|
40% |
CapacityWind Additions Shareas of Total |
|||
|
|
|
|
|
|
|
|
|
|
|
|
|
|
|
|||||||
|
|
|
|
|
|
|
|
|
|
|
|
|
|
10% |
|||||||
|
|
|
|
|
|
|
|
|
|
|
|
|
|
|
|
|
30% |
|
|||
|
|
|
|
|
|
|
|
|
|
|
|
|
|
|
|
|
|
|
|
20% |
|
|
|
|
|
|
|
|
|
|
|
|
|
|
|
|
|
|
|
|
|
|
|
|
|
|
|
|
|
|
|
|
|
|
|
|
|
|
|
|
|
0% |
|
||
|
|
|
|
|
|
|
|
|
|
|
|
|
|
|
|
|
|
|
|
||
2014 |
|
|
|
2015 |
|
|
2016 |
2017 |
2018 |
|
|
|
|
|
|
||||||
|
|
|
|
|
|
|
|
|
|
|
|
||||||||||
|
|
Gas |
|
|
|
|
Coal |
|
|
|
Other Non-Renewable |
||||||||||
|
|
|
|
|
|
|
|
||||||||||||||
|
|
|
|
|
|
|
|
|
|
|
|
|
|
|
|
|
|
|
|
|
|
Sources: ABB, AWEA WindIQ, GTM Research, Berkeley Lab
Figure 3. Relative contribution of generation types in annual capacity additions
Over the last decade, wind power represented 28% of total U.S. capacity additions, and an even larger fraction of new generation capacity in the Interior (56%) and Great Lakes (40%) regions (Figure 4; see Figure 1 for regional definitions). Wind power’s contribution to generation capacity growth over the last decade is somewhat smaller—but still significant—in the West (18%) and Northeast (13%), and considerably less in the Southeast (1%).
11 Data presented here are based on gross capacity additions, not considering retirements or partial repowering. Furthermore, they include only the 50 U.S. states, not U.S. territories.
4
vk.com/id446425943
2018 Wind Technologies Market Report
Additions (2009-2018)
Percentage of Generation Capacity
100% |
|
|
|
1% |
|
|
|
|
|
|
|
|
|
|
18% |
13% |
|
|
||
|
|
|
|
|||
|
|
28% |
||||
80% |
|
|
40% |
|||
|
|
|
|
|
||
|
|
|
|
|
||
|
|
56% |
|
|
|
|
60% |
|
|
|
|
|
|
|
|
|
|
|
|
|
40%
20%
0%
|
|
Interior |
Great Lakes |
West |
|
Northeast |
Southeast |
U.S. Total |
|||||||
|
|
|
|
|
|
|
|
|
|
|
|
|
|
||
|
|
Wind |
|
Solar |
|
|
Other Renewable |
|
Gas |
|
Coal |
|
Other Non-Renewable |
||
|
|
|
|
|
|
|
|||||||||
|
|
|
|
|
|
|
|
|
|
|
|
|
|
|
|
Sources: ABB, AWEA WindIQ, GTM Research, Berkeley Lab
Figure 4. Generation capacity additions by region (2009–2018)
Globally, the United States ranked second in annual wind capacity additions in 2018, but was well behind the market leaders in wind energy penetration
Global wind additions equaled roughly 50,100 MW in 2018: approximately 90% of which was land-based, with the remainder offshore wind. This figure is below the 53,500 MW in 2017 and below the record of 63,800 MW added in 2015. With its 7,588 MW representing 15% of new global installed capacity in 2018, the United States continued to maintain its second-place position behind China (Table 1). Cumulative global capacity grew by nearly 10% and totaled approximately 590,000 MW at the end of the year (GWEC 2019),12 with the United States accounting for 16% of global capacity—a distant second to China by this metric. The United States also remains in second place, behind China, in annual wind electricity generation.
12 Yearly and cumulative installed wind power capacity in the United States are from the present report, while global wind power capacity comes from GWEC (2019) but are updated, where necessary, with the U.S. data presented here. Some disagreement exists among these data sources and others.
5

vk.com/id446425943
2018 Wind Technologies Market Report
Table 1. International Rankings of Wind Power Capacity: Land-based and Offshore
|
Annual Capacity |
|
|
|
Cumulative Capacity |
|
||||
|
(2018, MW) |
|
|
|
(end of 2018, MW) |
|
||||
|
|
|
|
|
|
|
|
|
|
|
|
China |
|
|
21,855 |
|
|
China |
|
210,247 |
|
|
|
|
|
|
|
|
|
|
|
|
|
United States |
|
|
7,588 |
|
|
United States |
|
96,433 |
|
|
|
|
|
|
|
|
|
|
|
|
|
Germany |
|
|
3,371 |
|
|
Germany |
|
59,312 |
|
|
|
|
|
|
|
|
|
|
|
|
|
India |
|
2,191 |
|
|
India |
35,129 |
|
||
|
|
|
|
|
|
|
|
|
|
|
|
Brazil |
|
|
1,939 |
|
|
Spain |
|
23,531 |
|
|
|
|
|
|
|
|
|
|
|
|
|
United Kingdom |
|
|
1,901 |
|
|
United Kingdom |
|
20,964 |
|
|
|
|
|
|
|
|
|
|
|
|
|
France |
|
|
1,565 |
|
|
France |
|
15,309 |
|
|
|
|
|
|
|
|
|
|
|
|
|
Mexico |
|
|
929 |
|
|
Brazil |
|
14,707 |
|
|
|
|
|
|
|
|
|
|
|
|
|
Sweden |
|
720 |
|
|
Canada |
12,816 |
|
||
|
|
|
|
|
|
|
|
|
|
|
|
Canada |
|
|
566 |
|
|
Italy |
|
9,959 |
|
|
|
|
|
|
|
|
|
|
|
|
|
Rest of World |
|
|
7,493 |
|
|
Rest of World |
|
91,466 |
|
|
|
|
|
|
|
|
|
|
|
|
|
TOTAL |
|
|
50,118 |
|
|
TOTAL |
|
589,872 |
|
Sources: GWEC (2019, updated via personal communication); AWEA WindIQ for U.S.
A number of countries have achieved relatively high levels of wind energy penetration in their electricity grids. Figure 5 presents data on a subset of countries, focusing on those with greater levels of total wind power capacity. Wind penetration exceeded 40% in Denmark in 2018, and was between 20% and 30% in Ireland, Portugal, and Germany. In the United States, wind supplied 6.5% of total electricity generation in 2018 (see Table 2 for additional details).
Generation as a Proportion of |
Electricity Generation in 2018 |
Wind |
Total |
50%
40%
30%
20%
10%
0%
China
India
Mexico
Italy
Canada
France
Australia
United States
Poland
Belgium
Turkey
Brazil
Netherlands
Austria
Romania
Sweden
EU
U.K.
Spain
Germany
Portugal
Ireland
Denmark
Source: AWEA (2019a)
Figure 5. Wind energy penetration in subset of countries with the greatest installed wind power capacity
6

vk.com/id446425943
2018 Wind Technologies Market Report
Texas installed the most capacity in 2018 with 2,359 MW, while fourteen states exceeded 10% wind energy penetration as a fraction of total in-state generation
New utility-scale wind turbines were installed in 20 states in 2018. Texas once again installed the most new wind capacity of any state, adding 2,359 MW. As shown in Figure 6 and in Table 2, other leading states—in terms of new capacity—included Iowa, Colorado, Oklahoma, Nebraska, Kansas, and Illinois.
On a cumulative basis, Texas remained the clear leader, with 24,895 MW installed at the end of 2018—almost three times as much as the next-highest state (Iowa, with 8,421 MW). In fact, Texas has more wind capacity than all but four countries (including the United States). States distantly following Texas in cumulative installed capacity include Iowa and Oklahoma (both with more than 8,000 MW), as well as California and Kansas (both with more than 5,000 MW). Thirty-five states, plus Puerto Rico, had more than 100 MW of wind capacity as of the end of 2018, with 26 of these above 500 MW, 19 above 1,000 MW, 12 above 2,000 MW, and 11 above 3,000 MW.
Note: Numbers within states represent MegaWatts of cumulative installed wind capacity and, in brackets, annual additions in 2018.
Figure 6. Location of wind power development in the United States
Some states have reached high levels of wind energy penetration. The right half of Table 2 lists the top 20 states based on actual wind electricity generation in 2018 divided by total in-state electricity generation and by in-state electricity sales in 2018. Electric transmission networks enable most states to both import and export power in real time, and states do so in varying amounts. Denominating in-state wind generation as both a proportion of in-state generation and as a proportion of in-state sales is relevant, but both should be viewed with some caution given varying amounts of imports and exports. As a fraction of in-state generation, Kansas leads the list, with 36.4% of electricity generated in the state coming from wind, followed by Iowa, Oklahoma, North Dakota, and South Dakota. As a fraction of in-state sales, North Dakota is the leading state, with 53.5%
7

vk.com/id446425943
2018 Wind Technologies Market Report
of the electricity sold in the state being met by wind, followed by Kansas, Oklahoma, and Iowa (all above 40%). Fourteen states have achieved wind penetration levels of 10% or higher when expressed as a percentage of generation, whereas 15 states have reached this threshold when expressed as a percentage of sales.
|
|
|
|
|
Table 2. U.S. Wind Power Rankings: The Top 20 States |
|
|
|
|
|
|||||||
|
|
|
|
|
|
|
|
|
|
|
|
|
|
|
|
|
|
|
|
Installed Capacity (MW) |
|
|
|
|
2018 Wind Generation as a Percentage of: |
||||||||||
|
|
|
|
|
|
|
|
|
|
|
|
|
|
|
|
|
|
|
Annual (2018) |
|
Cumulative (end of 2018) |
|
|
In-State Generation |
In-State Sales |
||||||||||
|
|
|
|
|
|
|
|
|
|
|
|
|
|
|
|
|
|
|
Texas |
|
2,359 |
|
Texas |
|
24,895 |
|
|
Kansas |
|
36.4% |
|
North Dakota |
|
53.5% |
|
|
|
|
|
|
|
|
|
|
|
|
|
|
|
|
|
|
|
|
Iowa |
|
1,120 |
|
Iowa |
|
8,421 |
|
|
Iowa |
|
33.7% |
|
Kansas |
|
47.1% |
|
|
|
|
|
|
|
|
|
|
|
|
|
|
|
|
|
|
|
|
Colorado |
|
600 |
|
Oklahoma |
|
8,072 |
|
|
Oklahoma |
|
31.7% |
|
Oklahoma |
|
43.4% |
|
|
|
|
|
|
|
|
|
|
|
|
|
|
|
|
|
|
|
|
Oklahoma |
|
576 |
|
California |
|
5,840 |
|
|
North Dakota |
|
25.8% |
|
Iowa |
|
43.2% |
|
|
|
|
|
|
|
|
|
|
|
|
|
|
|
|
|
|
|
|
Nebraska |
|
558 |
|
Kansas |
|
5,653 |
|
|
South Dakota |
|
24.4% |
|
New Mexico |
|
25.6% |
|
|
|
|
|
|
|
|
|
|
|
|
|
|
|
|
|
|
|
|
Kansas |
543 |
|
Illinois |
4,861 |
|
|
Maine |
21.0% |
|
Wyoming |
24.9% |
|
||||
|
|
|
|
|
|
|
|
|
|
|
|
|
|
|
|
|
|
|
Illinois |
529 |
|
Minnesota |
3,778 |
|
|
New Mexico |
18.7% |
|
South Dakota |
21.7% |
|
||||
|
|
|
|
|
|
|
|
|
|
|
|
|
|
|
|
|
|
|
California |
330 |
|
Colorado |
3,703 |
|
|
Minnesota |
17.9% |
|
Maine |
21.0% |
|
||||
|
|
|
|
|
|
|
|
|
|
|
|
|
|
|
|
|
|
|
Indiana |
200 |
|
Oregon |
3,213 |
|
|
Colorado |
17.3% |
|
Texas |
18.6% |
|
||||
|
|
|
|
|
|
|
|
|
|
|
|
|
|
|
|
|
|
|
New York |
158 |
|
North Dakota |
3,155 |
|
|
Texas |
15.9% |
|
Colorado |
17.5% |
|
||||
|
|
|
|
|
|
|
|
|
|
|
|
|
|
|
|
|
|
|
North Dakota |
|
148 |
|
Washington |
|
3,076 |
|
|
Vermont |
|
15.8% |
|
Minnesota |
|
17.0% |
|
|
|
|
|
|
|
|
|
|
|
|
|
|
|
|
|
|
|
|
Ohio |
113 |
|
Indiana |
2,317 |
|
|
Idaho |
14.7% |
|
Nebraska |
16.9% |
|
||||
|
|
|
|
|
|
|
|
|
|
|
|
|
|
|
|
|
|
|
Montana |
105 |
|
New York |
1,987 |
|
|
Nebraska |
14.1% |
|
Oregon |
15.0% |
|
||||
|
|
|
|
|
|
|
|
|
|
|
|
|
|
|
|
|
|
|
Minnesota |
90 |
|
Nebraska |
1,972 |
|
|
Oregon |
11.0% |
|
Montana |
14.9% |
|
||||
|
|
|
|
|
|
|
|
|
|
|
|
|
|
|
|
|
|
|
New Mexico |
51 |
|
Michigan |
1,904 |
|
|
Wyoming |
9.0% |
|
Idaho |
10.8% |
|
||||
|
|
|
|
|
|
|
|
|
|
|
|
|
|
|
|
|
|
|
Michigan |
44 |
|
New Mexico |
1,732 |
|
|
Montana |
7.9% |
|
Illinois |
9.1% |
|
||||
|
|
|
|
|
|
|
|
|
|
|
|
|
|
|
|
|
|
|
South Dakota |
|
41 |
|
Wyoming |
|
1,488 |
|
|
Illinois |
|
6.8% |
|
Washington |
|
8.2% |
|
|
|
|
|
|
|
|
|
|
|
|
|
|
|
|
|
|
|
|
Rhode Island |
|
21 |
|
Pennsylvania |
|
1,369 |
|
|
California |
|
6.5% |
|
Vermont |
|
7.1% |
|
|
|
|
|
|
|
|
|
|
|
|
|
|
|
|
|
|
|
|
Massachusetts |
|
2 |
|
South Dakota |
|
1,019 |
|
|
Washington |
|
6.3% |
|
Hawaii |
|
5.8% |
|
|
|
|
|
|
|
|
|
|
|
|
|
|
|
|
|
|
|
|
Alaska |
|
1 |
|
Idaho |
|
973 |
|
|
Indiana |
|
5.0% |
|
Indiana |
|
5.6% |
|
|
|
|
|
|
|
|
|
|
|
|
|
|
|
|
|
|
|
|
Rest of U.S. |
|
0 |
|
Rest of U.S. |
|
7,005 |
|
|
Rest of U.S. |
|
1.1% |
|
Rest of U.S. |
|
1.5% |
|
|
|
|
|
|
|
|
|
|
|
|
|
|
|
|
|
|
|
|
TOTAL |
|
7,588 |
|
TOTAL |
|
96,433 |
|
|
TOTAL |
|
6.5% |
|
TOTAL |
|
7.3% |
|
Note: Based on 2018 wind and total generation and retail sales by state from EIA’s Electric Power Monthly. Sources: AWEA WindIQ, EIA
Given the ability to trade power across state boundaries, estimates of wind penetration within entire multi-state markets operated by the major independent system operators (ISOs) are also relevant. In 2018, wind penetration (expressed as a percentage of load) was 23.9% in the Southwest Power Pool (SPP), 18.6% in the Electric Reliability Council of Texas (ERCOT), 7.3% in both the Midcontinent Independent System Operator (MISO) and the California Independent System Operator (CAISO), 2.8% in ISO New England (ISO-NE), 2.7% in the PJM Interconnection (PJM), and 2.5% in the New York Independent System Operator (NYISO).
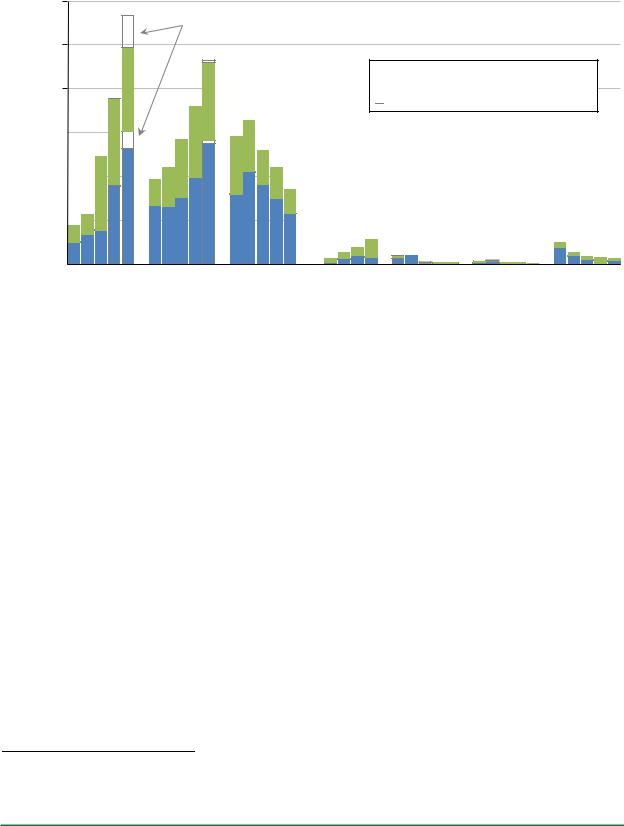
A record level of wind power capacity entered transmission interconnection queues in 2018; solar and storage also reached new highs in 2018
One testament to the amount of developer and purchaser interest in wind energy is the amount of wind power capacity working its way through the major transmission interconnection queues across the country. Figure 7 provides this information over the last five years for wind power and other resources aggregated across 37 different interconnection queues administered by independent system operators (ISOs), regional transmission organizations (RTOs), and utilities.13 These data should be interpreted with caution: placing a project in the
13 The queues surveyed include PJM, MISO, NYISO, ISO-NE, CAISO, ERCOT, SPP, Western Area Power Administration (WAPA), Bonneville Power Administration (BPA), Tennessee Valley Authority (TVA), and a large number of other individual utilities. To provide a sense of sample size and coverage, the ISOs, RTOs, and utilities whose queues are included here have an aggregated non-coincident (balancing authority) peak demand of over 80% of the U.S. total. Figures 7 and 8 only include projects that were
8
vk.com/id446425943
2018 Wind Technologies Market Report
interconnection queue is a necessary step in project development, but being in the queue does not guarantee that a project will be built (often, fewer than 25% of projects are subsequently built).
Capacity in Queues at Year-End (GW)
300
250
200
150
100
50
0
Hatched portion indicates the amount paired with storage (2018 only)

 Entered queues in the year shown


 Entered queues in an earlier year
|
|
|
|
|
|
|
|
|
|
|
|
|
|
|
|
|
|
|
|
|
|
|
|
|
|
|
|
|
|
|
|
|
|
|
|
|
|
|
|
|
|
|
|
|
|
|
|
|
|
|
|
|
|
|
|
|
|
|
|
|
|
|
|
|
|
|
|
|
|
|
|
|
|
|
|
|
|
|
|
|
|
|
|
|
|
|
|
|
|
|
|
|
|
|
|
|
|
|
|
|
|
|
|
|
|
|
|
|
|
|
|
|
|
|
|
|
|
|
|
|
|
|
|
|
|
|
|
|
|
|
|
|
|
|
|
|
|
|
|
|
|
|
|
|
|
|
|
|
|
|
|
|
|
|
|
|
|
|
|
|
|
|
|
|
|
|
|
|
|
|
|
|
|
|
|
|
|
|
|
|
|
|
|
|
|
|
|
|
|
|
|
|
|
|
|
|
|
|
|
|
|
|
|
|
|
|
|
|
|
|
|
|
|
|
|
|
|
|
|
|
|
|
|
|
|
|
|
|
|
|
|
|
|
|
|
|
|
|
|
|
|
|
|
|
|
|
|
|
|
|
|
|
|
|
|
|
|
|
|
|
|
|
|
|
|
|
|
|
|
|
|
|
|
|
|
|
|
|
|
|
|
|
|
|
|
|
|
|
|
|
|
|
|
|
|
|
|
|
|
|
|
|
|
|
|
|
|
|
|
|
|
|
|
|
|
|
|
|
|
|
|
|
|
|
|
|
|
|
|
|
|
|
|
|
|
|
|
|
|
|
|
|
|
|
|
|
|
|
|
|
|
|
|
|
|
|
|
|
|
|
|
|
|
|
|
|
|
|
|
|
|
|
|
|
|
|
|
|
|
|
|
|
|
|
|
|
|
|
|
|
|
|
|
|
|
|
|
|
|
|
|
|
|
|
|
|
|
|
|
|
|
|
|
|
|
|
|
|
|
|
|
|
|
|
|
|
|
|
|
|
|
|
|
|
|
|
|
|
|
|
|
|
|
|
|
|
|
|
|
|
|
|
|
|
|
|
|
|
|
|
|
|
|
|
|
|
|
|
|
|
|
|
|
|
|
|
|
|
|
|
|
|
|
|
|
|
|
|
|
|
|
|
|
|
|
|
|
|
|
|
|
|
|
|
|
|
|
|
|
|
|
|
|
|
|
|
|
|
|
|
|
|
|
|
|
|
|
|
|
|
|
|
|
|
|
|
|
|
|
|
|
|
|
|
|
|
|
|
|
|
|
|
|
|
|
|
|
|
|
|
|
|
|
|
|
|
|
|
|
|
|
|
|
|
|
|
|
|
|
|
|
|
|
|
|
|
|
|
|
|
|
|
|
|
|
|
|
|
|
|
|
|
|
|
|
|
|
|
|
|
|
|
|
|
|
|
|
|
|
|
|
|
|
|
|
|
|
|
|
|
|
|
|
|
|
|
|
|
|
|
|
|
|
|
|
|
|
|
|
|
|
|
|
|
|
|
|
|
|
|
|
|
|
|
|
|
|
|
|
|
|
|
|
|
|
|
|
|
|
|
|
|
|
|
|
|
|
|
|
|
|
|
|
|
|
|
|
|
|
|
|
|
|
|
|
|
|
|
|
|
|
|
|
|
|
|
|
|
|
|
|
|
|
|
|
|
|
|
|
|
|
|
|
|
|
|
|
|
|
|
|
|
|
|
|
|
|
|
|
|
|
|
|
|
2014 |
2015 |
2016 |
2017 |
2018 |
|
|
2014 |
2015 |
2016 |
2017 |
2018 |
|
|
2014 |
2015 |
2016 |
|
2017 |
2018 |
|
2014 |
2015 |
2016 |
2017 |
2018 |
|
|
2014 |
2015 |
2016 |
2017 |
2018 |
|
2014 |
2015 |
2016 |
2017 |
2018 |
|
2014 |
2015 |
2016 |
2017 |
2018 |
||||||||||||
|
|
|
Solar |
|
|
Wind |
|
|
Gas |
|
|
Storage |
|
Nuclear |
|
|
|
Coal |
|
|
|
|
Other |
||||||||||||||||||||||||||||||||||
Notes: Data on hybrid projects paired with storage were not collected for years prior to 2018. Additionally, the ‘storage’ data for 2018 reflects stand-alone storage (not hybrid plants), whereas for years prior to 2018 the storage data also include some hybrid facilities.
Source: Exeter Associates and Berkeley Lab review of interconnection queues
Figure 7. Generation capacity in 37 selected interconnection queues from 2014 to 2018, by resource type
Even with this important caveat, the amount of wind capacity in the nation’s interconnection queues still provides at least some indication of the amount of planned development. At the end of 2018, there were 232 GW of wind power capacity in the interconnection queues reviewed for this report—a sizable increase from the 180 GW in the same queues just one year earlier and more than at any point since the end of 2011. In fact, a record level of wind power capacity entered interconnection queues in 2018 (at least since 2009, when Berkeley Lab started collecting queue data)—92 GW in total, exceeding the previous record of 81 GW in 2017. Wind was not the only technology to reach a new record in 2018, however, as solar additions outpaced wind, at 133 GW. Storage additions have also increased in recent years. Moreover, for 2018, hybrid plants that include storage are also presented. As shown, 20% of the solar capacity in interconnection queues at the end of 2018 has been proposed as hybrid plants paired with storage, whereas only 2% of the wind capacity is paired with storage. Overall, wind represented 36% of all capacity in the sampled queues, compared to 44% for solar, 13% for natural gas, and 4% for stand-alone storage.
The wind capacity in the interconnection queues is spread across the United States, as shown in Figure 8, with the largest amounts in SPP (25%), the Mountain region (16%), the Midwest (16%), ERCOT (11%), and PJM (10%). Smaller amounts are found in the Northwest (7%), ISO-NE (7%), NYISO (6%), and California (3%), with the Southeast currently having no wind projects in the sampled queues. The PJM, Mountain, and Midwest regions experienced especially large annual additions in 2018.
active in the queues at the times specified but that had not yet been built (or had a completed interconnection agreement); suspended projects are not included.
9

vk.com/id446425943
2018 Wind Technologies Market Report
Nameplate Wind Power Capacity (GW)
60 |
|
|
|
|
|
|
|
|
|
|
|
|
|
|
Entered queues in 2018 |
||
50 |
|
|
|
|
|
Entered queues in an earlier year |
||
|
|
|
|
|
|
|
|
|
|
|
Hatched portion indicates the amount paired with storage |
||||||
40 |
|
|
|
|
|
|
|
|
30 |
|
|
|
|
|
|
|
|
20 |
|
|
|
|
|
|
|
|
10 |
|
|
|
|
|
|
|
|
0 |
|
|
|
|
|
|
|
|
SPP |
Mountain |
Midwest |
ERCOT |
PJM |
Northwest |
ISO-NE |
NYISO |
California Southeast |
Source: Exeter Associates review of interconnection queues
Figure 8. Wind power capacity in 35 selected interconnection queues, by region
As additional measures of the near-term development pipeline, ABB (2019) estimates that, as of May 2019, approximately 49 GW of wind power capacity could be characterized in one of three ways: (a) under construction or in site preparation (10 GW); (b) in development and permitted (16 GW); or (c) in development with a pending permit and/or regulatory applications (23 GW). These totals are approximately 10 GW higher than at the same time last year. AWEA (2019b) reports that more than 39 GW of wind power capacity was under construction or at an advanced stage of development at the end of the first quarter of 2019. EIA (2019b) identifies nearly 22 GW of planned additions for 2019 and 2020 combined.
10