


vk.com/id446425943
2018 Wind Technologies Market Report
7 Wind Power Price Trends
Earlier sections documented trends in capacity factors, wind turbine prices, installed project costs, O&M costs, and project financing—all of which are determinants of the wind power purchase agreement (PPA) prices presented in this chapter. In general, higher-cost and/or lower-capacity-factor projects will require higher PPA prices, while lower-cost and/or higher-capacity-factor projects can have lower PPA prices.
Berkeley Lab collects data on wind PPA prices, resulting in a dataset that currently consists of 448 PPAs totaling 42,018 MW from wind projects that have either been built (from 1998 to the present) or are planned for installation later in 2019 or beyond. All of these PPAs bundle together the sale of electricity, capacity, and renewable energy certificates (RECs), and most of them have a utility as the counterparty.63
Except where noted, PPA prices are expressed throughout this chapter on a levelized basis over the full term of each contract, and are reported in real 2018 dollars.64 Whenever individual PPA prices are averaged together (e.g., within a region or over time), the average is generation-weighted.65 Whenever they are broken out by time, the date on (or year in) which the PPA was signed or executed is used, as that date provides the best indication (i.e., better than commercial operation date) of market conditions at the time. Finally, because the PPA prices in the Berkeley Lab sample are reduced by the receipt of state and federal incentives (e.g., the levelized PPA prices reported here would be at least $15/MWh higher without the PTC, ITC, or Treasury Grant66) and are influenced by various local policies and market characteristics, they do not directly represent wind energy generation costs. That said, we loosely estimate the levelized cost of energy for a large sample of U.S. wind projects in a later text box.
This chapter summarizes wind PPA prices in a number of different ways: by PPA execution date, by region, compared to solar PPA prices and future natural gas prices, and compared to past wholesale energy and capacity market value. In addition, REC prices are presented in a subsequent text box.
63Though we do have pricing details for some PPAs with corporate off-takers, in many cases such PPAs are synthetic or financial arrangements in which the project sponsor enters into a “contract for differences” with the corporate off-taker around an agreedupon strike price. Because the strike price is not directly linked to the sale of electricity, it is rarely disclosed (at least through traditional sources, like regulatory filings). Though only a minor omission historically, this distinction could limit our sample more severely in the future if corporate off-take agreements remain popular.
64Having full-term price data (i.e., pricing data for the full duration of each PPA, rather than just historical PPA prices) enables us to present these PPA prices on a levelized basis (levelized over the full contract term), which provides a complete picture of wind power pricing (e.g., by capturing any escalation over the duration of the contract). Contract terms range from 5 to 35 years, with 20 years being by far the most common (at 56% of the sample; 89% of contracts in the sample are for terms ranging from 15 to 25 years). Prices are levelized using a 7% real discount rate.
65Generation weighting is based on the empirical project-level performance data analyzed earlier in this report and assumes that historical project performance (in terms of annual capacity factor as well as daily and/or seasonal production patterns where necessary) will hold into the future as well. In cases where there is not enough operational history to establish a “steady-state” pattern of performance, we used discretion in estimating appropriate weights (to be updated in the future as additional empirical data become available).
66The estimated levelized PPA price impact of $15+/MWh is different from the PTC’s 2018 face value of $24/MWh for several reasons. First, the PTC is a 10-year credit, whereas most PPAs are for longer terms (e.g., 20 years). Second, the PTC is a tax credit, and must be converted to pre-tax equivalent terms before being compared to PPA prices. Finally, the presence of the PTC constrains financing choices for many wind project owners and drives up the project’s weighted average cost of capital. In other words, if not for the PTC, projects could be financed more cheaply; this difference in the weighted average cost of capital with and without the PTC erodes some of the PTC’s value (for more information, see Bolinger (2014)).
58
vk.com/id446425943
2018 Wind Technologies Market Report
Wind power purchase agreement prices are at historical lows
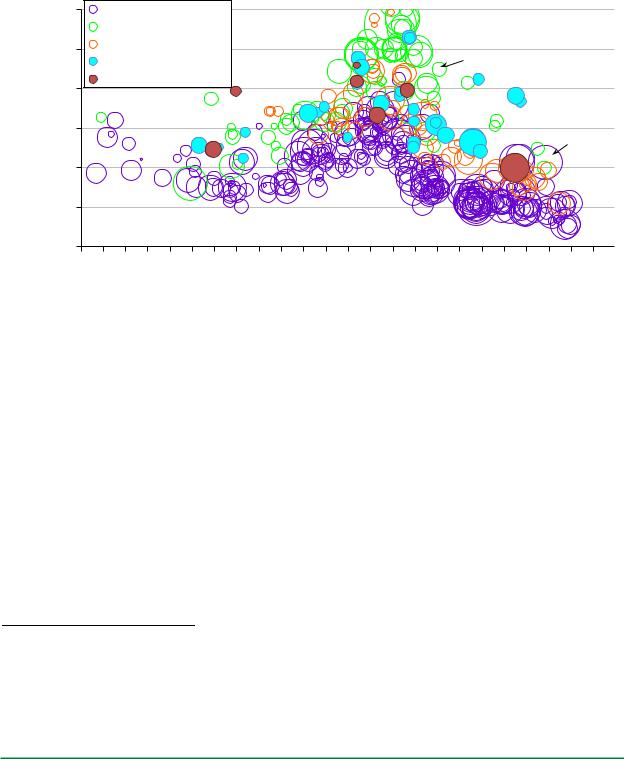
Figure 53 plots contract-level levelized wind power purchase agreement (PPA) prices by contract execution date, showing a clear decline in PPA prices since 2009–2010, both overall and by region.67 This trend is particularly evident in the Interior region, which tends to dominate the overall sample, particularly in recent years. As a result of its low average project costs and high average capacity factors shown earlier in this report, the Interior region also tends to be the lowest-priced region over time.68
|
$120 |
Interior (27.7 GW) |
|
|
|
|
|
|
|
|
|
|
|
|
|
|
|
|
|
|||||
$/MWh) |
|
West (7.4 GW) |
|
|
|
|
|
|
|
|
|
|
|
|
|
|
|
|
|
|
||||
$100 |
Great Lakes (4.8 GW) |
|
|
|
|
|
|
|
|
|
|
50 MW |
|
|
|
|
||||||||
Northeast (1.6 GW) |
|
|
|
|
|
|
|
|
|
|
|
|
|
|
|
|||||||||
|
|
|
|
|
|
|
|
|
|
|
|
|
|
|
|
|||||||||
|
Southeast (0.5 GW) |
|
|
|
|
|
|
|
|
|
|
|
|
|
|
|
|
|
||||||
(2018 |
$80 |
|
|
|
|
|
|
|
|
|
|
|
|
|
|
|
|
|
||||||
|
|
|
|
|
|
|
|
|
|
|
|
|
|
|
|
|
|
|
|
|
|
|
||
|
|
|
|
|
|
|
|
|
|
|
|
|
|
|
|
|
|
|
|
|
|
|
|
|
Price |
$60 |
|
|
|
|
|
|
|
|
|
|
|
|
|
|
|
|
|
|
|
|
|
300 MW |
|
|
|
|
|
|
|
|
|
|
|
|
|
|
|
|
|
|
|
|
|
|
|
|||
PPA |
$40 |
|
|
|
|
|
|
|
|
|
|
|
|
|
|
|
|
|
|
|
|
|
|
|
Levelized |
$20 |
|
|
|
|
|
|
|
|
|
|
|
|
|
|
|
|
|
|
|
|
|
|
|
$0 |
|
|
|
|
|
|
|
|
|
|
|
|
|
|
|
|
|
|
|
|
|
|
|
|
|
|
|
|
|
|
|
|
|
|
|
|
|
|
|
|
|
|
|
|
|
|
|
|
|
|
1996 |
1997 |
1998 |
1999 |
2000 |
2001 |
2002 |
2003 |
2004 |
2005 |
2006 |
2007 |
2008 |
2009 |
2010 |
2011 |
2012 |
2013 |
2014 |
2015 |
2016 |
2017 |
2018 |
2019 |
PPA Execution Date
Note: Area of “bubble” is proportional to contract nameplate capacity
Source: Berkeley Lab
Figure 53. Levelized wind PPA prices by PPA execution date and region (full sample)
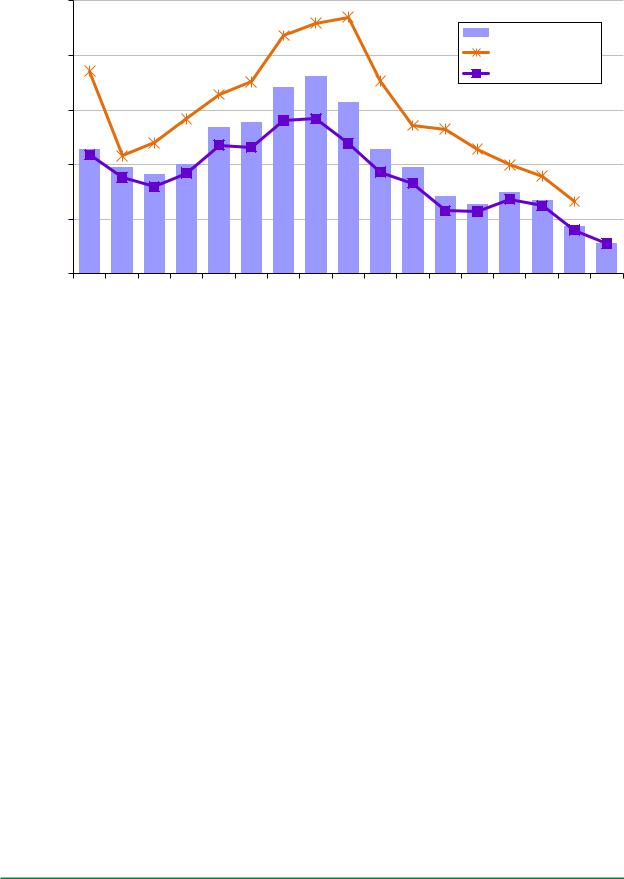
Figure 54 provides a smoother look at the time trend nationwide and regionally (for just the Interior region and all other regions combined) by averaging the individual levelized PPA prices shown in Figure 53 by year. After topping out above $70/MWh for PPAs executed in 2009, the national average levelized price of wind PPAs within the Berkeley Lab sample has dropped to below $20/MWh—though this nationwide average is admittedly focused on a sample of projects that largely hail from the lowest-priced Interior region of the country, where most of the new capacity built in recent years is located. Focusing only on the Interior region, the PPA price decline remains substantial, from an average of $57/MWh among contracts executed in 2009 to below $20/MWh in 2017 and 2018. Across all other regions, average PPA prices have been higher.
67Roughly 99% of the contracts that are depicted in Figure 48 are from projects that are already online. For the most part, only the most recent contracts in the sample are from projects that are not yet online.
68Regional differences can affect not only project capacity factors (depending on the strength of the wind resource in a given region), but also development and installation costs (depending on a region’s physical geography, population density, labor rates, or even regulatory processes). It is also possible that regions with higher wholesale electricity prices or with greater demand for renewable energy will, in general, yield higher wind energy contract prices due to market influences.
59
vk.com/id446425943
2018 Wind Technologies Market Report
$/MWh) |
$100 |
|
|
|
|
|
|
|
|
|
|
|
|
|
|
|
|
|
|
|
|
|
|
|
|
|
|
|
|
|
|
|
Nationwide |
|
|
||
$80 |
|
|
|
|
|
|
|
|
|
|
|
|
|
All Other Regions |
|
|||
Price (2018 |
|
|
|
|
|
|
|
|
|
|
|
|
|
|
||||
|
|
|
|
|
|
|
|
|
|
|
|
|
|
Interior |
|
|
||
$60 |
|
|
|
|
|
|
|
|
|
|
|
|
|
|
|
|
|
|
PPA |
|
|
|
|
|
|
|
|
|
|
|
|
|
|
|
|
|
|
Levelized |
$40 |
|
|
|
|
|
|
|
|
|
|
|
|
|
|
|
|
|
|
|
|
|
|
|
|
|
|
|
|
|
|
|
|
|
|
|
|
Average |
$20 |
|
|
|
|
|
|
|
|
|
|
|
|
|
|
|
|
|
|
|
|
|
|
|
|
|
|
|
|
|
|
|
|
|
|
|
|
|
$0 |
96-9900-0102-0304-05 2006 2007 2008 2009 2010 2011 2012 2013 2014 2015 2016 2017 2018 |
||||||||||||||||
PPA Year: |
||||||||||||||||||
|
GW: |
0.6 |
1.2 |
1.4 |
2.2 |
2.4 |
1.8 |
3.5 |
4.0 |
4.9 |
4.6 |
1.1 |
5.4 |
2.2 |
3.3 |
1.8 |
1.5 |
0.1 |
Source: Berkeley Lab
Figure 54. Generation-weighted average levelized wind PPA prices by PPA execution date and region
The trend of rising PPA prices from 2003 to 2009 and then falling prices since then is directionally consistent with the turbine price and installed project cost trends shown earlier in Chapter 6. In addition, the turbine scaling described in Chapter 4 has, on average, boosted the capacity factors of more recent projects, as documented in Chapter 5. Scaling has also enabled reductions in operating costs, as described in Chapter 6. This combination of declining CapEx and OpEx and improved performance—along with historically low interest rates (as shown earlier in Figure 17)—has driven wind PPA prices to today’s record-low levels.
Recent wind power purchase agreements are priced in the mid-teens in some cases
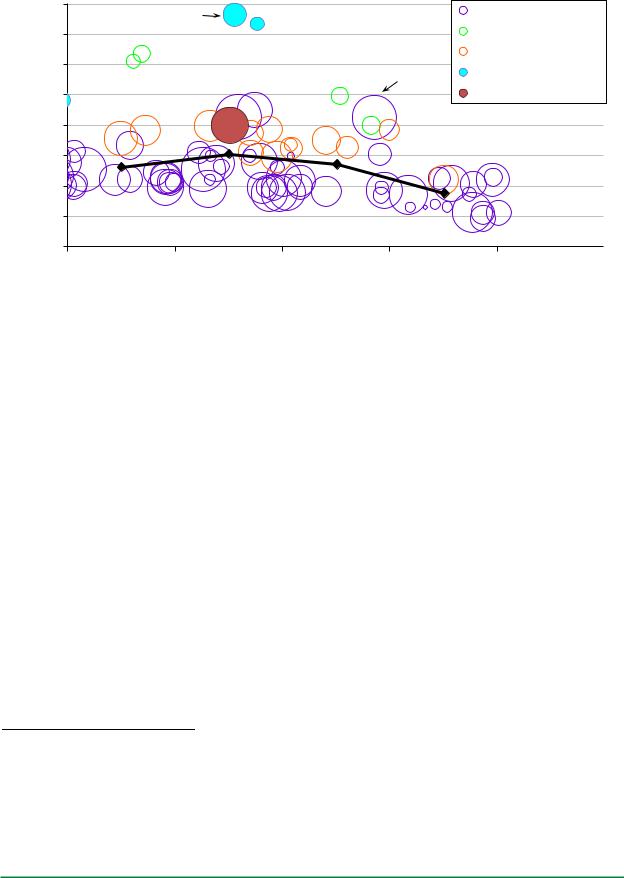
Other sources (e.g., LevelTen Energy 2019) have noted recently signed or offered wind PPAs that are priced significantly below $20/MWh—in some cases in the low-to-mid teens per MWh. Although we have yet to see data on many of these contracts, within our full current sample there are 16 projects (all in the Interior region) totaling 2,468 MW that sell their output through 22 different PPAs signed since early 2015, all with levelized pricing below $20/MWh. Figure 55 focuses only on wind PPA prices signed since 2014, to more-readily show these sub-$20/MWh PPAs. The levelized prices of these 22 PPAs range from $9.3/MWh to $19.7/MWh. Contract terms range from 15–35 years, with an average of 23.5 years.
60
vk.com/id446425943
2018 Wind Technologies Market Report
|
$80 |
80 MW |
|
|
Interior (11.6 GW) |
$/MWh) |
|
|
|
||
$60 |
|
|
West (0.5 GW) |
||
|
|
|
|||
|
$70 |
|
|
|
|
|
|
|
|
|
Great Lakes (1.7 GW) |
Price(2018 |
$40 |
|
|
300 MW |
Northeast (0.6 GW) |
|
|
|
Black line shows |
||
|
$50 |
|
|
|
Southeast (0.2 GW) |
PPA |
$30 |
|
|
|
nationwide average |
|
|
|
|
||
Levelized |
|
|
|
|
|
$20 |
|
|
|
|
|
|
|
|
|
|
|
|
$10 |
|
|
|
|
|
$0 |
|
|
|
|
|
2014 |
2015 |
2016 |
2017 |
2018 |
PPA Execution Date
Source: Berkeley Lab
Figure 55. Levelized wind PPA prices by PPA execution date and region (recent sample)
Despite ultra-low PPA prices, wind faces stiff competition from solar and gas
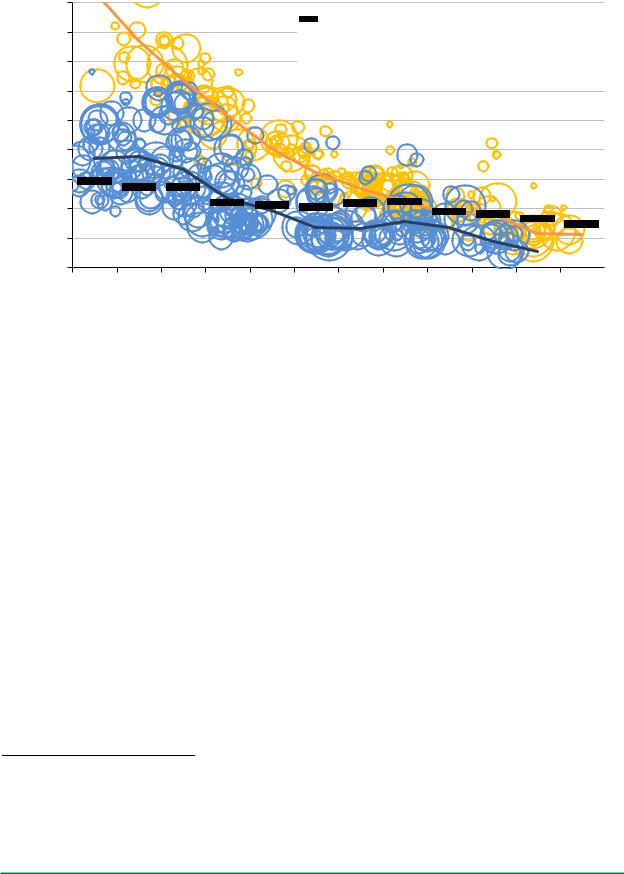
Figure 56 plots wind PPA prices against utility-scale solar PPA prices on a levelized basis since 2008 (the dashed blue and gold lines show the generation-weighted average wind and solar PPA prices in each year, respectively). Although the gap between wind and solar PPA prices was quite wide a decade ago, that gap has narrowed considerably in recent years, as solar prices have fallen more rapidly than wind prices.69
The figure also shows that wind PPA prices—and, more recently, utility-scale solar PPA prices—have been competitive with the projected fuel costs of gas-fired combined cycle generators over time. Specifically, the black dash markers show the 20-year levelized fuel costs (converted from natural gas to power terms at an assumed heat rate of 7.5 MMBtu/MWh) from then-current EIA projections of natural gas prices delivered to electricity generators.70 Supported by federal tax incentives, the generation-weighted average levelized wind and solar PPA prices within our contract sample have, for several years now, been below the projected levelized cost of burning natural gas in existing gas-fired combined cycle units.
69The solar PPA prices are sourced from Berkeley Lab’s “Utility-Scale Solar” report series (utilityscalesolar.lbl.gov).
70For example, the black dash marker in 2008 shows the 20-year levelized gas price projection from Annual Energy Outlook 2008, while the black dash in 2019 shows the same from Annual Energy Outlook 2019 (both converted to $/MWh terms at a constant heat rate of 7.5 MMBtu/MWh). The assumed heat rate is intended to reflect an average among the existing fleet of combined cycle generators, rather than the current best-in-class, which might be closer to 6.0-6.5 MMBtu/MWh. Price expectations reflected in NYMEX natural gas futures contracts might differ from the EIA projections used here, but the NYMEX futures strip extends only 12-13 years, compared to the 20-year term used in the figure.
61
vk.com/id446425943
2018 Wind Technologies Market Report
$/MWh) |
$180 |
|
$160 |
||
$140 |
||
(2018 |
||
$120 |
||
Price |
||
$100 |
||
Gas |
$80 |
|
and |
||
$60 |
||
PPA |
||
$40 |
||
Levelized |
||
$20 |
||
$0 |
||
|
Levelized 20-year EIA gas price projections (converted at 7.5 MMBtu/MWh)
 Utility-Scale Solar (252 PPAs totaling 15.7 GW)
  Utility-Scale Wind (310 PPAs totaling 32.4 GW)
2008 2009 2010 2011 2012 2013 2014 2015 2016 2017 2018 2019 Gas Projection Year and PPA Execution Date
Sources: Berkeley Lab, Energy Information Administration
Figure 56. Levelized wind and solar PPA prices and levelized gas price projections
Rather than levelizing the wind PPA prices and gas price projections, Figure 57 plots the future stream of wind PPA prices (the 10th, 50th, and 90th percentile prices are shown, along with a generation-weighted average) from PPAs executed in 2016–2018 against the EIA’s latest projections of just the fuel costs of natural gas-fired generation.71 As shown, the median and generation-weighted average wind PPA prices from contracts executed in the past three years are consistently below the low end of the projected natural gas fuel cost range, while the 90th percentile wind PPA prices are initially above the high end of the fuel cost range, but fall within the overall range by 2025.
71 The fuel cost projections come from the EIA’s Annual Energy Outlook 2019 publication, and increase from around $3.27/MMBtu in 2019 to $5.34/MMBtu (both in 2018 dollars) in 2050 in the reference case. The upper and lower bounds of the fuel cost range reflect the low (and high, respectively) oil and gas resource and technology cases. All fuel prices are converted from $/MMBtu into $/MWh using the heat rates implied by the modeling output (which start at roughly 8.0 MMBtu/MWh in 2019 and gradually decline to roughly 6.7 MMBtu/MWh by 2050).
62
vk.com/id446425943
2018 Wind Technologies Market Report
70 |
|
|
|
|
|
|
|
Generation-weighted average wind PPA price among 34 PPAs signed in 2016–2018 |
|
|
|
|
|
|
|
||||
|
|
|
|
|
|
||||
60 |
|
|
|
|
|
|
|
Median wind PPA price (and 10th/90th percentiles) among 34 PPAs signed in 2016–2018 |
|
|
|
|
|
|
|
|
|||
|
|
|
|
|
|
|
|
|
|
|
|
|
|
|
|
|
|
|
|
|
|
|
|
|
|
Range of AEO19 natural gas fuel cost projections |
|
||
|
|
|
|
|
|
|
|||
|
|
|
|
|
|
|
|
||
50 |
|
|
|
|
|
|
AEO19 reference case natural gas fuel cost projection |
|
|
|
|
|
|
|
|
|
|
|
|
|
|
|
|
|
|
|
|
|
|
|
|
|
|
|
|
|
|
|
|
$/MWh |
40 |
|
|
2018 |
30 |
|
|
|
20 |
|
10 |
|
0 |
|
2019 2020 2021 2022 2023 2024 2025 2026 2027 2028 2029 2030 2031 2032 2033 2034 2035 2036 2037 2038 2039 2040 2041 2042 2043 2044 2045 2046 2047 2048 2049 2050 |
Note: The 10th/90th percentile range narrows considerably in later years as the PPA sample dwindles
Sources: Berkeley Lab, Energy Information Administration
Figure 57. Wind PPA prices and natural gas fuel cost projections by calendar year over time
Figure 57 also hints at the long-term value that wind power might provide as a “hedge” against rising and/or uncertain natural gas prices. The wind PPA prices that are shown have been contractually locked in, whereas the fuel cost projections to which they are compared are highly uncertain. Actual fuel costs could ultimately be lower or much higher. Either way, as evidenced by the widening range of fuel cost projections over time, it becomes increasingly difficult to forecast fuel costs with any accuracy as the term of the forecast increases.
The economic competitiveness of wind energy is in part dictated by its grid-system value in wholesale power markets
In many regions of the country, wind energy participates in organized wholesale electricity markets for energy and, where available, capacity. In some cases, wind projects directly bid into those markets, and earn the prevailing market price. In other cases—especially when a PPA is in place—the wind energy purchaser will schedule the wind energy into the market, paying the wind project owner the pre-negotiated PPA price but earning revenue from the prevailing wholesale market price.
In either instance, the revenue earned (or that could have been earned) from the sale of wind into wholesale markets is reflective of the market value of that generation from the perspective of the electricity system. In the case of merchant wind projects, the link is direct and affects the revenue of the plant. In the case of wind projects sold under a PPA, on the other hand, the pre-negotiated PPA price establishes plant revenue and, depending of the specifics of the PPA, pricing may or may not be linked to wholesale market prices. In this latter case, however, the revenue earned or that would have been earned by the sale of wind in the wholesale market still reflects the underlying market value of that wind—but in this case, for the purchaser, in the form of an avoided cost. This is because wholesale electricity prices reflect the timing of when energy is cheap or expensive and embed the cost of transmission congestion and losses. A purchaser could, in theory, obtain power from the wholesale market instead of from a wind project. A wind project’s estimated revenue were it participating in the wholesale market therefore reflects costs avoided by the purchaser of wind under a PPA. This (potential) revenue—or value—can be segmented into “energy” market value and, where capacity markets or requirements exist, “capacity” value.
63

vk.com/id446425943
2018 Wind Technologies Market Report
Wholesale energy prices vary over time, and by location. Overall, these prices have fallen over the last decade, in large measure due to the decline in the price of natural gas (Wiser et al. 2017), though gas prices rebounded somewhat in both 2017 and 2018. Moreover, because wind power deployment is sometimes concentrated in areas with limited transmission capacity, wholesale energy prices at the local pricing nodes to which wind plants interconnect are often suppressed. Even absent transmission constraints, wind plants push local wholesale energy prices lower when wind output is high. More generally, the temporal profile of wind output is not always well aligned with system needs, potentially further reducing the energy market value of wind generation. Some of these tendencies apply equally well to wind’s capacity value, which is impacted by the cost of capacity but also by regional rules that define the credit that wind receives for providing capacity. In sum, these trends suggest that the wholesale energy and capacity value of wind may have declined over time, and may in general be somewhat lower than the energy and capacity market value of other generation sources.
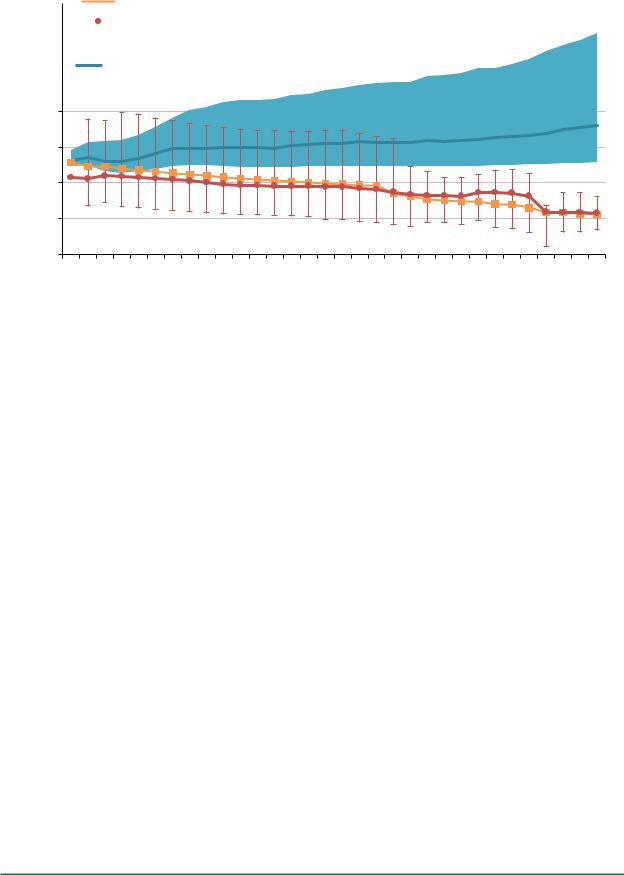
Figure 58 estimates the historical wholesale energy and capacity market value of wind across a number of different regions of the country. Specifically, we estimate the energy market value of wind using plant-level hourly wind output profiles and real-time hourly wholesale energy pricing patterns at the nearest pricing node (i.e., locational marginal prices, LMPs). Plant-level capacity values are estimated based on the relevant capacity price or cost for the region in question, and local rules for wind’s capacity credit.72 Energy and capacity are summed for each plant, and plant-level total value estimates are then averaged to estimate regional values. As a result, the analysis considers the output profile of wind, the location of wind, and how those characteristics interact with local wholesale energy and capacity prices and rules, ultimately yielding an estimate of the revenue that would have been earned had wind sold its output at the hourly LMP and also considering any available capacity-based revenue. The figure then contrasts those wholesale market value estimates for wind with nationwide generation-weighted average levelized wind PPA prices (with error bars denoting the 10th and 90th percentiles) based on the years in which the PPAs were executed. The comparison between market value estimates and PPA prices is relevant in as much as PPA prices reflect the cost of wind, whereas wholesale energy market value reflects a portion of the value of that wind generation.
These estimates show that the wholesale market value of wind has generally declined over the last decade and varies by region, but that there has been a modest rebound in value over the last two years as gas prices have trended upward. With the sharp drop in wholesale electricity prices and therefore market value of wind in 2009, average wind PPA prices tended to well-exceed the wholesale market value of wind from 2009 to 2012. With continued declines in wind PPA prices, however, those prices reconnected with the market value of wind in 2013 and have remained generally in competitive territory in subsequent years. This suggests that—with the help of the PTC, which reduces PPA prices—wind power developers and off-takers are successfully contracting at levels that are generally comparable in terms of both cost and value, with a number of recent wind PPAs coming in at a discount relative to wholesale market value estimates.
72 The Appendix provides additional details on the methods used to estimate the wholesale energy and capacity value of wind.
64
vk.com/id446425943
2018 Wind Technologies Market Report
Wholesale Market Value and PPA Prices |
(2018 $/MWh) |
Wind |
|
120 |
|
|
|
|
|
|
|
|
|
|
100 |
|
|
|
|
|
|
|
|
|
ISO-NE |
|
|
Average Levelized Wind PPA Price with 10th/90th |
||||||||
|
|
|
||||||||
|
|
|
Percentiles (by year of PPA execution) |
|
CAISO |
|||||
80 |
|
|
|
|
|
|
|
|
|
PJM |
|
|
|
|
|
|
|
|
|
|
|
60 |
|
|
|
|
|
|
|
|
|
NYISO |
40 |
|
|
|
|
|
|
|
|
|
MISO |
|
|
|
|
|
|
|
|
|
|
|
|
|
|
|
|
|
|
|
|
|
ERCOT |
20 |
|
|
|
|
|
|
|
|
|
SPP |
|
|
|
|
|
|
|
|
|
|
|
0 |
2009 |
2010 |
2011 |
2012 |
2013 |
2014 |
2015 |
2016 |
2017 |
2018 |
2008 |
||||||||||
Note: Hourly wind output profiles and wholesale prices are not available for all historical years for all regions; as such, estimates of the wholesale value of wind are not available for all years for all regions.
Sources: Berkeley Lab, ABB, ISOs
Figure 58. Regional wholesale market value of wind and average levelized long-term wind PPA prices over time
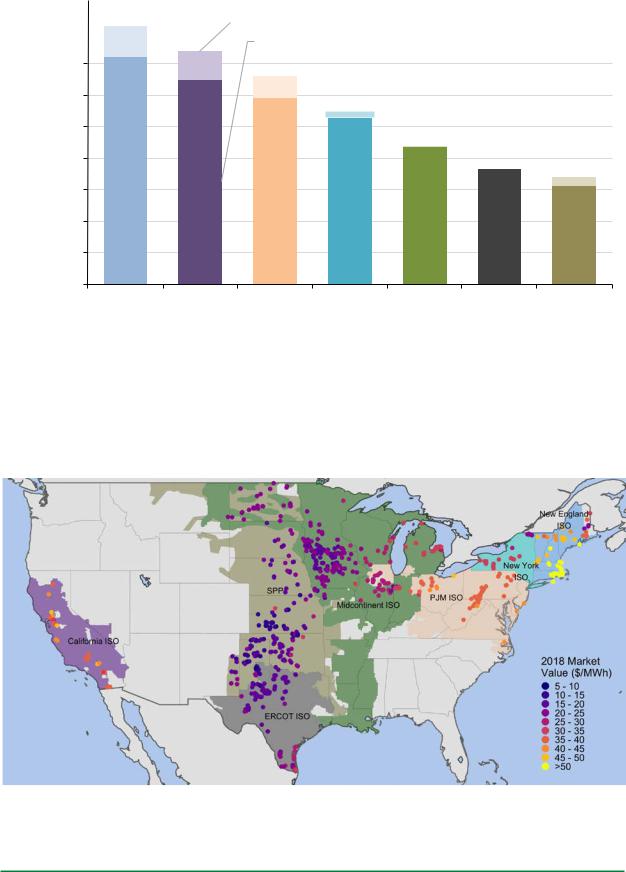
Because many of the regional wholesale market value estimates are in a similar range, it is difficult to discern individual regional data points in Figure 58. Accordingly, Figure 59 presents these estimates of wind’s wholesale market value, by region, but only for the latest year—2018. The figure also disaggregates the market value estimates into their constituent parts: energy and capacity. The average market value of wind in 2018 was the lowest in SPP ($17/MWh), ERCOT ($18/MWh) and MISO ($22/MWh), whereas the highest-value market was ISO-NE ($41/MWh). Energy value represented the largest share of the total, with capacity value varying widely regionally and being considerably lower in absolute magnitude.
65
vk.com/id446425943
2018 Wind Technologies Market Report
Wholesale Market Value in 2018 |
(2018 $/MWh) |
Wind |
|
45 |
|
|
|
|
|
|
|
|
capacity value |
||
|
|
|
|
|
|
40 |
|
|
|
|
|
|
|
|
|
energy value |
|
|
|
|
|
|
35 |
|
|
|
|
|
|
30 |
|
|
|
|
|
|
25 |
|
|
|
|
|
|
20 |
|
|
|
|
|
|
15 |
|
|
|
|
|
|
10 |
|
|
|
|
|
|
5 |
|
|
|
|
|
|
0 |
|
|
|
|
|
|
ISO-NE |
CAISO |
PJM |
NYISO |
MISO |
ERCOT |
SPP |
Sources: Berkeley Lab, ABB, ISOs
Figure 59. Regional wholesale market value of wind in 2018, by region
Finally, Figure 60 presents the 2018 market value estimates at a project level. These estimates span a wide range, from a low of $6/MWh to a high of $73/MWh, with a weighted average of $22/MWh. The figure also illustrates the variability that exists in market value within each region, with areas facing transmission congestion and high wind penetrations experiencing lower market value. Higher market value estimates are found in uncongested areas, areas with higher average wholesale prices, and areas where wind output profiles are more-correlated with electricity demand.
Sources: Berkeley Lab, ABB, ISOs
Figure 60. Project-level wholesale market value of wind in 2018
66

vk.com/id446425943
2018 Wind Technologies Market Report
Important Note: Notwithstanding the above comparisons, neither the wind prices nor wholesale market value estimates (nor fuel cost projections) reflect the full social costs of power generation and delivery. Among the various shortcomings of comparing wind (and solar) PPA prices with wholesale value and natural-gas cost estimates in this manner are the following:
•Wind (and solar) PPA prices are reduced by virtue of federal and, in some cases, state tax and financial incentives. Similarly, wholesale electricity prices (or fuel cost projections) are reduced by virtue of any financial incentives provided to thermal generation and its fuel production. Wholesale electricity prices may also not fully account for the health and environmental costs of various generation technologies, and for other societal concerns such as fuel diversity, fuel security, and resilience.
•Wind (and solar) PPA prices do not fully reflect integration, resource adequacy, or transmission costs, while wholesale electricity prices (or fuel cost projections) also do not fully reflect transmission costs, and may not fully reflect capital and fixed operating costs.
•Wind and solar PPA prices—once established—are fixed and known. The estimated wholesale market value of wind represents historical values, whereas future natural gas prices are uncertain. Said another way, levelized wind (and solar) PPA prices represent a future stream of prices that has been locked in (and that often extends for 20 years or longer), whereas the wholesale value estimates are pertinent to just the specific historical years evaluated, and future natural gas prices reflect uncertain forecasts.
In short, comparing levelized long-term wind PPA prices with either yearly estimates of the wholesale market value of wind or forecasts of the fuel costs of natural gas-fired generation is not appropriate if one’s goal is to account fully for the costs and benefits of wind energy relative to other generation sources. Nonetheless, these comparisons still provide some sense for the short-term competitive environment facing wind energy, and convey how those conditions have shifted over time.
67

vk.com/id446425943
2018 Wind Technologies Market Report
REC prices in RPS compliance markets remained low in 2018
Wind power sales prices presented in this report reflect bundled sales of both electricity and RECs; excluded are projects that sell RECs separately from electricity, thereby generating two sources of revenue. REC markets are fragmented in the United States, but consist of two distinct segments: compliance markets, in which RECs are purchased to meet state RPS obligations, and green power markets, in which RECs are purchased on a voluntary basis.
The figures below present indicative data of spot-market REC prices in both compliance and voluntary markets. Clearly, spot REC prices have varied substantially, both over time and across states, though prices within regional power markets (New England and PJM) are linked to varying degrees.
REC prices in most compliance markets remained relatively low in 2018, reflecting an over-supply relative to current RPS demand. In New England, REC prices continued their slide of the past several years, falling from roughly $15/MWh at the end of 2017 to $5/MWh by year-end 2018. In PJM, REC prices in most states (DE, MD, NJ, PA, OH) rebounded slightly from the prior year, but still remained well below the pricing levels seen in 2014–2015, varying within a range of roughly $5/MWh to $8/MWh over the course of 2018. The two other PJM states shown (DC and IL) have less restrictive eligibility rules than other states in the region, and thus saw even lower REC prices, ranging from $1/MWh to $3/MWh in 2018. Prices for RECs offered in the national voluntary market and for RPS compliance in Texas remained below $1/MWh throughout the year, reflecting sustained over-supply, while prices for voluntary RECs sourced from the Western United States remained at just under $3/MWh over the course of the year.
New England
|
$80 |
|
|
CT |
|
|
MA |
|
||
|
|
|
|
|
|
|
||||
|
|
|
|
ME |
|
|
NH |
|
||
|
|
|
|
RI |
|
|
|
|
|
|
|
$60 |
|
|
|
|
|
|
|
|
|
2018$/MWh |
$40 |
|
|
|
|
|
|
|
|
|
|
|
|
|
|
|
|
|
|
|
|
|
$20 |
|
|
|
|
|
|
|
|
|
|
$0 |
|
|
|
|
|
|
|
|
|
|
2010 |
2011 |
2012 |
2013 |
2014 |
2015 |
2016 |
2017 |
2018 |
2019 |
|
|
|
|
PJM |
|
|
|
$10 |
|
$40 |
|
|
|
DC |
|
|
|
DE |
|
|
|
|
|
|
|
|
|
||
|
|
|
|
IL |
|
|
|
MD |
|
|
|
|
|
NJ |
|
|
|
OH |
$8 |
$30 |
|
|
|
PA |
|
|
|
|
|
|
|
|
|
|
|
|
|
||
|
|
|
|
|
|
|
|
|
|
|
|
|
|
|
|
|
|
|
$6 |
$20 |
|
|
|
|
|
|
|
|
|
|
|
|
|
|
|
|
|
|
$4 |
$10 |
|
|
|
|
|
|
|
|
$2 |
|
|
|
|
|
|
|
|
|
|
$0 |
|
|
|
|
|
|
|
|
$0 |
2010 |
2011 |
2012 |
2013 |
2014 |
2015 |
2016 |
2017 |
2018 |
2019 |
Texas & Voluntary Market
|
|
|
|
TX |
|
|
|
|
|
|
|
|
|
Vol. (nat'l) |
|
|
|
||
|
|
|
|
Vol. (west) |
|
|
|||
2010 |
2011 |
2012 |
2013 |
2014 |
2015 |
2016 |
2017 |
2018 |
2019 |
Notes: Data for compliance markets focus on “Class I” or “Tier I” RPS requirements; these are the requirements for more-preferred resource types or vintages and are therefore the markets in which wind would typically participate. Plotted values are the monthly averages of daily closing prices for REC vintages from the current or nearest future year traded.
Source: Marex Spectron.
68
vk.com/id446425943
2018 Wind Technologies Market Report
PPA price trends reflect the levelized cost of wind energy
In a competitive market, bundled long-term PPA prices can be thought of as reflecting the levelized cost of energy (LCOE) reduced by the levelized value of any incentives received (e.g., the PTC). Hence, as a firstorder approximation, LCOE can be estimated simply by adding the levelized value of incentives received to the levelized PPA prices. LCOE can also be estimated more directly from its components, however, and Berkeley Lab has data on both the installed cost and capacity factor of 76.5 GW of wind power projects installed from 1998 through 2017, representing 86% of all capacity built over that period. Here we use those data, in conjunction with time-varying estimates of both operational and financing costs (the latter assuming no PTC), to estimate the LCOE of wind energy over time and by region, in real 2018 dollars. One benefit of this “bottom up” approach to estimating LCOE is that it relies on a large sample of project-level installed cost and performance data, covering more projects than the Berkeley Lab PPA sample.
Based on a variety of data sources (including discussions with industry experts), total operational expenses are assumed to fall from a levelized cost of $82/kW-year in 1998 to $61/kW-year by 2003, $52/kW-year by 2010, and $43/kW-year by 2018 (and are interpolated linearly between these years). The weighted average cost of capital assumes a 65%:35% debt-to-equity ratio (possible in the absence of the PTC), with the cost of debt varying over time based on historical changes in the 20-year swap rate and bank spread, while the cost of equity holds steady at 10%. We assume that project life increases linearly from 20 years for all projects built before 2013 to 25 years for all projects built after 2016. We assume standardized tax rates (a combined federal and state tax rate of 40% for all projects built prior to 2018’s reduction in the corporate federal tax rate, and 27% thereafter), 5-year accelerated depreciation, and 2% annual inflation. For capacity factors, we use an average of available project-level data; as such, projects installed in 1998 may have 20 years of data to average, whereas projects installed in 2017 will have just one year. For 5.7 GW of projects built in 2018 (that have not yet been operating for a full year) for which we have installed cost estimates, we assume that capacity factors match the average capacity factor of projects built in the same region from 2015 to 2017.
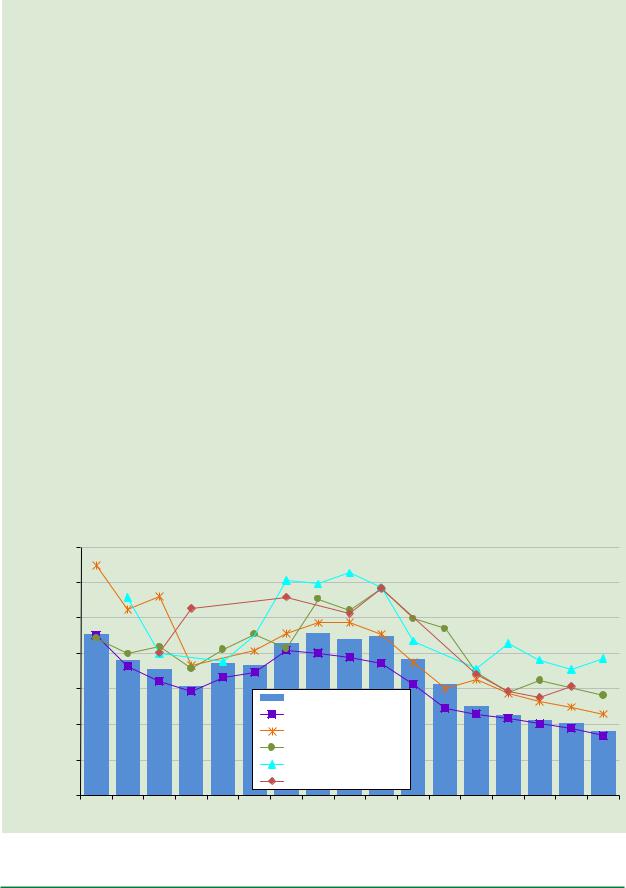
The figure depicts the resulting generation-weighted average LCOE values over time, nationwide and by region (regional results are only shown for years in which there is at least 20 MW of project sample). Regional LCOE values span a wide range, but regional and nationwide trends closely follow the PPA price trends shown earlier—i.e., generally decreasing from 1998 to 2005, rising through 2009, and then declining through 2018. The lowest LCOEs are found in the Interior region, with a 2018 average of $34/MWh and with some projects as low as $27/MWh; looking back in time, these are the lowest wind LCOEs on record. On a nationwide basis, the average LCOE for projects built in 2018 is at an all-time low—$36/MWh.
|
$140 |
|
|
|
|
|
|
|
|
|
|
|
|
|
|
|
|
|
$/MWh) |
$120 |
|
|
|
|
|
|
|
|
|
|
|
|
|
|
|
|
|
$100 |
|
|
|
|
|
|
|
|
|
|
|
|
|
|
|
|
|
|
(2018 |
$80 |
|
|
|
|
|
|
|
|
|
|
|
|
|
|
|
|
|
LCOE |
$60 |
|
|
|
|
|
|
|
|
|
|
|
|
|
|
|
|
|
Average |
|
|
|
|
|
|
Nationwide (82.1 GW) |
|
|
|
|
|
|
|
||||
|
|
|
|
|
|
|
|
|
|
|
|
|
|
|||||
$40 |
|
|
|
|
|
|
Interior (55.1 GW) |
|
|
|
|
|
|
|
||||
|
|
|
|
|
|
Great Lakes (9.4 GW) |
|
|
|
|
|
|
|
|||||
|
$20 |
|
|
|
|
|
|
West (12.0 GW) |
|
|
|
|
|
|
|
|
||
|
|
|
|
|
|
|
Northeast (4.6 GW) |
|
|
|
|
|
|
|
||||
|
|
|
|
|
|
|
|
|
|
|
|
|
|
|
||||
|
$0 |
|
|
|
|
|
|
Southeast (1.1 GW) |
|
|
|
|
|
|
|
|||
|
|
|
|
|
|
2007 |
2008 2009 2010 2011 2012 2013 2014 2015 2016 2017 2018 |
|||||||||||
|
COD Year: 98-99 00-01 02-03 04-05 2006 |
|||||||||||||||||
|
GW: |
0.9 |
1.7 |
1.9 |
2.0 |
1.8 |
3.6 |
6.3 |
9.6 |
5.1 |
6.3 |
9.5 |
0.9 |
5.1 |
8.2 |
8.2 |
5.3 |
5.7 |
|
|
|
|
|
|
|
|
|
69 |
|
|
|
|
|
|
|
|
|