

Vanguard_watermark
.pdfvk.com/id446425943
Vanguard economic and market outlook for 2019: Down but not out
Vanguard Research |
December 2018 |
■As the global economy enters its tenth year of expansion following the global financial crisis, concerns are growing that a recession may be imminent. Although several factors will raise the risk of recession in 2019, a slowdown in growth—led by the United States and China— with periodic “growth scares” is the most likely outcome. In short, economic growth should shift down but not out.
■Previous Vanguard outlooks anticipated that the secular forces of globalization and technological disruption would make achieving 2% inflation in the United States, Europe, Japan, and elsewhere more difficult. In 2018, we rightly anticipated a cyclical firming in core inflation across various economies. In 2019, we do not see a material risk of further strong rises in core inflation despite lower unemployment rates and higher wages. This is because higher wages are not likely to funnel through to higher consumer prices, as inflation expectations remain well-anchored.
■As inflation moves toward target, financial stability risks rise, and unemployment rates continue to approach or drop below estimates of full employment, global central banks will stay on their gradual normalization paths. In the United States, we still expect the Federal Reserve to reach terminal rate for this cycle in the summer of 2019, bringing the policy rate range to 2.75%–3% before halting further increases in the face of nonaccelerating inflation and decelerating top-line growth. Other developed-market central banks, though, will only begin to lift interest rates from postcrisis lows.
■With slowing growth, disparate rates of inflation, and continued policy normalization, volatility in financial markets is likely to accelerate. Long term, our ten-year outlook for investment returns remains guarded, given the backdrop of high valuations and depressed risk-free rates across major markets.

vk.com/id446425943
Lead authors
Joseph Davis, Ph.D. |
Roger A. Aliaga-Díaz, Ph.D. |
Global Chief Economist |
Chief Economist, Americas |
Peter Westaway, Ph.D. |
Qian Wang, Ph.D. |
Chief Economist, Europe |
Chief Economist, Asia-Pacific |
Andrew J. Patterson, CFA |
Harshdeep Ahluwalia, M.Sc. |
Senior Economist |
Senior Investment Strategist |
Alexis Gray, M.Sc. |
Jonathan Lemco, Ph.D. |
Senior Economist |
Senior Investment Strategist |
Editorial note
This publication is an update of Vanguard’s annual economic and market outlook for 2019 for key economies around the globe. Aided by Vanguard Capital Markets Model® simulations and other research, we also forecast future performance for a broad array of fixed income and equity asset classes.
Acknowledgments
We thank Kristen M. Storti, Donald B. Foote III, and Andrew S. Clarke, CFA, for their significant contributions to this piece and acknowledge the work of the Global Economics and Capital Markets Outlook Team. Further, we would like to acknowledge the work of Vanguard’s broader Investment Strategy Group, without whose tireless research efforts this piece would not be possible.
Vanguard Investment
Strategy Group
Vanguard Global Economics
and Capital Markets Outlook Team
Joseph Davis, Ph.D., Global Chief Economist
Americas
Roger A. Aliaga-Díaz, Ph.D., Chief Economist, Americas
Harshdeep Ahluwalia, M.Sc.
Kevin DiCiurcio, CFA
Joshua M. Hirt, CFA
Jonathan Lemco, Ph.D.
Vytautas Maciulis, CFA
Darrell Pacheco
David Pakula, CFA
Andrew J. Patterson, CFA
Jonathan Petersen, M.Sc.
Ashish Rajbhandari, Ph.D.
Asawari Sathe, M.Sc.
Adam J. Schickling, CFA
Christos Tasopoulos, M.Sc.
Haifeng Wang, Ph.D.
Europe
Peter Westaway, Ph.D., Chief Economist, Europe
Jack Buesnel
Ankul Daga, CFA
Alexis Gray, M.Sc.
William Palmer
Shaan Raithatha, CFA
Giulio Renzi-Ricci, M.Sc.
Asia-Pacific
Qian Wang, Ph.D., Chief Economist, Asia-Pacific
Matthew C. Tufano
Beatrice Yeo
vk.com/id446425943
Contents |
|
Global outlook summary................................................................................................................................................................................................. |
4 |
I. Global economic perspectives..................................................................................................................................................................... |
6 |
Global economic outlook: Down but not out................................................................................................................................................................ |
6 |
Global growth outlook: Moderating to trend.............................................................................................................................................................. |
12 |
United States: Going for a soft landing........................................................................................................................................................................... |
15 |
Euro area: Stable growth as policy normalizes........................................................................................................................................................ |
19 |
United Kingdom: Brexit is still the wild card.............................................................................................................................................................. |
21 |
China: Reprioritizing policy goals amid rising risks.............................................................................................................................................. |
23 |
Japan: No exit, but more flexibility...................................................................................................................................................................................... |
26 |
Emerging markets: A mixed bag............................................................................................................................................................................................ |
29 |
II. Global capital markets outlook.................................................................................................................................................................. |
31 |
Global equity markets: High risk, low return............................................................................................................................................................. |
31 |
Global fixed income markets: An improved outlook.......................................................................................................................................... |
34 |
Portfolio implications: A low return orbit ..................................................................................................................................................................... |
36 |
III. Appendix............................................................................................................................................................................................................................................... |
42 |
About the Vanguard Capital Markets Model............................................................................................................................................................. |
42 |
Index simulations................................................................................................................................................................................................................................... |
43 |
Notes on asset-return distributions |
|
The asset-return distributions shown here represent Vanguard’s view on the potential range of risk premiums that may |
|
occur over the next ten years; such long-term projections are not intended to be extrapolated into a short-term view. |
|
These potential outcomes for long-term investment returns are generated by the Vanguard Capital Markets Model® |
|
(VCMM) and reflect the collective perspective of our Investment Strategy Group. The expected risk premiums—and |
|
the uncertainty surrounding those expectations—are among a number of qualitative and quantitative inputs used in |
|
Vanguard’s investment methodology and portfolio construction process. |
|
IMPORTANT: The projections and other information generated by the VCMM regarding the likelihood of |
|
various investment outcomes are hypothetical in nature, do not reflect actual investment results, and are |
|
not guarantees of future results. Distribution of return outcomes from the VCMM are derived from 10,000 |
|
simulations for each modeled asset class. Simulations are as of September 30, 2018. Results from the model |
|
may vary with each use and over time. For more information, see the Appendix section “About the Vanguard |
|
Capital Markets Model.” |
3 |

vk.com/id446425943
Vanguard’s distinct approach to forecasting
To treat the future with the deference it deserves, Vanguard has long believed that market forecasts are best viewed in a probabilistic framework. This annual publication’s primary objectives are to describe the projected long-term return distributions that contribute to strategic asset allocation decisions and to present the rationale for the ranges and probabilities of potential outcomes. This analysis discusses our global outlook from the perspective of a U.S. investor with a dollar-denominated portfolio.
Global outlook summary
Global economy: Down but not out
As the global economic expansion enters its tenth year, concerns are growing that a recession may be imminent. Although several factors will raise the risk of recession in 2019, a slowdown in growth—led by the United States and China—is the most likely outcome. In
short, economic growth should shift down but not out.
We expect the global economy to continue to grow, albeit at a slightly slower pace, over the next two years, leading at times to so-called growth scares. In 2019, U.S. economic growth should drop back toward a more sustainable 2% as the benefits of expansionary fiscal and monetary policy abate. Europe and Japan are at an earlier stage of the business cycle, though we expect growth there to remain modest.
In emerging markets, China’s growth will remain near 6%, with increasing policy stimulus applied to help maintain that trajectory. Unresolved U.S.-China trade tensions remain one of the largest risk factors to our view, in addition to stronger-than-expected tightening by the Federal Reserve should the U.S. unemployment rate approach 3%.
Global inflation: Unlikely to shoot past 2%
Previous Vanguard outlooks anticipated that the secular forces of globalization and technological disruption would make achieving 2% inflation in the United States, Europe, Japan, and elsewhere more difficult. In 2018, we rightly anticipated a cyclical firming in core inflation across various economies. In 2019, we do not see a material risk of further strong rises in core inflation despite lower unemployment rates and higher wages, as inflation expectations remain well-anchored.
In the U.S., we expect core inflation to remain near or below 2% throughout 2019; an escalation in tariffs would only temporarily affect U.S. core inflation. In Europe and Japan, price pressures will increase gradually as labor market slack erodes, though core inflation is likely to stay well below 2%. Higher wages are likely, yes, but higher inflation is not.
Monetary policy: Convergence commences, with the Fed stopping near 3%
As inflation moves toward target, financial-stability risks rise, and unemployment rates approach full employment, global central banks will stay on their gradual normalization paths.
In the United States, we still expect the Fed to reach terminal rate for this cycle in the summer of 2019, bringing the policy rate range to 2.75%–3% before halting further increases in the face of nonaccelerating inflation and decelerating growth. Other developedmarket central banks will only begin to lift interest rates from postcrisis lows. We expect the first rate increase from the European Central Bank in late 2019, followed by a very gradual hiking path thereafter. Japan is late to the party and we do not expect any rate increases
in 2019, though some fine-tuning of its policy framework is likely to ease growing financial-stability risk. Emergingmarket countries don’t control their own destiny and will be proactively forced to tighten along with the
Fed, while further modest currency depreciation, tempered by tightened capital controls, is the most likely outcome in China.
4

vk.com/id446425943
Investment outlook: No pain, no gain
With slowing growth, disparate rates of inflation, and continued policy normalization, volatility in financial markets is likely to accelerate. Long term, our ten-year outlook for investment returns remains guarded, given the backdrop of high valuations and depressed risk-free rates across major markets.
U.S. fixed income returns are most likely to be in the 2.5%–4.5% range, driven by rising policy rates and higher yields across the maturity curve as policy normalizes. This results in a modestly higher outlook compared with last year’s outlook of 1.5%–3.5%—albeit still more muted than the historical precedent of 4.7%.
Returns in global equity markets are likely to be about 4.5%–6.5% for U.S.-dollar-based investors. This remains significantly lower than the experience of previous decades and of the postcrisis years, when global equities have risen 12.6% a year since the trough of the market downturn. We do, however, foresee improving return prospects in non-U.S. developed markets, building on slightly more attractive valuations (a key driver of the equity risk premiums) combined with higher expected risk-free rates.
As was the case last year, the risk of a correction for equities and other high-beta assets is projected to be considerably higher than for high-quality fixed income portfolios.
Indexes used in our historical calculations
The long-term returns for our hypothetical portfolios are based on data for the appropriate market indexes through September 2018. We chose these benchmarks to provide the best history possible, and we split the global allocations to align with Vanguard’s guidance in constructing diversified portfolios.
U.S. bonds: Standard & Poor’s High Grade Corporate Index from 1926 through 1968; Citigroup High Grade Index from 1969 through 1972; Lehman Brothers U.S. Long Credit AA Index from 1973 through 1975; and Bloomberg Barclays U.S. Aggregate Bond Index thereafter.
Ex-U.S. bonds: Citigroup World Government Bond Ex-U.S. Index from 1985 through January 1989 and Bloomberg Barclays Global Aggregate ex-USD Index thereafter.
Global bonds: Before January 1990, 100% U.S. bonds, as defined above. January 1990 onward, 70% U.S. bonds and 30% ex-U.S. bonds, rebalanced monthly.
U.S. equities: S&P 90 Index from January 1926 through March 1957; S&P 500 Index from March 1957 through 1974; Dow Jones Wilshire 5000 Index from the beginning of 1975 through April 2005; and MSCI US Broad Market Index thereafter.
Ex-U.S. equities: MSCI World ex USA Index from January 1970 through 1987 and MSCI All Country World ex USA Index thereafter.
Global equities: Before January 1970, 100% U.S. equities, as defined above. January 1970 onward, 60% U.S. equities and 40% ex-U.S. equities, rebalanced monthly.
5

vk.com/id446425943
I.Global economic perspectives
Global economic outlook: Down but not out
As the global economic expansion enters its tenth year, concerns are growing that a recession may be imminent. Although several factors raise the risk of recession in 2019, a slowdown in growth—led by the United States and China—is the most likely outcome.
Our global economic outlook is based on:
•an assessment of the stage of the business cycle for each of the world’s largest economies (Figure I-1);
•estimates of how recent and expected future policy actions (fiscal, monetary, and trade) will affect economic growth and inflation, among other factors, in 2019 and beyond (see regional outlooks); and
•the probabilities of various risk factors and scenarios that could alter our base case (see Figure I-5 on page 10).
Our analysis of fundamentals and the historical drivers of recession leads us to conclude that continued expansion, albeit at a slower pace—rather than imminent collapse—is the most likely scenario for the global economy in 2019. This forecast is not sanguine, however. The expected easing of global growth in the next two years—driven by a fading boost from U.S. fiscal stimulus, more restrictive Federal Reserve policy, and the continued slowing of growth in China—is fraught with economic and market risks.
We provide explicit estimates from our Investment Strategy Group’s economics team of the most prominent risks for 2019 (see Figure I-5 on page 10).
The global economic cycle
The concern about an imminent global recession often rests on the assumption that the U.S. expansion—which is among the longest on record—is clearly at the latest stage of the business cycle. The typical business cycle is characterized by an economy moving through a series of states: early cycle, when growth recovers strongly after a recession; mid-cycle, as an economy approaches
and then exceeds full capacity and growth peaks; and late cycle, as the economy slows down and tips into recession
FIGURE I-1
Where are countries in their economic cycles?
Above potential |
GDP growth |
Below potential |
GDP growth |
Early stage |
Middle stage |
Late stage |
End |
of expansion |
of expansion |
of expansion |
of expansion |
|
|
U.S. |
|
|
U.K. |
|
|
|
Euro |
|
|
|
area |
|
China |
|
|
Australia |
Canada |
|
India |
Mexico |
|
|
|
||
|
Japan |
|
Russia |
|
Brazil |
|
|
Range of |
|
|
South |
individual |
|
|
Africa |
countries’ |
|
|
|
cycles |
|
|
|
Size of circles corresponds to country’s GDP (2017)
Notes: The vertical axis represents GDP growth rate relative to each country’s potential growth rate, represented by the horizontal line. There is no inherent time limit on the length of each stage; different economies progress through the stages at varying speeds. The end of an expansion represents below-trend growth, which may or may not match the common definition of recession of two consecutive quarters of negative real GDP growth.
6 Sources: Vanguard and the International Monetary Fund (IMF).

vk.com/id446425943
again. Yet Figure I-1 illustrates that the United States is only now approaching the later stages of expansion, in which imbalances grow larger, growth begins to decelerate, and recession risks increase. Other major
economies, such as Europe and Japan, are even further behind given the slower progress made in their return to full capacity.
As the world’s largest economy, the United States is naturally a critical driver of the global business cycle, and so most U.S. recessions are part of global recessions.
One way to assess the risk of a U.S. recession is to gauge the economy’s proximity to the tipping point in the business cycle. Figure I-2 displays a quantitative assessment of the present stage of the U.S. business cycle (that is, early, mid-, or late cycle). The colored circles indicate that the U.S. economy is only now transitioning toward the later stages of the expansion, despite the recovery’s near-record length. In other
words, current fundamentals such as consumer demand, household balance sheets, price inflation, and the present stance of monetary policy suggest that the U.S. recovery could persist at least through 2020. Other indicators,
FIGURE I-2
Still too early to call recession in the U.S.
A comparison of the current state of fundamentals with previous business cycles
a. Cyclical index just now moving toward later cycle levels |
b. Lack of extremes broadly present across a range |
|
of indicators |
Current
|
|
Early cycle |
Mid-cycle |
2001 |
2.5 |
score) |
Current |
2007 |
2001 |
|
|
|
|
||
|
2.0 |
|
|
|
|
|
|
z- |
Slack |
|
|
|
|
as |
|
|
|
|
1.5 |
|
|
|
|
|
(shown |
|
|
|
|
|
1.0 |
Price pressures |
|
|
|
|
|
|
|
||
|
cycle |
|
|
|
|
2007 |
0.5 |
Demand |
|
|
|
business |
|
|
|||
|
0 |
Sentiment |
|
|
|
|
|
|
|
||
|
|
in |
|
|
|
|
|
Leverage |
|
|
|
|
–0.5 |
points |
|
|
|
|
|
|
|
|
|
|
–1.0 |
at |
|
|
|
|
ranges |
|
|
|
|
|
–1.5 |
Earnings |
|
|
|
|
|
|
|
|
|
|
–2.0 |
level |
Financial |
|
|
|
Index |
|
|
||
|
|
|
|
|
|
|
–2.5 |
|
Asset prices |
|
|
|
|
|
|
|
|
Late cycle |
|
|
|
|
|
|
|
|
Monetary policy |
|
|
Notes: Figure I-2a displays the historical ranges of a cyclical index at various points in the business cycle. Index is shown as a z-score and weighted by first principal components of 25 economic indicators (below). The business cycle is determined by historical observations of the output gap. Figure I-2b displays the underlying components of the cyclical index in Figure I-2a, presenting the current level relative to historical observations. The 2007 and 2001 data points indicate the index and component position 12 months prior to the onset of recession. Underlying indicators: slack = output gap, U3 and U6 unemployment rate gap relative to NAIRU. Price pressures = personal consumption expenditures (PCE), core PCE, average hourly earnings, unit labor costs. Demand = housing starts, residential investment, non-residential investment, durable goods consumption. Sentiment = business optimism, consumer sentiment, consumer confidence. Leverage = household financial obligations ratio, nonfinancial corporate debt, FRB Senior Loan Officer Opinion Survey for consumer and commercial and industrial credit terms. Earnings = corporate profits. Financial = Vanguard financial conditions index, yield curve (measured as the 10 year-3 month Treasury yield) Asset prices = Vanguard’s fair-value CAPE, corporate OAS spread, high-yield OAS spread. Monetary policy = federal funds rate versus neutral rate estimated by the Laubach-Williams (2003) model. Data range is 1980 Q1-present.
Sources: Vanguard, Moody’s Analytics Data Buffet, Federal Reserve Bank of St. Louis, Laubach-Williams (2003).
7
vk.com/id446425943
however, are clearly consistent with a slowdown in growth and a more elevated risk of recession, including tight labor markets and high asset valuations (such as equity price/earnings ratios and tight credit spreads).
Figure I-2 suggests that the chances of a U.S. recession occurring and thereby derailing growth in the global economy are roughly 30% as we enter 2019. U.S. growth in 2019 is likely headed lower, but not below zero—in other words, down but not out.
A modest yet persistent challenge that the global economy will face in 2019 (and beyond) is the growth in global debt. In part because of ultrastimulative global monetary policy, global debt levels have rarely if ever been higher, and may be sowing the seeds for the next crisis. The global debt-to-GDP ratio stood at 220% in 2018, up from 175% in 2008.
Specifically, two segments of the global debt markets are concerning: emerging-market debt denominated in hard currency and nonfinancial corporate debt in the
U.S. and Europe. In the case of the latter, rapid growth in so-called leveraged loans is particularly alarming, having accounted for about 50% of the total corporate debt issuance in 2018, according to the International Monetary Fund (IMF). As the business cycle continues to mature and financial conditions gradually tighten in 2019, the global economy will be less able to sustain such credit growth (Chen and Kang, 2018). Figure I-3 illustrates that credit booms eventually fade, helping to contribute to economic slowdowns.
Although many emerging-market economies are vulnerable, China is the key risk factor given the size of its economy, hefty corporate debt, and rapidly rising
household debt. China’s credit profile stabilized moderately in 2017 and 2018, thanks to a recovery in nominal growth and the government’s financial deleveraging campaign.
Furthermore, a typical emerging-market debt crisis that is triggered by withdrawal of foreign funding is unlikely, given that over 90% of Chinese debt is domestic.
Meanwhile, as downside risk to growth emerges, the Chinese government has engaged in further monetary
FIGURE I-3
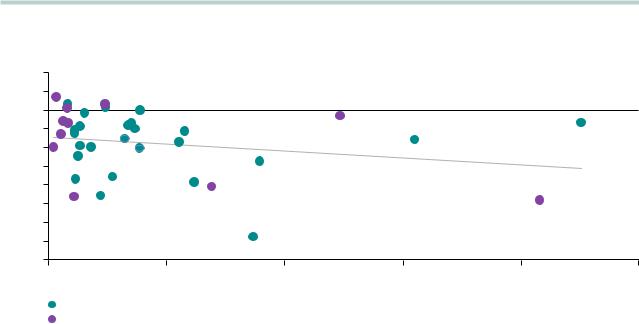
Most credit booms eventually lead to slower growth, a headwind for 2019
Percentage point change in GDP growth
2
1
0
–1
–2
–3
–4
–5
–6
–7
–8
30 |
80 |
130 |
180 |
230 |
280 |
Percentage point change in credit-to-GDP ratio
Developed markets
Emerging markets
Notes: Credit booms are defined as periods where the credit-to-GDP ratio is growing at a rate of at least 30 percentage points over a rolling five-year window. The change in credit-to-GDP ratio is the difference between the credit-to-GDP ratio at the start of the credit boom and the credit-to-GDP ratio when credit is growing at its fastest rate, again over a rolling five-year window. The change in GDP growth is the average growth differential between the five-year post-boom and five-year pre-boom periods.
Sources: Vanguard calculations, based on data from Bloomberg, the IMF, and the Bank for International Settlements (BIS).
8
vk.com/id446425943
and fiscal easing. These stimulus measures, alongside strengthened capital controls, will most likely avert a near-term crisis in China and spillover to the global economy. Although China may be delaying important long-term reforms, its near-term growth is unlikely
to collapse.
Where could the next recession come from?
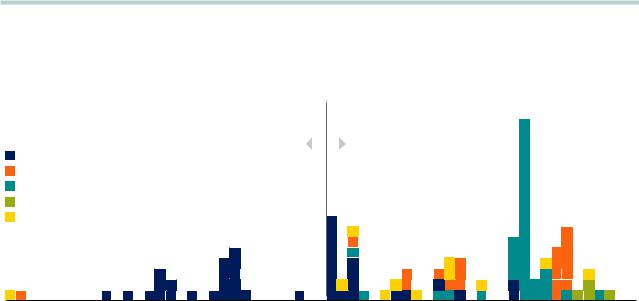
To understand what factors might cause a global recession today, it is useful to examine what precipitated such downturns in the past (Figure I-4). A more systematic analysis, involving a historical sample of 108 recessions in 23 developed markets over the last 60 years, shows that the length of the expansion is a necessary but not sufficient condition for recession; thus, the duration of the recovery provides little insight into the causes, depth, or even timing of the next recession.
As inflation in most developed markets has fallen to more desired levels since the early 1990s, mainly because of a focus on explicit or implicit inflation-
targeting by central banks, the sources of (or catalysts for) global or regional downturns have expanded beyond typical inflation pressures, as they did in the 1970s.
However, there has been no absence of significant inflation shocks to the global economy in the previous four decades. The reason behind the dramatic decline in inflation-induced recessions since the 1980s is that central banks learned to act preemptively in the face of inflation shocks, getting ahead of any price-wage inflationary spirals by better managing market expectations.
In 2019, we do not see a material risk of a strong rise in core inflation despite lower unemployment rates and higher wages, assuming inflation expectations remain well-anchored.
FIGURE I-4
Drivers of recessions vary
Drivers of 108 country-specific recessions since 1960
In ation |
|
1960–1989 |
|
1990–present |
|
|
21 of 23 recessions |
|
Causes of 85 recessions |
|
|
External pressures |
|
|
|
||
|
caused by in ation |
|
have been more varied |
|
|
Financial imbalance |
|
|
|||
|
|
|
|
||
Commodity price crash |
|
|
|
|
|
Other |
|
|
|
|
|
1960 |
1970 |
1980 |
1990 |
2000 |
2010 |
Notes: Recessions are defined as two consecutive quarters of negative real GDP growth. We examined 23 developed economies starting in 1960, or with the earliest available quarterly data. Recessions were categorized using a variety of macroeconomic indicators and historical analysis. Inflation recessions are those where regional inflation averaged greater than 4% in the 12 months preceding the recession’s start. External pressures signify recessions caused by export-demand weakness. Financial imbalance broadly represents a misallocation of capital, either through unsustainable equity, housing, or credit valuations resulting in elevated financial sector stress. Commodity price crashes are most likely to affect commodity export-driven economies. Examples of idiosyncratic factors (other) include weather events, tax increases, and political developments.
Source: Vanguard calculations, based on data from Thomson Reuters, Moody’s Analytics Data Buffet, and the Associated Press.
9

vk.com/id446425943
Vanguard’s risk scorecard
Although we are not predicting a global recession in our central case, a wide range of triggers could spark a global downturn.
Figure I-5 describes some of the global concerns that are front and center for investors as we head into 2019. For each potential risk, it indicates the odds attached to upside, downside, and base-case scenarios based on our assessment of risks.
Overall, the largest single risk to our forecasts is if an overly aggressive Federal Reserve continues to raise rates beyond 3% in 2019, perhaps because of a temporary rise in core inflation or wages. This risk,
if it materialized sometime in 2019, would significantly raise the odds of a U.S. recession in 2020. This would also adversely affect emerging-market countries that are dependent on dollar funding and vulnerable to
a strengthening dollar. Other risks are rated at lower odds, yet some of them are interrelated.
FIGURE I-5
Global risks to the outlook
|
|
|
Vanguard assessment of risks |
|
2019 |
|
|
|
|
|
|
|
|
|
global risks |
Description |
Negative scenario |
Base case |
Positive scenario |
Global monetary policy normalization
Extreme nature of existing policy stimulus, uncharted territory of quantitative tightening, and uncertainty about the neutral setting for policy (r*).
27% |
52% |
21% |
Policy mistake in the |
Soft landing in the U.S. |
Soft landing in the U.S. |
U.S.: Fed continues |
at 2.75%–3%. Gradual |
at 3% or higher. Jump |
tightening beyond r* |
ECB/BOE normalization |
in productivity growth |
and the yield curve |
commences. Global |
leads to higher growth |
inverts. ECB/BOE hold |
growth slowing back to |
with no inflation and |
off on normalization |
trend. |
shifts r* up. Global |
plans, increasing the |
|
trend growth increases |
divergence of global |
|
without global inflation. |
policy rates. |
|
|
Trade war and protectionism
Bilateral U.S.-China trade war continues to escalate. Tariffs can be increased further and non-tariff barriers can be put in place.
18%
Trade war extends beyond tariffs to quantitative restrictions, boycotts, etc., with major retaliations from China. Geopolitical risks rise. Impact to GDP growth could be more than 100 basis points.
53%
Trade war escalates in intensity, with level of existing tariffs and coverage of imports increased. Impact on the global economy of 30–50 basis points.
29%
The U.S. and China reach a bilateral agreement. Tariffs are rolled back.
Instability of Chinese economy
Fears are rising about a potential hard landing in China, given the collateral damage of financial deleveraging and the expectation of continued deterioration in China-U.S. relations.
23%
Capital flows intensify amid further escalation in the trade war and rising Fed policy rate. Policymakers fail to provide enough stimulus. Headline growth falls below 6%.
57%
Further monetary and fiscal easing will support domestic demand, while financial stability risk remains under control. Headline growth likely moderates to 6.0%–6.3% for 2019.
20%
U.S.-China striking a trade deal and/or policy over-easing represent upside risks to growth.
10