

Vanguard_watermark
.pdfvk.com/id446425943
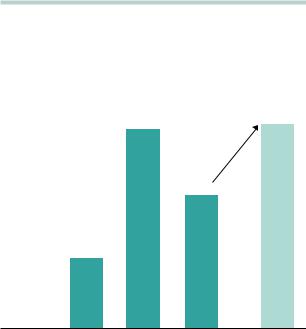
FIGURE I-12 (continued)
b. ECB rate view (versus forward curve and economists’ forecast)
|
1.0% |
|
0.5 |
rate |
|
Interest |
0 |
|
|
|
–0.5 |
|
–1.0 |
Nov. |
Mar. |
Jul. |
Nov |
Mar. |
Jul. |
Nov. |
Mar. |
2018 |
2019 |
2019 |
2019 |
2020 |
2020 |
2020 |
2021 |
Forecast as implied by market pricing
Average of forecasts by economists
Vanguard forecast
Notes: Economists’ forecast reflects the median expectation from a survey conducted by Bloomberg. The forecast implied by market pricing is derived from the forward overnight interest rate swap curve.
Sources: Vanguard, Bloomberg.
United Kingdom: Brexit is still the wild card
The United Kingdom is set to leave the EU on March 29, 2019. What happens beyond then depends on what,
if any, deal it strikes with the EU. Under our base case, we assume that an agreement is reached that has the United Kingdom leave in March, with some kind of free-trade deal that starts after a transition period.
In the long run, according to government estimates, U.K. GDP would fall by as much as 5%. In 2019, however, the transition period would help limit disruption to the economy, so growth would be likely to remain around trend at 1.6%.
In contrast to previous years, our conviction in our base case is relatively low, given that several Brexit options are still on the table that could materially affect growth. One of the two most prominent risks is a “Crash Brexit,” in which the United Kingdom fails to reach a deal and
effectively falls out of the EU with no backstop. Such a scenario could be chaotic in the short run, depending
on what sort of safety net the government puts in place, leading to sharply lower growth and possibly a recession.
The second risk is a “No Deal Brexit” scenario, in which the U.K. Parliament fails to ratify the deal, which could potentially lead to a second referendum and a vote
to remain in the EU. Under this scenario, there would be several months of uncertainty as the referendum takes place, but a decision to remain in the EU could boost growth.
Headline and core inflation are likely to slow and ultimately settle close to 2% in 2019, after being pushed well above target by the sharp drop in the pound sterling after the EU referendum (Figure I-13a on page 22). There will still be further upward pressure on inflation, mostly from low unemployment and rising wages. However, we expect the Bank of England to preemptively respond to this potential inflation pickup to keep consumer price growth in line with its 2% target.
U.K. inflation is currently above the Bank of England’s 2% target, and in normal times, this would already warrant policy tightening. We are not in normal times, however, given that the country is about to leave the EU.
The Bank of England understands that sentiment is fragile and that the possibility of a “No Deal Brexit” is still on the table, so a rate hike could damage sentiment and push the United Kingdom into an unintended slowdown. We therefore believe that the central bank is likely to keep rates on hold until there is further clarity around Brexit.
If our base case plays out, and a “Compromise Brexit” deal is struck before March 2019, we would expect the Bank of England to increase rates twice in 2019, in May and in November, to bring inflation back in line with target (Figure I-13b on page 22). If no Brexit deal
is reached, however, it will need to reassess its inflation outlook. If the hit to aggregate demand is judged to be greater and more persistent than the hit to aggregate supply, interest rates may be cut. But there is a chance that rates may need to rise even in a “No Deal Brexit” scenario, as the negative supply shock could lead to inflation accelerating above target for a sustained period.
21
vk.com/id446425943
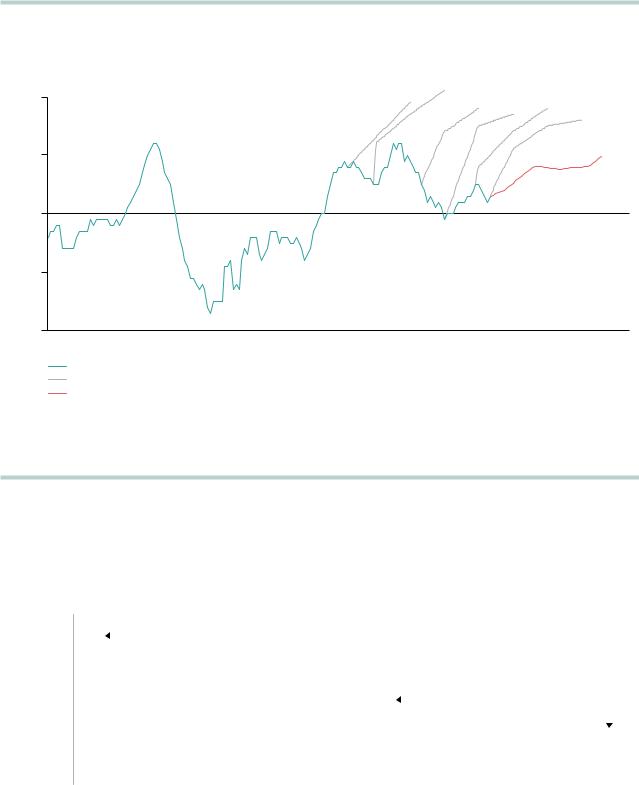
FIGURE I-13
Bank of England to hike rates twice per year to stem inflation pressures
a. U.K. goods inflation is expected to fall because of a stronger pound
7% |
|
|
|
|
|
|
–25% |
6 |
|
|
|
|
|
|
–20 |
5 |
|
|
|
|
|
|
|
|
|
|
|
|
|
–15 |
|
4 |
|
|
|
|
|
|
|
|
|
|
|
|
|
–10 |
|
3 |
|
|
|
|
|
|
|
|
|
|
|
|
|
|
|
2 |
|
|
|
|
|
|
–5 |
1 |
|
|
|
|
|
|
0 |
0 |
|
|
|
|
|
|
|
|
|
|
|
|
|
5 |
|
–1 |
|
|
|
|
|
|
|
|
|
|
|
|
|
10 |
|
–2 |
|
|
|
|
|
|
|
|
|
|
|
|
|
|
|
–3 |
|
|
|
|
|
|
15 |
2005 |
2007 |
2009 |
2011 |
2013 |
2015 |
2017 |
2019 |
Year-over-year change in U.K. core goods in ation (left)
Year-over-year change in trade-weighted sterling index advanced 12 months (inverted) (right)
Sources: Bloomberg and the Office of National Statistics.
b. Bank of England rate view (versus forward curve and economists’ forecast)
|
2.00% |
|
|
|
|
|
|
1.75 |
|
|
|
|
|
rate |
1.50 |
|
|
|
|
|
1.25 |
|
|
|
|
|
|
Interest |
|
|
|
|
|
|
1.00 |
|
|
|
|
|
|
0.75 |
|
|
|
|
|
|
|
|
|
|
|
|
|
|
0.50 |
|
|
|
|
|
|
0.25 |
|
|
|
|
|
|
Nov. |
May |
Nov. |
May |
Nov. |
May |
|
2018 |
2019 |
2019 |
2020 |
2020 |
2021 |
Forecast as implied by market pricing
Average of forecasts by economists
Vanguard forecast
Notes: Economists’ forecast reflects the median expectation from a survey conducted by Bloomberg. The forecast implied by market pricing is derived from the forward overnight interest rate swap curve.
Sources: Vanguard and Bloomberg.
22
vk.com/id446425943
China: Reprioritizing policy goals amid rising risks
The confluence of China’s financial deleveraging campaign and rising geopolitical tensions with the United States has predictably shaken private sector confidence
and slowed Chinese economic growth in 2018. These factors, along with the expectation of continued friction in China-U.S. relations, have compelled policymakers to reprioritize near-term growth stability over long-term economic restructuring and medium-term financial stability (see Figure I-14). As the government ramps up efforts to boost domestic demand in 2019 amid rising
external and domestic challenges, we view the chance of a hard landing as low and expect China’s economy
to settle into a lower growth range of 6%–6.3% in 2019.
External headwinds have been rising as the United States and China approach a full-blown trade war. The stimulus from export front-loading is waning, and the true economic implications of U.S. tariffs will become apparent. We estimate the direct impact of current tariffs on China’s GDP at a modest –0.15%, but this could accelerate to –0.60% with a 25% tariff on all imports from China.
FIGURE I-14
China’s current easing is more moderate than in prior cycles
Priority |
|
2014–2016 |
2017–2018 |
2018–2019 |
|
|
|
(projected) |
|||
|
Growth stability |
HIGH |
MEDIUM |
HIGH |
|
Domestic |
|
|
|
|
|
Financial stability |
LOW |
HIGH |
MEDIUM |
||
objectives |
|||||
|
|
|
|
||
|
|
|
|
|
|
|
Structural reform |
HIGH |
MEDIUM |
HIGH |
|
|
|
|
|
|
Policy bias |
TIGHTENING |
|
|
|
EASING |
|
|
|
|
|
|
|
|
|
|
|
|
|
|
Monetary/ |
Interest rates |
|
|
|
|
|
|
||
|
|
|
|
|
|
|
|
|
|
Quantity tools (reserve requirement ratio, liquidity tools) |
|
|
|
|
|||||
exchange |
|
|
|
|
|||||
rate policy |
|
|
|
|
|
|
|
|
|
Currency depreciation |
|
|
|
|
|
|
|||
|
|
|
|
|
|
|
|||
|
|
|
|
|
|
|
|
|
|
Fiscal |
Infrastructure spending |
|
|
|
|
|
|
||
|
|
|
|
|
|
|
|
|
|
policy |
Tax policy |
|
|
|
|
|
|
||
|
|
|
|
|
|
|
|
|
|
|
Bank credit |
|
|
|
|
|
|
||
|
|
|
|
|
|
|
|
|
|
Regulatory |
Shadow credit |
|
|
|
|
|
|
||
|
|
|
|
|
|
|
|
|
|
|
Property regulations |
|
|
|
|
|
|
||
|
|
|
|
|
|
|
|
|
|
Source: Vanguard. |
|
|
|
|
|
|
|
|
|
23
vk.com/id446425943
In addition, the potential downside is greater when considering the indirect impact on the labor market, consumption, business confidence, and financial markets. Although there are hopes that a trade deal is imminent, the U.S.-China conflict extends
beyond trade to areas such as investment, technology, intellectual property rights, market access, and industry policy. Hence, the path to an eventual truce between the two economic superpowers is likely to be bumpy and prolonged.
China’s 2016–2017 financial sector deleveraging campaign and regulatory crackdown on shadow banking had the adverse side effect of curbing credit to small and medium-sized private enterprises, a key component of China’s new economy. As policymakers recognize the downside risk to growth, they are ready to pause or even modestly backtrack these deleveraging efforts to boost corporate sentiment; further monetary easing, such
as required reserve ratio cuts, is in the pipeline (see Figure I-15). We expect regulatory reform aimed at encouraging entrepreneurship and private enterprise,
FIGURE I-15
Proactive policy stimulus should limit growth downside
Vanguard Financial Conditions Index versus Nowcast Index
6 |
|
|
|
|
|
|
|
Accommodative |
22% |
|
|
|
|
|
|
|
|
|
|
|
|
|
|
|
|
|
|
nancial |
19 |
4 |
|
|
|
|
|
|
|
conditions |
|
|
|
|
|
|
|
|
|
||
|
|
|
|
|
|
|
|
|
|
|
|
|
|
|
|
|
|
|
16 |
2 |
|
|
|
|
|
|
|
|
13 |
|
|
|
|
|
|
|
|
|
|
0 |
|
|
|
|
|
|
|
|
10 |
–2 |
|
|
|
|
|
|
|
|
7 |
|
|
|
|
|
|
|
|
4 |
|
|
|
|
|
|
|
|
|
|
|
–4 |
|
|
|
|
|
|
|
|
1 |
2009 |
2010 |
2011 |
2012 |
2013 |
2014 |
2015 |
2016 |
2017 |
2018 |
|
Financial Conditions Index (left) |
|
Nowcast Index (right) |
|
|
|
|
||
|
China government bond 10-year yield |
|
|
|
|
|
|
||
|
Shanghai composite stock return |
|
|
|
|
|
|
|
|
M2 growth
Real 7-day repo rate
Real effective exchange rate
Notes: Vanguard Financial Conditions Index is a VAR-weighted index of financial indicators. Positive values imply accommodative financial conditions; negative values imply tight conditions. Vanguard’s Nowcast Index is designed to track China’s economic growth in real time using a dynamic factor approach to weight economic and financial market indicators, accounting for co-movement between the factors.
Source: Vanguard calculations, based on data from Bloomberg, CEIC, and Thomson Reuters Datastream.
24
vk.com/id446425943
alongside fiscal expansionary measures including infrastructure investment and tax cuts, to combat the effects of a trade war.
Responding to the slowdown through monetary policy easing revives the “impossible trinity” as the United States continues to raise interest rates.5 However,
we believe a repeat of 2015–2016, when China foreign exchange reserves declined by more than $1 trillion in 18 months amid a surge in capital outflows, is unlikely.
With near-term growth stability becoming the top priority, monetary policy independence will prove critical in keeping domestic rates low in a global rising rate
environment. As such, an “asymmetric capital control” is likely to be maintained, with tight control on outflows and inflows welcomed. A more flexible exchange rate regime should be allowed, especially when modest depreciation will be needed to offset the negative impact stemming from tariffs (see Figure I-16).
Although navigating the trilemma is a challenge in its own right, an ideal “Goldilocks” policy response would neutralize economic headwinds while pushing forward market reforms and safeguarding medium-term financial stability. The government will strive to avoid both underand over-easing the economy in 2019, but achieving
FIGURE I-16
From an impossible tri-brid approach to a standard corner solution
China is moving toward less capital-account openness and more exchange-rate flexibility
Economies |
|
|
|
|
must choose |
Pure oat |
|||
two of these |
||||
|
|
U.S. |
||
three options |
|
|
||
|
|
Japan |
||
|
|
|||
|
|
|
||
3. Exchange-rate stability
Fixed |
Monetary union/ |
exchange rate |
currency board |
Saudi Arabia |
Europe |
Jordan |
Hong Kong |
Source: Vanguard.
The current world environment is making it dif cult for China to sustain all three (partial)
fronts simultaneously
|
China’s |
U.S. interest |
“impossible” |
rates are rising |
policy |
Trade friction |
|
is escalating |
|
China domestic |
|
growth is slowing |
|
These forces are driving China to
make a change
5 The impossible trinity is a trilemma in international economics that states that it is impossible to have a fixed foreign exchange rate, free capital movement |
25 |
(absence of capital controls), and independent monetary policy at the same time. |
vk.com/id446425943
this balance amid multiple goals will be difficult. While we are not as concerned about the near-term growth outlook as many in the market and view the chance of a hard landing as rather low, there are rising concerns that the government is delaying the reforms necessary to alleviate medium-term financial risk and ultimately address distortions in resource allocation (see Figure I-17).6
Even though the path is likely to be bumpy, we remain cautiously optimistic that China will resume its economic liberalization and reform as a necessary response to enduring international and domestic pressures. The era of “growth at all costs” is coming to an end, and previous inefficiencies and excesses that were masked by China’s size and population can no longer go unaddressed. Reform efforts in recent years have demonstrated China’s commitment to emphasizing high-quality growth and progressing to a technology-intensive consumptionand service-
FIGURE I-17
The risk of “kicking the can down the road” remains
Credit efficiency to deteriorate modestly in 2019
|
3.5 |
|
3.6 |
|
|
|
|
|
|
2.4 |
|
1.3 |
|
|
|
Credit |
|
|
|
ef ciency |
|
|
|
(higher = |
|
|
|
less ef cient) |
|
|
|
2003 to |
2009 to |
2018 |
2019 |
2008 |
2017 |
YTD |
projected |
Note: Credit efficiency is defined as debt in the economy divided by nominal GDP. 2018 YTD is through September.
Source: Vanguard calculations, based on data from CEIC.
oriented economy. We believe that continued reforms to improve corporate governance of state-owned enterprises; strengthening intellectual property protection; and providing a level playing field for
all firms, including foreign, private, and state-owned enterprises, are critical for China’s long-term development through more efficient capital allocation in domestic and international markets. In our view, this is China’s ultimate path to higher productivity and future growth potential.
Japan: No exit, but more flexibility
The Japanese economy has managed to weather multiple natural disasters and softening external demand in 2018, thanks to strong domestic demand. In 2019, impediments to growth will likely intensify, given the scheduled consumption tax hike and potential escalation of U.S. protectionism, notably auto tariffs. Nonetheless, we see the downside as being contained because
the negative impact should be offset by continued labor market strength, strong corporate profitability, and various mitigating fiscal measures. Households’ net burden from the 2019 tax hike is estimated to be only a quarter of the 2014 tax hike as a larger portion of the tax revenue (roughly half, versus one-fifth in 2014) will be rechanneled back to the real economy through social security enhancements, cash subsidies, and infrastructure projects. Overall, we expect growth
to revert to its trend of approximately 0.8% in 2019, with the risk skewed modestly to the downside.
Although a positive output gap and tight labor market would warrant monetary policy normalization in most economies, the decades-long struggle with suppressed inflation expectations precludes the Bank of Japan from tightening.We expect core inflation to gradually rise toward 1% throughout 2019, but it is likely several years away from the BoJ target of 2% as a result of these muted expectations (Figure I-18).
A standard Taylor rule would imply that the bank’s current policy stance is accommodative enough, even under our more conservative forecast for inflation and the output gap (see Figure I-19). Nonetheless, the Taylor rule estimate based on market inflation expectations demonstrates that the current policy rate is still not low enough to achieve the BoJ’s 2% inflation target. This dichotomy is a result of a number of structural factors—
26 6 See the 2017 Vanguard Global Macro Matters paper SOE Reforms—China’s Path to Higher Productivity.
vk.com/id446425943
FIGURE I-18
The Bank of Japan’s inflation woes
Core inflation forecasts (Bank of Japan and Vanguard)
|
2% |
|
|
|
2013 |
2014 |
|
|
|
|
|
|
2015 |
2016 |
2017 |
||
|
|
|
|
|
|
|||
|
|
|
|
|
|
|
|
2018 |
core CPI ationin |
1 |
|
|
|
|
|
|
|
0 |
|
|
|
|
|
|
|
|
over-year |
|
|
|
|
|
|
|
|
|
|
|
|
|
|
|
|
|
Year- |
–1 |
|
|
|
|
|
|
|
|
|
|
|
|
|
|
|
|
|
–2 |
|
|
|
|
|
|
|
|
2005 |
2008 |
2010 |
2013 |
2015 |
2018 |
|
2020 |
Core in ation
Previous Bank of Japan forecasts
Vanguard forecast
Notes: Core CPI includes all items except fresh food and energy. This measure is also referred to as BoJ Core.
Source: Vanguard calculations, based on data from Thomson Reuters and the Bank of Japan.
FIGURE I-19
A cyclical view of slack suggests current easing is sufficient, but a structural view suggests otherwise
Stylized Taylor rule estimates using inflation forecasts
Market in ation expectations
|
|
|
Structural view |
|
|
|
|
–0.44% |
|
|
|
|
|||
|
|
In ation forecast: 0.53% |
|
|
|
|
|
|
|
|
|
|
|
||
|
|
|
|
|
|
|
|
|
|
|
Vanguard |
|
|
Cyclical view |
|
|
|
|
|
|
In ation forecasts |
||
|
1.35% |
|
|
Vanguard: 0.9% BoJ: 1.4% |
|||
|
|
|
|||||
|
|
|
|
|
|
|
|
|
|
|
|
|
|
|
|
Policy rate |
|
|
|
|
|
Bank of Japan |
|
guidance |
|
|
|
2.50% |
|||
–0.1% |
|
|
|
||||
|
|
|
|
|
|
|
|
|
|
|
|
|
|
|
|
Notes: The Taylor rule estimate using market inflation expectations takes a structural view of policy setting, taking into account only inflation expectations. It tends to be structurally low because of its highly adaptive nature, with no consideration given to what a cyclical upswing and tight labor market could do to boost prices. Vanguard’s and the BoJ’s forecasts take a cyclical view of slack by also factoring in the pass-through effects (which are limited in Vanguard’s assessment) of a positive output gap and tight labor markets on prices.
Source: Vanguard calculations, based on data from the BoJ, IMF, Bloomberg, and Moody’s Analytics Data Buffet. |
27 |
|
vk.com/id446425943
including labor market duality, the more adaptive nature of Japan’s inflation expectations, and global technology advancement—that are preventing labor market and economic pressure from being translated into wage and price increases. As a result, the BoJ is unlikely to raise rates in 2019 and should maintain its forward guidance that interest rates remain low for an extended period.
However, additional tweaks and policy fine-tuning measures will likely occur over the next few years. The BoJ is mindful that the side effects accompanying prolonged monetary easing, such as the decrease in Japanese government bond (JGB) market liquidity and deteriorating profitability of financial institutions,
are becoming more prominent. The bank’s quantitative and qualitative easing program continues
to absorb most of the JGBs issued (see Figure I-20) and a prevailing low-yield environment continues to dampen profit margins for banks.
Hence, the BoJ will continue to seek more flexibility to enhance the sustainability and credibility of its policy framework without hampering the benefits of easy money. For safe-haven assets such as JGBs, this could mean giving a wider trading band than the current +/- 20 basis points for the 10-year yield. Although this could indirectly result in higher yields, it is by no means an exit from monetary stimulus. The yield curve control target
will likely be anchored at approximately 0%, and a negative interest rate policy will still be in place. For risky assets such as the bank’s annual 6 trillion yen ETF purchase program, fine-tuning could imply a “soft taper” as
in the case of current JGB purchases, with the bank
FIGURE I-20
The side effects of monetary easing are growing
Elevated ownership of outstanding government bond securities poses liquidity risks
Central bank holdings aspercentage |
|
50% |
|
|
|
|
|
|
|
Projections |
of outstanding securities |
40 |
|
|
|
|
|
|
|
|
|
30 |
|
|
|
|
|
|
|
|
||
20 |
|
|
|
|
|
|
|
|
||
10 |
|
|
|
|
|
|
|
|
||
0 |
2002 |
2017 |
2002 |
2016 |
2013 |
2017 |
2002 |
2017 |
||
|
|
|
Federal Reserve |
Bank of England |
European |
Bank of Japan |
|
|
Central Bank |
|
Source: Vanguard calculations, based on data from Moody’s Analytics Data Buffet, Bloomberg, and the IMF.
28

vk.com/id446425943
intervening only when the equity market falls below a certain threshold instead of treating the 6 trillion yen as a fixed, hard target.
Japan’s long-term economic growth prospects remain well below the average of G20 countries. Without the necessary structural reforms, accommodative monetary policy alone is unlikely to lift labor supply, investment, and productivity—and, hence, potential growth. In our view, confidence about economic prospects in the medium term, instead of low interest rates or easy access to credit, is the most important factor driving business investment decisions. The “third arrow” of Prime Minister Shinzo Abe’s economic platform has notched notable wins in corporate tax and governance reforms, enhancing labor participation of women
and older and foreign workers, reducing pay disparity between regular and nonregular employees, and embracing global trade liberalization. However,
progress on immigration reform has been marginal, even as the nation bears a decades-long demographic headwind. Continued deregulation and broader adoption of automation technology, especially in the consumption and service sectors, will be critical to supporting productivity growth in the long term.
Emerging markets: A mixed bag
Growth for emerging markets in aggregate is expected to be 4.6% in 2019; however, there will be vast heterogeneity among and within regions (see Figure I-21). The Asia region is expected to register slower growth as China slows down, but
it remains the fastest growing of the emerging-market regions. China is projected to register growth lower than 6.5% in 2019. Emerging-market Asian economies are
deeply integrated with China-led supply chains and will feel the repercussions of declining export demand from
FIGURE I-21
GDP growth rate
Emerging Asia |
|
|
6.6 |
|
|
6.3 |
|
|
|
Emerging |
|
|
Europe |
Sub-Saharan |
|
|
|
|
4.3 |
Africa |
|
|
|
|
|
3.9 |
Average percentage-point |
|
Latin |
change in real GDP growth |
|
America |
2014–2018 |
|
3.1 |
|
2.6 |
|
|
2.5 |
|
2019–2023 |
|
|
|
|
Size of circles corresponds
to region’s GDP ( ve-year average)
0.7
Notes: GDP based on current prices was used to create weighted markers for the regions. Real GDP growth data from the IMF was averaged for the five-year periods 2014–2018 and 2019–2023.
Source: IMF DataMapper.
29

vk.com/id446425943
China. However, the newly ratified Comprehensive and Progressive Agreement for Trans-Pacific Partnership could lessen the blow.
In the Latin American region, the growth projection is 2.8%, an improvement from last year. Central bank policy rates across most emerging-market regions remain low compared with the pre-normalization era (see Figure I-22). Across most emerging markets,
inflation and currency volatility will determine the pace of central bank hikes in 2019. Apart from some recent volatility, emerging-market currency volatility since normalization (2016–2018) has been lower than during the pre-normalization period (2010–2015).
Most risks for the emerging-market sector are external. The most notable are the U.S.-China trade tensions and a slowdown in China. Monetary policy normalization by the U.S. Federal Reserve has led to tighter financial conditions for emerging markets; this in turn has translated to volatility in emerging-market currencies and declining capital inflows. Populism and geopolitical risks, both at home and abroad, are downside risks for emerging markets. Corporate leverage has increased in emerging markets since the global financial crisis, with high levels of corporate debt issuance in nonlocal currency. A strengthening dollar could severely damage corporate balance sheets within emerging markets.
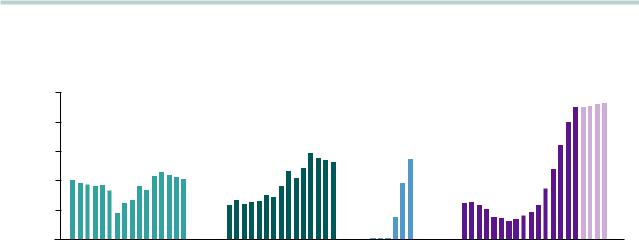
FIGURE I-22
Idiosyncratic emerging markets
Emerging markets represent a mixed basket; we expect tighter monetary policy to affect growth in countries with unsustainable borrowing
1.Current account (percentage of GDP as of December 2018)
2.Real effective exchange rate (REER) misalignment (as of November 2018)
3.International reserves (percentage of GDP as of Q4 2017)
4.Ease of doing business rank (as of Q4 2017)
5.Household debt (percentage of GDP as of Q1 2018)
6.Per capita GDP (in USD as of Q3 2018)
7.Inflation (percentage change in consumer prices as of September 2018)
1 2 3 4 5 6 7
Emerging markets Asia |
ν |
ν |
ν |
ν |
ν |
ν |
ν |
|
1.0% |
3.2% |
20% |
68 |
42.6% |
$6,104 |
3.4% |
||
|
||||||||
|
|
|
|
|
|
|
|
|
Emerging markets Europe |
ν |
ν |
ν |
ν |
ν |
ν |
ν |
|
–0.2% |
3.1% |
20% |
50 |
24.0% |
$11,322 |
7.2% |
||
|
||||||||
|
|
|
|
|
|
|
|
|
Latin America |
ν |
ν |
ν |
ν |
ν |
ν |
ν |
|
–2.2% |
6.1% |
20% |
77 |
23.5% |
$9,780 |
9.8% |
||
|
||||||||
|
|
|
|
|
|
|
|
Notes: Real exchange rate misalignment is defined as the deviation of the real effective exchange rate (REER) from its past five-year average. This vulnerability indicator is two-sided. Rapid appreciations or depreciations of a country’s exchange rate may indicate that flows of foreign funds into or out of the economy may be unsustainable. Depreciations in the exchange rate also reduce purchasing power and increase the risk of economic slowdown. The World Bank Ease of Doing Business score serves as the basis for ranking economies on their business environment and is an indication of an economy’s position relative to that of other economies.
Source: Vanguard calculations, based on data from the IMF World Economic Outlook, the Bureau of Industry and Security, the World Bank, and Moody’s Analytics Data Buffet.
30