

vk.com/id446425943
Sector, industry and style recommendations
In the table below, we assign a weight of 30% to the de-rating score, assuming the potential for a reversal in returns in 2019 and a recoup of 30% in the P/E decline. We assign a 70% weight to the 2019 composite score based on the key themes and drivers for the year. Based on the weighted average of the 2019 composite and de-rating score, our summary sector and IG allocation are:
Overweight: Healthcare, Communication Svcs, Energy, Industrials
Underweight: Utilities, Real Estate, Materials, and tactically u/w Technology
Neutral: Discretionary (prefer Consumer Svcs, some Retail), Staples (Food Bev Tob over Staples Retail, HH&Per Prod), Financials (Insurance over Banks, Div Fin)
We stick with leadership amongst the defensives, staying overweight Healthcare and underweight Utilities and REITs. Healthcare has the highest 2019 composite score based on: 1) outperformance at this stage of the cycle, 2) better margin trends, 3) little tariff risk, 4) dividend upside, and 5) solid growth and momentum. We stay neutral Staples after upgrading it in early Sept (link), but would look to potentially add some Staples exposure if the cycle slows more than we think next year. Similarly, Utilities have performed well this year, more than typical at this stage of the cycle; but we would also look to add exposure if there is a need to get more defensive next year or the sector gets relatively cheaper.
The 2019 composite score can be thought of as how we would be tilted if relative fundamentals, cycle profile and risks were the only deciding factors.
However, 2018 was far from a normal year and we are factoring in that some of this may be priced, and account for catch-up potential.
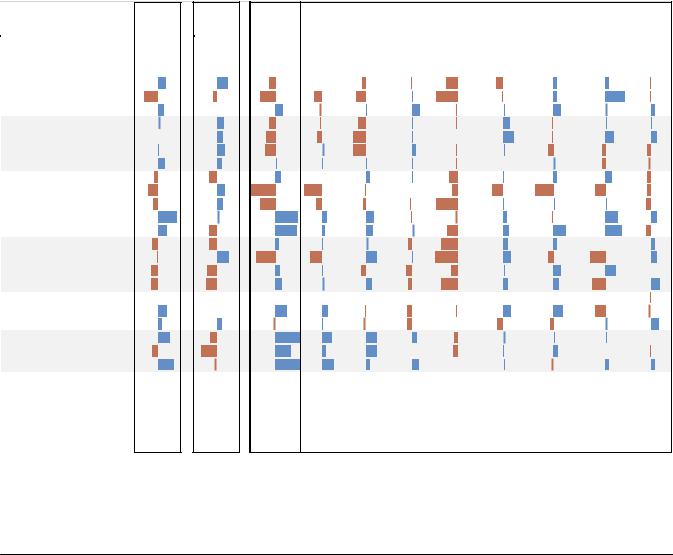
Figure 17: Sector and IG summary, recommendations and rationale
|
|
Avg wtd |
|
2018 De- |
2019 |
ISM |
Margin |
Pricing & |
Trade |
Dividend/ |
Growth/ |
C-Speak: |
Quality |
|||||||||||||||||||||||
Sector |
Rating |
|
Rating |
Composite |
Risk / |
Wages |
Payout |
Corp |
||||||||||||||||||||||||||||
30/70 |
|
Cycle |
|
Risk |
Momentum |
+ FCF |
||||||||||||||||||||||||||||||
|
|
|
(Catchup) |
|
Score |
Deceler |
Signal |
|
Upside |
Sentiment |
||||||||||||||||||||||||||
Energy |
O/W |
|
|
|
|
|
|
|
|
|
|
|
|
|
|
|
|
|
|
|
|
|
|
|
|
|
|
|
|
|
|
|
|
|
|
|
|
|
|
|
|
|
|
|
|
|
|
|
|
|
|
|
|
|
|
|
|
|
|
|
|
|
|
|
|
|
|
|
|
|
|
||
Materials |
U/W |
|
|
|
|
|
|
|
|
|
|
|
|
|
|
|
|
|
|
|
|
|
|
|
|
|
|
|
|
|
|
|
|
|
|
|
Industrials |
O/W |
|
|
|
|
|
|
|
|
|
|
|
|
|
|
|
|
|
|
|
|
|
|
|
|
|
|
|
|
|
|
|
|
|
|
|
|
|
|
|
|
|
|
|
|
|
|
|
|
|
|
|
|
|
|
|
|
|
|
|
|
|
|
|
|
|
|
|
|
|
|
||
Capital Goods
Com & Prof Svcs
Transportation
Financials Neutral
Banks |
Div Financials
Insurance
Cons Disc |
Neutral |
Autos & Comp
Cons Dur & App
Consumer Svcs
Retailing
Technology |
U/W |
Semis & Equip
Software & Svcs
Tech Hdwr & Equip
Comm Svcs |
O/W |
|
|
|
|
|
|
|
|
|
|
|
|
|
|
Media & Entertain
Telecom
Health Care |
O/W |
HC Equip & Svcs
Pharma Biotech & LS
Cons Staples |
Neutral |
|
|
|
|
|
|
|
|
|
|
|
|
|
|
|
|
|
|
|
|
|
|
|
|||||
Food & Stap Retail |
|
|
|
|
|
|
|
|
|
|
|
|
|
|
|
|
|
|
|
|
|
|
|
|
|
|
|
|
|
|
|
|
|
|
|
|
|
|
|
|
|
|
|
|
|
|
|
|
|
|
|
|
|
|
|
|
|
|
|
Food Bev & Tob |
|
|
|
|
|
|
|
|
|
|
|
|
|
|
|
|
|
|
|
|
|
|
|
|
|
|
|
|
|
|
|
|
|
|
|
|
|
|
|
|
|
|
|
|
|
|
|
|
|
|
|
|
|
|
|
|
|
|
|
HH & Personal Prod |
|
|
|
|
|
|
|
|
|
|
|
|
|
|
|
|
|
|
|
|
|
|
|
|
|
|
|
|
|
|
|
|
|
|
|
|
|
|
|
|
|
|
|
|
|
|
|
|
|
|
|
|
|
|
|
|
|
|
|
Utilities |
U/W |
|
|
|
|
|
|
|
|
|
|
|
|
|
|
|
|
|
|
|
|
|
|
|
|
|
|
||
|
|
|
|
|
|
|
|
|
|
|
|
|
|
|
|
|
|
|
|
|
|
|
|
|
|||||
Real Estate |
U/W |
|
|
|
|
|
|
|
|
|
|
|
|
|
|
|
|
|
|
|
|
|
|
|
|
|
|
||
|
|
|
|
|
|
|
|
|
|
|
|
|
|
|
|
|
|
|
|
|
|
|
|
|
|
|
|
|
|
Source: UBS
US Equity Strategy 13 November 2018 |
13 |
vk.com/id446425943
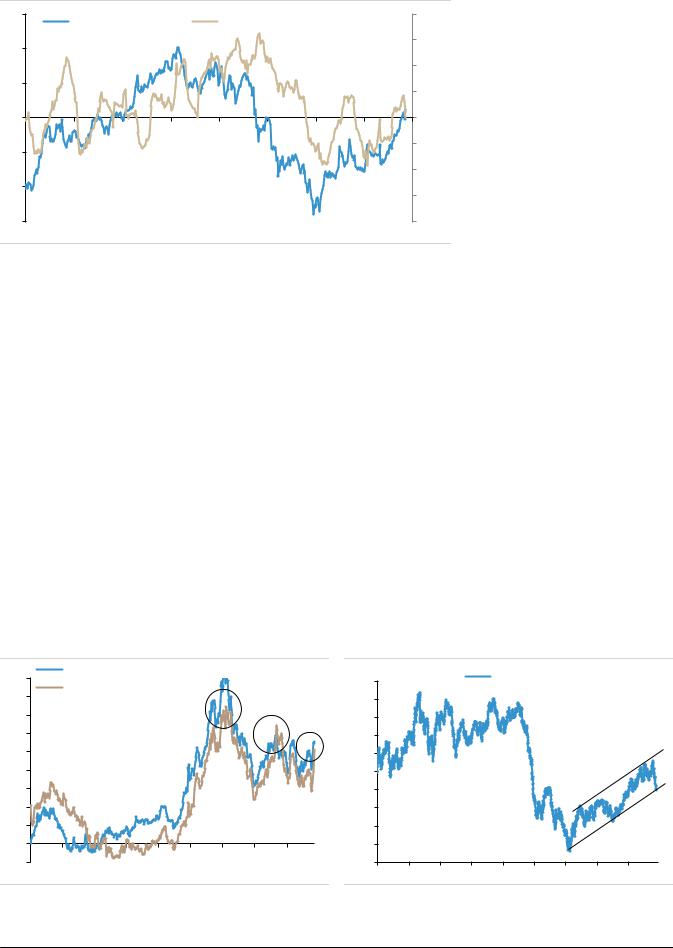
Figure 18: Health Care relative NTM P/E and EPS revisions (vs. S&P 500)
3x |
Relative P/E (vs S&P 500) |
Earnings revisions vs S&P 500 (3m, rhs) |
40% |
|||||
|
|
|||||||
2x |
|
|
|
|
|
|
|
30% |
|
|
|
|
|
|
|
|
|
|
|
|
|
|
|
|
|
20% |
1x |
|
|
|
|
|
|
|
10% |
|
|
|
|
|
|
|
|
|
0x |
|
|
|
|
|
|
|
0% |
-1x |
|
|
|
|
|
|
|
-10% |
|
|
|
|
|
|
|
|
|
|
|
|
|
|
|
|
|
-20% |
-2x |
|
|
|
|
|
|
|
-30% |
|
|
|
|
|
|
|
|
|
-3x |
|
|
|
|
|
|
|
-40% |
11 |
12 |
13 |
14 |
15 |
16 |
17 |
18 |
19 |
Source: FactSet, UBS
Healthcare relative revisions are supportive and the sector is not yet trading at a premium versus the market.
We look for a relative catch-up and value amongst the cyclicals. At this stage of the cycle, we would normally be reducing risk exposure selectively within certain cyclicals. Materials has been our core cyclical underweight. However, the substantial de-rating in 2018 has made it more complicated since so much is now priced.
Energy over Materials for a 100bp higher yield and oil cycle upside.
Materials is one of the worst performing industries at this stage of the cycle, and risks from a China slowdown are notable. On the other hand, so many investors were positive on oil/energy this year but a number of factors have weighed the trade down. Energy GDP growth is unlikely to outstrip overall GDP, thus lower growth demands a higher dividend yield. A 1%+ spread is our value point, and now Energy dividend yields are over 1% above the market and Materials. With oil at a key resistance point and the positioning unwind in oil largely done, we tactically upgrade Energy again to overweight (last time was in March link).
Financials remains a neutral, we now tilt toward Insurance over Banks and Diversified Fins. We have been neutral Financials since we launched in Nov-17, and relative fundamentals and the cycle would lead us to be relatively cautious on the sector. However, the de-rating in 2018 means that a lot is priced. Insurance stands out as having a more attractive valuation vs. fundamentals trade-off.
Energy should outperform Materials at this stage of the cycle based on history, and the 100bp higher dividend yield gives relative carry and cushion as well.
Figure 19: Dividend yield difference |
Figure 20: Oil prices are still in an uptrend |
1.8 |
Energy - S&P 500 div yield spread |
|
|
|
USD / barrel |
|
|
|
Oil price (WTI) |
|
|
|
|||||
Energy - Materials div yield spread |
|
|
120 |
|
|
|
|
|
|
||||||||
|
|
|
|
|
|
|
|
|
|
|
|||||||
1.6 |
|
|
110 |
|
|
|
|
|
|
|
|
||||||
|
|
|
|
|
|
|
|
|
|
|
|
|
|
|
|
||
1.4 |
|
|
|
|
|
|
|
|
100 |
|
|
|
|
|
|
|
|
1.2 |
|
|
|
|
|
|
|
|
90 |
|
|
|
|
|
|
|
|
1.0 |
|
|
|
|
|
|
|
|
80 |
|
|
|
|
|
|
|
|
0.8 |
|
|
|
|
|
|
|
|
70 |
|
|
|
|
|
|
|
|
0.6 |
|
|
|
|
|
|
|
|
60 |
|
|
|
|
|
|
|
|
0.4 |
|
|
|
|
|
|
|
|
50 |
|
|
|
|
|
|
|
|
0.2 |
|
|
|
|
|
|
|
|
40 |
|
|
|
|
|
|
|
|
0.0 |
|
|
|
|
|
|
|
|
30 |
|
|
|
|
|
|
|
|
-0.2 |
|
|
|
|
|
|
|
|
20 |
|
|
|
|
|
|
|
|
10 |
11 |
12 |
13 |
14 |
15 |
16 |
17 |
18 |
10 |
11 |
12 |
13 |
14 |
15 |
16 |
17 |
18 |
Source: FactSet, UBS |
|
|
|
|
|
|
|
Source: Haver, UBS |
|
|
|
|
|
|
|
||
US Equity Strategy 13 November 2018 |
14 |
vk.com/id446425943
Communication Svcs and Industrials over Tech for similar revisions+growth that de-rated ~20%. Based on forward P/E, Industrials are the cheapest they have been relative to Tech in the current cycle, with relative valuations moving by ~20% over the last year. Similarly, Communication Services have de-rated relative to Tech by nearly 20% since the middle of last year. However, NTM EPS growth of 10% for Tech is lower than that of Industrials (12%) and only slightly above Communication Svcs, which has higher sales growth. Further, earnings revision ratios for the three are now fairly similar after an extended period of relative earnings momentum favoring the Tech sector. Trade risks would also hurt Tech relative to Comm Svcs.
Discretionary remains a neutral, we prefer Consumer Svcs and select Retail.
We downgraded Discretionary to neutral in early Sept (link) as valuations had moved a lot and risks had increased, particularly in Retail. We remain positive on the consumer given real wage growth and a savings rate that is still not low. Consumer Svcs stands out as an area with still solid growth+momentum and that de-rated relative to the market and Retail.
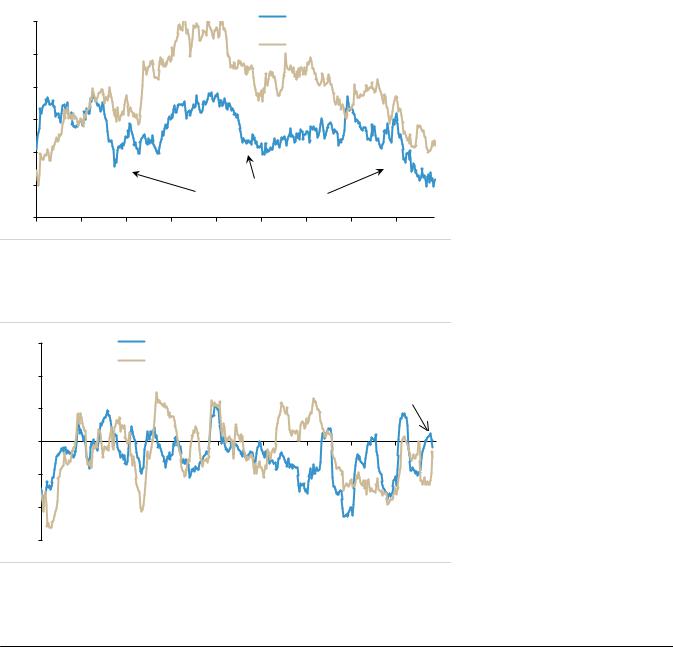
Figure 21: Industrials + Comm Svcs vs. Tech forward P/E
1.40 |
Industrials / Tech (NTM P/E) |
|
|
1.30 |
Comm svcs / Tech (NTM P/E) |
|
1.20
1.10
1.00
0.90
~20% relative de-rating
0.80
10 |
11 |
12 |
13 |
14 |
15 |
16 |
17 |
18 |
Source: FactSet, UBS Note: Fixed constituents.
We see the pair of Industrials that is more cyclical and Comm Svcs that has less cycle exposure against Tech as an attractive catch-up trade if we do see the re-rating we expect.
Figure 22: Industrials + Comm Svcs vs. Tech EPS revisions
60%
40%
20%
0%
-20%
-40%
-60%
Industrials vs Tech (3m earnings revision) Comm svcs vs Tech (3m earnings revision)
Revisions similar to Tech but at a large discount
10 |
11 |
12 |
13 |
14 |
15 |
16 |
17 |
18 |
Source: FactSet, UBS Note: Fixed constituents.
US Equity Strategy 13 November 2018 |
15 |
vk.com/id446425943
Style and factor views: prefer quality, large over small, momentum+ growth over value strategically but tactically look for laggards
We continue to prefer quality tactically which tends to be the best performing factor before, during and after a vol spike (link); and strategically through the ISM cycle it is the best performing factor as well.
Momentum is the best performing factor at this stage of the cycle, and we think that the momentum unwind is largely done with the current drawdown in line with past medians. We would look to buy higher momentum stocks that have derated and still have solid fundamental trends.
We think the growth vs. value decision is more difficult given the de-rating vs. fundamentals trade-off and the potential for a reversal over coming months. We think growth should outperform until the cycle really slows and the ISM falls below 52. However, some value is likely to see a catch-up bid into 2019.
We still favor large caps over small caps at this stage of the cycle. Small caps (Russell 2000 ex fins) have higher leverage and a much bigger 5pp+ headwind to earnings from higher Fed rates. Margins are lower for small caps while wage pressures are greater and pricing power is weaker. If there is a slowdown, we are likely to see it in small caps first in our view given financial and operating leverage.
Stock baskets to capitalize on key themes
Based on the key themes for 2019, we would highlight four stock baskets:
Laggards with solid fundamentals: stocks that have significantly de-rated / |
These laggards could outperform |
underperformed YTD but have solid earnings (top 60%) and sales revisions. |
in a reversal as risks reprice. |
Dividend growth upside: stocks that have high dividend growth and low |
Dividend growth should be a key |
payout ratios (vs. market and own history) should see strong DPS growth. |
2019 theme as payout ratios rise. |
High momentum and growth: stocks with high EPS/sales revisions and price |
Momentum should lead at this |
momentum and less margin risk based on sales acceleration and margin trends. |
stage based on prior cycles. |
Low momentum, limited growth: stocks with low price momentum and |
Low momentum stocks could see |
weak EPS/sales revisions with slowing sales growth and weak margin trends. |
notable weakness in this phase. |
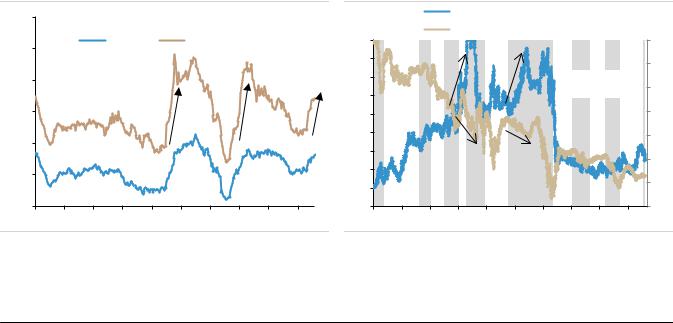
Figure 23: Dividend growth – median and 75th percentile for the S&P 500
Figure 24: High and low momentum performance through the ISM cycles
0.30 |
Dividend 1yr trailing growth (non sector neutral) |
||||||||
|
|
|
|
|
|
|
|
|
|
0.25 |
|
|
Median |
|
|
75th percentile |
|
1.8 |
|
|
|
|
|
|
|
|
|
1.7 |
|
|
|
|
|
|
|
|
|
|
|
0.20 |
|
|
|
|
|
|
|
|
1.6 |
|
|
|
|
|
|
|
|
|
|
|
|
|
|
|
|
|
|
|
1.5 |
0.15 |
|
|
|
|
|
|
|
|
1.4 |
0.10 |
|
|
|
|
|
|
|
|
1.3 |
|
|
|
|
|
|
|
|
1.2 |
|
|
|
|
|
|
|
|
|
|
|
0.05 |
|
|
|
|
|
|
|
|
1.1 |
|
|
|
|
|
|
|
|
|
|
|
|
|
|
|
|
|
|
|
1.0 |
0.00 |
|
|
|
|
|
|
|
|
0.9 |
90 |
93 |
96 |
99 |
02 |
05 |
08 |
11 |
14 |
17 |
High momentum vs median
Low momentum vs median (rhs)
|
|
|
|
|
|
|
|
|
|
1.0 |
|
|
|
|
|
|
|
|
|
|
0.9 |
|
|
|
|
|
|
|
Shading = ISM |
0.8 |
||
|
|
|
|
|
|
|
peak to trough |
|||
|
|
|
|
|
|
|
|
|
|
0.7 |
|
|
|
|
|
|
|
|
|
|
0.6 |
|
|
|
|
|
|
|
|
|
|
0.5 |
|
|
|
|
|
|
|
|
|
|
0.4 |
|
|
|
|
|
|
|
|
|
|
0.3 |
90 |
93 |
96 |
99 |
02 |
05 |
08 |
11 |
14 |
17 |
|
Source: S&P, Compustat, FactSet, UBS |
Source: S&P, IBES, CRSP, Bloomberg, UBS |
US Equity Strategy 13 November 2018 |
16 |