

vk.com/id446425943
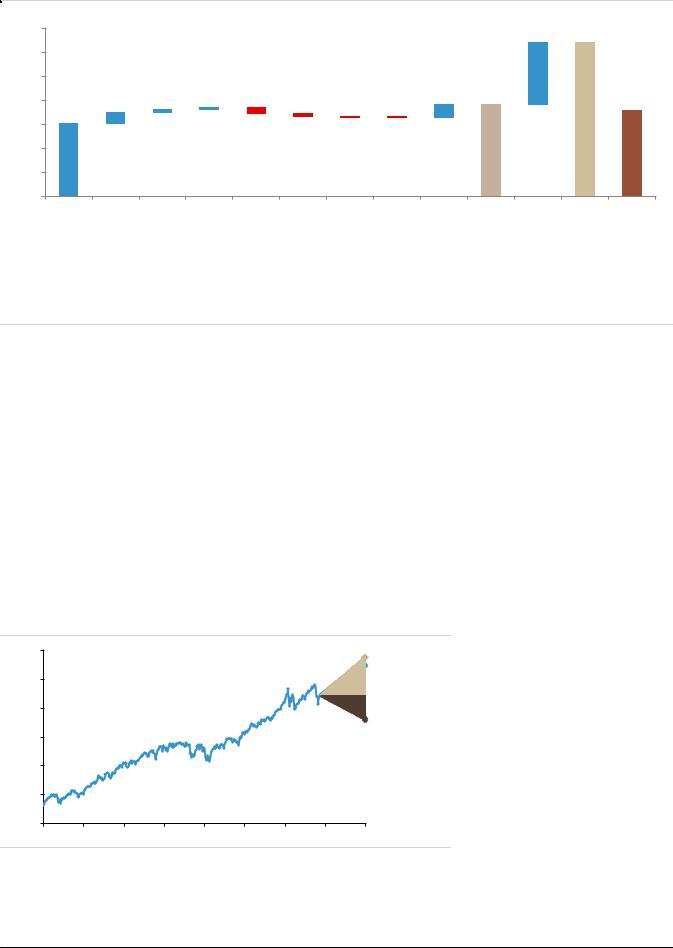
Figure 11: Macro drivers of the P/E are not at "average" levels and point to higher valuations
S&P 500 fitted P/E (trailing): contribution by variables based on current vs averages
35 |
|
|
|
|
|
|
|
|
|
13.0 |
32.3 |
|
|
|
|
|
|
|
|
|
|
||
30 |
|
|
|
|
|
|
|
|
|
|
|
25 |
|
|
|
|
|
|
|
|
|
|
|
20 |
2.2 |
0.5 |
0.4 |
|
|
|
|
2.8 |
19.2 |
|
17.9 |
|
|
|
|
|
|
|
|||||
15.3 |
|
|
|
-1.0 |
-0.4 |
|
|
|
|
|
|
15 |
|
|
|
-0.1 |
-0.0 |
|
|
|
|
||
10 |
|
|
|
|
|
|
|
|
|
|
|
5 |
|
|
|
|
|
|
|
|
|
|
|
0 |
|
|
|
|
|
|
|
|
|
|
|
Avg. PE |
US 1Y |
CPI vol. |
US 10Y- |
Dividend |
EPS dev'n |
Credit |
Real GDP |
Div Tax |
Fitted P/E |
EPS LTG |
Fitted P/E Actual P/E |
('55-'07) |
|
|
1Y |
Payout |
from |
Spread |
YoY |
Rate % |
ex EPS |
(vs avg) |
|
|
|
|
|
|
trend |
|
|
|
LTG |
|
|
Beta |
-0.72 |
-0.97 |
-1.22 |
0.10 |
-0.12 |
-0.74 |
0.03 |
-0.08 |
|
2.45 |
|
Current |
2.73 |
0.36 |
0.46 |
33.77 |
7.73 |
2.06 |
3.04 |
23.80 |
|
5.60 |
|
Avg |
5.81 |
0.87 |
0.78 |
43.97 |
2.53 |
1.79 |
3.41 |
56.68 |
|
0.29 |
|
('55-'07) |
|
|
|||||||||
|
|
|
|
|
|
|
|
|
|
|
Source: S&P, FactSet, Bloomberg, Haver, UBS
Framing upside and downside using scenario analysis
Major market uncertainties concerning where we are in the cycle, trade, and central bank policy form the upside and downside cases for the S&P 500 in 2019 and 2020. We use the scenarios laid out by our economists in their outlook (link).
To frame the potential impact on earnings and valuation, we consider upside scenarios in which 1) trade tensions dissolve and existing tariffs are eliminated, and 2) the US economy has further room to run, with structural improvements allowing above potential growth to continue. To frame the downside, we consider 1) trade escalation, in which all US-China trade is subject to 25% tariffs; 2) that we are later in the cycle than thought, and Central Banks accelerate hiking to curb inflation while growth slows; and 3) there is a US recession in 2020.
Figure 12: Risks skewed to the upside from current levels
3,400 |
|
|
|
|
|
|
|
S&P 500 = 3305 |
|
|
|
|
|
|
|
|
|
3,000 |
|
|
|
|
|
|
|
S&P 500 = 3200 |
|
|
|
|
|
|
|
|
|
2,600 |
|
|
|
|
|
|
|
S&P 500 = 2445 |
|
|
|
|
|
|
|
|
|
2,200 |
|
|
|
|
|
|
|
|
1,800 |
|
|
|
|
|
|
|
|
1,400 |
|
|
|
|
|
|
|
|
1,000 |
|
|
|
|
|
|
|
|
12 |
13 |
14 |
15 |
16 |
17 |
18 |
19 |
20 |
Source: FactSet, UBS
We see the probability of downside increasing; however, the balance of risks is still to the upside as a recession remains unlikely.
Our upside case of 15% based on the S&P 500 finishing the year at 2875 would point to 3305.
On the other hand, our 15% downside case would point to 2445.
US Equity Strategy 13 November 2018 |
8 |

vk.com/id446425943
Upside scenarios: de-escalation and US structural divergence
The clearest case for upside in 2019 in our view would be the de-escalation of trade tensions with China. The elimination of existing tariffs would boost earnings growth by 1.7% to 7.5%, and 2020 earnings would see a similar lift. We would also expect multiple expansion as uncertainty and the risk to growth is removed (~0.3x). In the case of de-escalation, we could see a 15% return for the S&P 500 assuming that the 10y stays relatively contained at 3.4% and the USD is relatively well behaved.
The scenario of US structural divergence would provide similar ~15% upside in 2019, as the US economy is stronger than expected. Our economists see US GDP growth in 2020 rising to 2.8% in this case. However, the Fed would hike by much more and the curve would likely invert by quite a bit acting as a slight headwind. But near double-digit earnings growth in 2020 would support valuations and thus would see ~15% type returns.
Downside scenarios: trade escalation, US recession, CBs behind curve
Further escalation of trade tensions would be a catalyst for downside in 2019, assuming US GDP growth slows to 1.6% and EPS growth would be essentially flat. The multiple would take a hit as growth concerns get priced, though lower rates would provide a buffer. The scenario assumes 25% tariffs on all US-China trade and the CNY moves to 8.0. In this case, the USD could be a notable headwind as well and the fall in oil/commodities would weigh on earnings.
We think a 2020 US recession could lead to 15% downside as the market prices some of the recession in 2019 and the rest the following year. In our recession scenario, S&P 500 EPS is estimated to fall by 15% with US GDP close to flat for the year in 2020. The magnitude of the contraction assumed by our economists is similar to 2001. The decline in rates with the 10y falling to 0.9% in 2020 would provide an important support for the multiple. The last scenario assumes that CBs tighten more aggressively even though growth is not stronger, leading to a flattish equity market as multiple contraction offsets earnings growth in 2019.
Figure 13: Scenario analysis with summary assumptions and potential impacts
|
|
Base case |
|
Upside |
|
|
|
Downside |
|
|
|
|||
|
|
|
|
Trade de-escalation |
Structural divergence |
Trade escalation |
US 2020 recession |
CBs behind curve |
|
|||||
|
2018 |
2019 |
2020 |
2019 |
2020 |
2019 |
2020 |
2019 |
2020 |
2019 |
2020 |
2019 |
2020 |
|
|
|
Growth slows in 2019-20, |
US-China tariffs lifted in |
US manufacturing |
25% tariffs on all US- |
Wage/inflation |
Later cycle than |
|
||||||
Scenario description |
|
pressure, waning |
expected; |
|
||||||||||
|
Fed hikes 3x, 25% tariffs |
Jan-19. Car tariffs are |
stronger than expected, |
China trade, and |
|
|||||||||
|
|
confidence, tightening |
wage/inflationary |
|
||||||||||
|
|
on $200bn start in 2019. |
lowered to zero. |
helped partly by tariffs. |
USD/CNY goes to 8.0. |
|
||||||||
|
|
of financial conditions. |
pressure. |
|
||||||||||
|
|
|
|
|
|
|
|
|
|
|
||||
Macro drivers |
|
|
|
|
|
|
|
|
|
|
|
|
|
|
US GDP y/y |
2.8% |
2.4% |
2.0% |
2.5% |
2.1% |
2.5% |
2.8% |
1.6% |
1.7% |
2.2% |
0.4% |
2.3% |
1.4% |
|
Global GDP y/y |
3.7% |
3.5% |
3.5% |
3.7% |
3.6% |
3.6% |
3.7% |
3.1% |
3.2% |
3.5% |
2.7% |
3.5% |
3.2% |
|
Fed rate |
2.0% |
2.8% |
3.1% |
3.0% |
4.1% |
2.9% |
4.7% |
2.2% |
2.8% |
2.6% |
1.1% |
2.9% |
4.2% |
|
10y |
3.1% |
3.3% |
2.9% |
3.4% |
3.0% |
3.5% |
3.5% |
2.5% |
2.1% |
2.0% |
0.9% |
2.7% |
2.4% |
|
Earnings |
|
|
|
|
|
|
|
|
|
|
|
|
|
|
Earnings growth y/y |
22.4% |
5.8% |
3.0% |
7.5% |
4.6% |
7.2% |
9.7% |
-1.3% |
3.3% |
3.0% |
-14.1% |
7.4% |
1.6% |
|
Buybacks |
1.0% |
1.4% |
1.3% |
1.2% |
1.2% |
1.2% |
1.2% |
1.0% |
0.5% |
0.5% |
-1.0% |
1.0% |
0.0% |
|
EPS growth |
23.4% |
7.2% |
4.3% |
8.7% |
5.8% |
8.4% |
10.9% |
-0.3% |
3.8% |
3.5% |
-15.1% |
8.4% |
1.6% |
|
EPS |
163.5 |
175 |
183 |
178 |
188 |
177 |
196 |
163 |
169 |
169 |
144 |
177 |
180 |
|
Price target |
|
|
|
|
|
|
|
|
|
|
|
|
|
|
S&P 500 price target |
2875 |
3200 |
3325 |
3306 |
3505 |
3306 |
3604 |
2677 |
2810 |
2731 |
2458 |
2875 |
2731 |
|
y/y return |
|
11.3% |
3.9% |
15.0% |
6.0% |
15.0% |
9.0% |
-6.9% |
5.0% |
-5.0% |
-10.0% |
0.0% |
-5.0% |
|
Valuation |
|
|
|
|
|
|
|
|
|
|
|
|
|
|
Implied P/E multiple |
17.6 |
18.3 |
|
18.6 |
|
18.7 |
|
16.4 |
|
16.1 |
|
16.2 |
|
|
y/y change |
|
3.9% |
|
5.8% |
|
6.1% |
|
-6.6% |
|
-8.2% |
|
-7.8% |
|
|
Implied forward P/E (@ 10%) |
15.8 |
16.6 |
|
16.9 |
|
17.0 |
|
14.9 |
|
14.7 |
|
14.7 |
|
|
|
|
|
|
|
|
|
|
|
|
|
|
|
|
|
Source: UBS
US Equity Strategy 13 November 2018 |
9 |