


vk.com/id446425943
Bucking the Trend: Financial Acquisitions Mount
As financial buyers grow more comfortable with tech, particularly companies with recurring revenue, they’re increasingly stepping in to purchase those startups. Financial buyers also are filling a void – buying companies that may be unable to attract soaring venture rounds.
US VC-Backed M&A: Strategic vs. Financial Activity |
Financial Acquisitions: % of Total M&A Activity |
|||||||||||||
800 |
|
|
|
|
|
|
|
|
40% |
|
|
|
|
|
|
|
Strategic Acquisitions |
|
|
|
|
|
|
|
|
|
|||
|
|
|
|
|
|
|
|
|
|
|
|
|
||
|
|
|
|
|
|
|
|
|
|
|
|
|
||
700 |
|
|
Financial Acquisitions |
|
|
|
|
35% |
|
|
|
|
|
|
|
|
|
|
|
|
|
|
|
|
|
||||
|
|
|
|
|
|
|
|
|
|
|
|
|
||
|
|
|
|
|
|
|
|
|
|
|
|
|
||
600 |
|
|
|
|
|
|
|
|
30% |
|
|
|
|
|
|
|
|
|
|
|
|
|
|
|
|
|
|
||
500 |
|
|
|
|
|
|
|
|
25% |
|
|
|
|
|
|
|
|
|
|
|
|
|
|
|
|
|
|
||
400 |
|
|
|
|
|
|
|
|
20% |
|
|
|
|
|
|
|
|
|
|
|
|
|
|
|
|
|
|
||
300 |
|
|
|
|
|
|
|
|
15% |
|
|
|
|
|
|
|
|
|
|
|
|
|
|
|
|
|
|
||
200 |
|
|
|
|
|
|
|
|
10% |
|
|
|
|
|
|
|
|
|
|
|
|
|
|
|
|
|
|
||
100 |
|
|
|
|
|
|
|
|
5% |
|
|
|
|
|
|
|
|
|
|
|
|
|
|
|
|
|
|
||
0 |
|
|
|
|
|
|
|
|
0% |
|
|
|
|
|
|
|
|
|
|
|
|
|
|
|
|
|
|
||
2010 |
2012 |
2014 |
2016 |
2018 |
|
2010 |
2012 |
2014 |
2016 |
2018 |
||||
Source: PitchBook and SVB analysis. |
State of the Markets: Second Quarter 2019 |
17 |
vk.com/id446425943
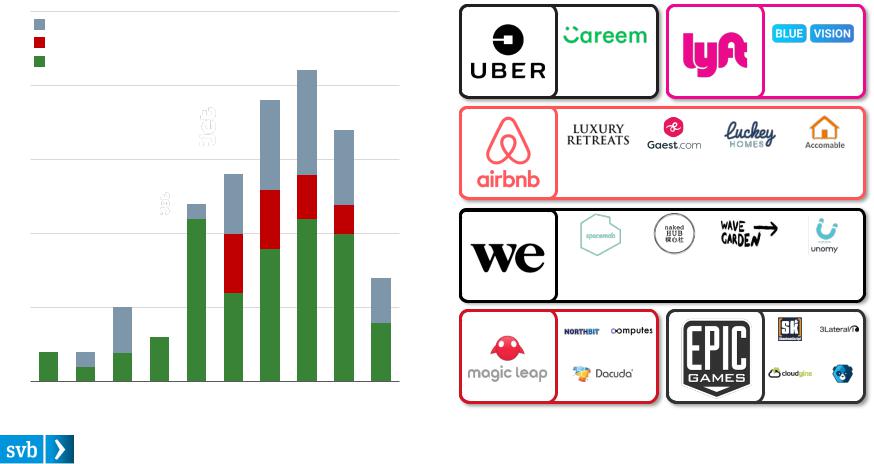
US Tech Looks To International Opportunities
The innovation economy’s best and brightest are putting their abundant capital to work abroad, with 20% of their acquisitions taking place outside of the US. On the back of a strong dollar, their capital is going even further for expansion overseas.
International Acquisitions by US Tech Unicorns
25
Rest of World
Asia
Europe
20
15
10
5
0
2010 |
2013 |
2016 |
2019 |
Notable Int’l Acquisitions by US Tech Decacorns
UAE |
|
|
|
United Kingdom |
|
$3.1B Acquisition |
|
|
$72M Acquisition |
||
March 2019 |
|
|
Oct.2018 |
||
Canada |
|
Demark |
France |
United Kingdom |
|
$300M Acq. |
Acquisition |
Acquisition |
Acquisition |
||
Feb. 2017 |
|
Jan. 2019 |
Dec. 2018 |
Nov. 2017 |
|
Singapore |
|
China |
Spain |
|
Israel |
$500M Acq. |
$400M Acq. |
Acquisition |
Acquisition |
||
Aug. 2017 |
|
Apr. 2018 |
Nov. 2017 |
Aug. 2017 |
|
Israel |
Italy |
|
Canada |
Serbia |
|
Switzerland |
|
|
UK |
Finland |
|
Source: PitchBook, company websites and SVB analysis. |
State of the Markets: Second Quarter 2019 |
18 |

vk.com/id446425943
Regulations: Potential New Hurdles for Exits
State of the Markets: Second Quarter 2019 |
19 |

vk.com/id446425943
Tech Giants Spend Big but Now Face Scrutiny
The Big 5 US tech giants have gone unchecked despite their growing influence. Now, as they outspend the entire tech venture ecosystem in R&D dollars alone, they are facing increasing political scrutiny. Are their innovations a true benefit to society?
R&D Expenditure by Big 5 US Tech Companies vs. US Tech Venture Capital Invested
$100B
$80B
$60B
$40B
$20B
$0B
V e n t u r e
|
|
|
|
|
|
|
|
|
|
|
|
|
|
|
|
|
|
2010 |
2011 |
2012 |
2013 |
2014 |
2015 |
2016 |
2017 |
2018 |
2010 |
2011 |
2012 |
2013 |
2014 |
2015 |
2016 |
2017 |
2018 |
Source: PitchBook, S&P Capital IQ and SVB analysis. |
State of the Markets: Second Quarter 2019 |
20 |