

vk.com/id446425943
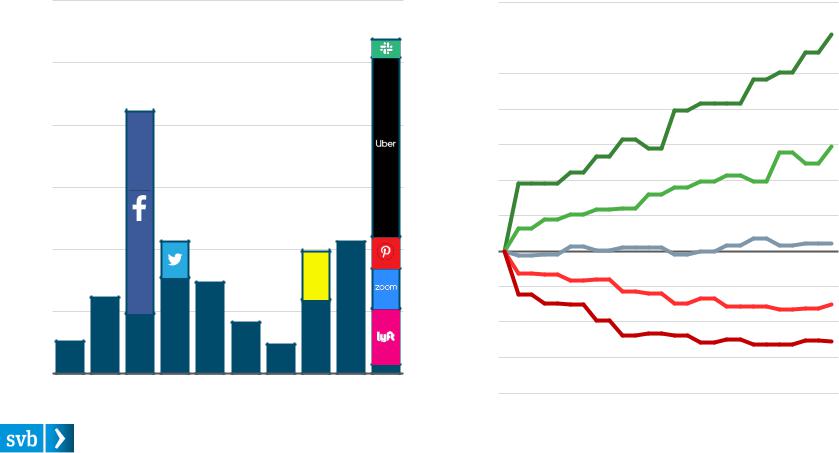
Next Wave of Capital Will Come After Lockups
Early signs indicate 2019 should be the most robust year of value realization via IPOs for U.S. venture-backed tech companies this decade. But the IPO listing is only the start of the journey for insiders, including venture firms, who must weather six months of market movement before exiting.
Aggregate Valuation of US VC-Backed Tech IPOs
$150B
$125B
$100B
$75B
$50B |
|
$25B |
|
$0B |
|
2010 |
2013 |
2016 |
2019 |
Post-IPO Performance for 2010–2018 US Tech IPOs
Percentiles:
+70%
+60% |
|
90th |
|
+50%
+40%
+30% |
|
|
|
|
|
|
|
|
|
|
|
75th |
+20% |
|
|
|
|
|
|
|
|
|
|
|
|
+10% |
|
|
|
|
|
|
|
|
|
|
|
|
0% |
|
|
|
|
|
|
|
|
|
|
|
50th |
|
|
|
|
|
|
|
|
|
|
|
|
|
1 |
3 |
5 |
7 |
9 |
11 |
13 |
15 |
17 |
19 |
21 |
23 |
25 |
-10%
25th
-20%
10th
-30%
-40%
Source: PitchBook, S&P Capital IQ, CBInsights and SVB analysis. |
State of the Markets: Second Quarter 2019 |
13 |

vk.com/id446425943
M&A: Acquisitions Slow as Startups Aim for Growth
State of the Markets: Second Quarter 2019 |
14 |

vk.com/id446425943
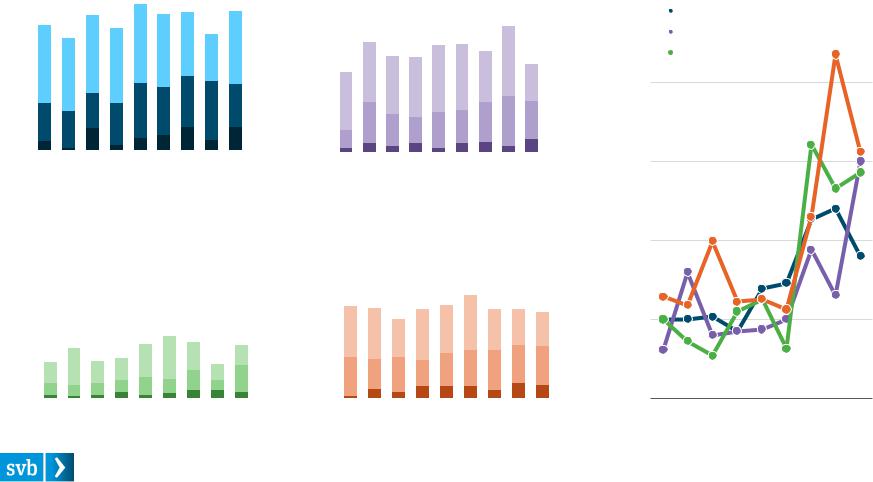
Opting for Growth Capital vs. an Early Exit
With the abundance of available capital, firms are increasingly choosing growth rounds – even megagrowth rounds – over similar-sized exits. This could signal that companies want to mature before securing an even bigger exit. Or are these firms simply shying away from public market scrutiny?
US Tech Growth Rounds vs. Exits: 2010–2018 |
|
US Tech Mega-Rounds vs. Mega-Exits: 2010—2018 |
|||||||||||||
150 |
|
|
|
|
|
|
|
150 |
|
|
|
|
|
|
|
|
|
|
|
|
|
Mega-Rounds: $100M+ |
|
|
|
||||||
|
|
Growth Rounds: $50M–$100M |
|
|
|
|
|
|
|
||||||
|
|
|
|
|
|
|
|
|
|
|
|||||
|
|
|
|
|
|
|
|
|
|
||||||
125 |
|
|
Exits: $250M–$1B |
|
|
|
125 |
|
|
Mega-Exits: $1B+ |
|
|
|
||
|
|
|
|
|
|
|
|
|
|
||||||
|
|
|
|
|
|
|
|
|
|||||||
|
|
|
|
|
|
|
|
|
|
|
|
|
|
||
|
|
|
|
|
|
|
|
|
|
|
|||||
|
|
|
|
|
|
|
|
|
|
|
|
|
|
||
100 |
|
|
|
|
|
|
|
100 |
|
|
|
|
|
|
|
|
|
|
|
|
|
|
|
|
|
|
|
|
|
||
75 |
|
|
|
|
|
|
|
75 |
|
|
|
|
|
|
|
|
|
|
|
|
|
|
|
|
|
|
|
|
|
||
50 |
|
|
|
|
|
|
|
50 |
|
|
|
|
|
|
|
|
|
|
|
|
|
|
|
|
|
|
|
|
|
||
25 |
|
|
|
|
|
|
|
25 |
|
|
|
|
|
|
|
|
|
|
|
|
|
|
|
|
|
|
|
|
|
||
0 |
|
|
|
|
|
|
|
0 |
|
|
|
|
|
|
|
|
|
|
|
|
|
|
|
|
|
|
|
|
|
||
2010 |
2012 |
2014 |
2016 |
2018 |
2010 |
2012 |
2014 |
2016 |
2018 |
||||||
Source: PitchBook and SVB analysis. |
State of the Markets: Second Quarter 2019 |
15 |
vk.com/id446425943
Across US, Valuations Climb for M&A
While fundraising and investing have soared this decade, the number of acquisitions taking place has remained constant. However, deals executed in 2018 were roughly 3x the size of those in 2010.
VC-Backed M&A: Bay Area |
|
|
|
|
VC-Backed Tech M&A: East Coast |
|||||||||||||||||||||||||||||||||||||||||||||
100 |
|
|
$1B+ |
|
|
|
$100M–1B |
|
$1–100M |
|
|
|
|
100 |
|
|
$1B+ |
|
|
|
$100M–1B |
|
|
$1–100M |
|
|
|
|
||||||||||||||||||||||
|
|
|
|
|
|
|
|
|
|
|
|
|
|
|
|
|
|
|
|
|
||||||||||||||||||||||||||||||
|
|
|
|
|
|
|
|
|
|
|
|
|
|
|
|
|
|
|
|
|
|
|
|
|
|
|
|
|
|
|
|
|
|
|
|
|
|
|
|
|
|
|
|
|
|
|
|
|
||
|
|
|
|
|
|
|
|
|
|
|
|
|
|
|
|
|
|
|
|
|
|
|
|
|
|
|
|
|
|
|
|
|
|
|
|
|
|
|
|
|
|
|
|
|
|
|
|
|
||
|
|
|
|
|
|
|
|
|
|
|
|
|
|
|
|
|
|
|
|
|
|
|
|
|
|
|
|
|
|
|
|
|
|
|
|
|
|
|
|
|
|
|
|
|||||||
75 |
|
|
|
|
|
|
|
|
|
|
|
|
|
|
|
|
|
|
|
|
|
|
|
|
75 |
|
|
|
|
|
|
|
|
|
|
|
|
|
|
|
|
|
|
|
|
|
|
|
|
|
|
|
|
|
|
|
|
|
|
|
|
|
|
|
|
|
|
|
|
|
|
|
|
|
|
|
|
|
|
|
|
|
|
|
|
|
|
|
|
|
|
|
|
|
|
|
|
|
|
||
50 |
|
|
|
|
|
|
|
|
|
|
|
|
|
|
|
|
|
|
|
|
|
|
|
|
50 |
|
|
|
|
|
|
|
|
|
|
|
|
|
|
|
|
|
|
|
|
|
|
|
|
|
|
|
|
|
|
|
|
|
|
|
|
|
|
|
|
|
|
|
|
|
|
|
|
|
|
|
|
|
|
|
|
|
|
|
|
|
|
|
|
|
|
|
|
|
|
|
|
|
|
||
25 |
|
|
|
|
|
|
|
|
|
|
|
|
|
|
|
|
|
|
|
|
|
|
|
|
25 |
|
|
|
|
|
|
|
|
|
|
|
|
|
|
|
|
|
|
|
|
|
|
|
|
|
|
|
|
|
|
|
|
|
|
|
|
|
|
|
|
|
|
|
|
|
|
|
|
|
|
|
|
|
|
|
|
|
|
|
|
|
|
|
|
|
|
|
|
|
|
|
|
|
|
||
0 |
|
|
|
|
|
|
|
|
|
|
|
|
|
|
|
|
|
|
|
|
|
|
|
|
0 |
|
|
|
|
|
|
|
|
|
|
|
|
|
|
|
|
|
|
|
|
|
|
|
|
|
|
|
|
|
|
|
|
|
|
|
|
|
|
|
|
|
|
|
|
|
|
|
|
|
|
|
|
|
|
|
|
|
|
|
|
|
|
|
|
|
|
|
|
|
|||||||
|
|
|
|
|
|
|
|
|
|
|
|
|
|
|
|
|
|
|
|
|
|
|
|
|
|
|
|
|
|
|
|
|
|
|
|
|
|
|
|
|
|
|
|
|
|
|
|
|
||
2010 |
|
2012 |
2014 |
2016 |
|
2018 |
2010 |
|
2012 |
2014 |
2016 |
|
2018 |
|||||||||||||||||||||||||||||||||||||
M&A: West Coast Ex-Bay Area |
VC-Backed Tech M&A: Mid-Regions |
||||||||||||||||||||||||||||||||||||||||||
100 |
|
$1B+ |
|
|
$100M–1B |
|
$1–100M |
|
|
|
|
100 |
|
$1B+ |
|
$100M–1B |
|
$1–100M |
|
|
|
|
|
||||||||||||||||||||
|
|
|
|
|
|
|
|
|
|
|
|
|
|
|
|||||||||||||||||||||||||||||
|
|
|
|
|
|
|
|
|
|
|
|
|
|
|
|
|
|
|
|
|
|
|
|
|
|
|
|
|
|
|
|
|
|
|
|
|
|
|
|
|
|
||
|
|
|
|
|
|
|
|
|
|
|
|
|
|
|
|
|
|
|
|
|
|
|
|
|
|
|
|
|
|
|
|
|
|
|
|
|
|
|
|
|
|
||
75 |
|
|
|
|
|
|
|
|
|
|
|
|
|
|
|
|
|
|
|
75 |
|
|
|
|
|
|
|
|
|
|
|
|
|
|
|
|
|
|
|
|
|
|
|
|
|
|
|
|
|
|
|
|
|
|
|
|
|
|
|
|
|
|
|
|
|
|
|
|
|
|
|
|
|
|
|
|
|
|
|
|
|
|
|
|
|
||
50 |
|
|
|
|
|
|
|
|
|
|
|
|
|
|
|
|
|
|
|
50 |
|
|
|
|
|
|
|
|
|
|
|
|
|
|
|
|
|
|
|
|
|
|
|
|
|
|
|
|
|
|
|
|
|
|
|
|
|
|
|
|
|
|
|
|
|
|
|
|
|
|
|
|
|
|
|
|
|
|
|
|
|
|
|
||||
25 |
|
|
|
|
|
|
|
|
|
|
|
|
|
|
|
|
|
|
|
25 |
|
|
|
|
|
|
|
|
|
|
|
|
|
|
|
|
|
|
|
|
|
|
|
|
|
|
|
|
|
|
|
|
|
|
|
|
|
|
|
|
|
|
|
|
|
|
|
|
|
|
|
|
|
|
|
|
|
|
|
|
|
|
|
||||
0 |
|
|
|
|
|
|
|
|
|
|
|
|
|
|
|
|
|
|
|
0 |
|
|
|
|
|
|
|
|
|
|
|
|
|
|
|
|
|
|
|
|
|
|
|
|
|
|
|
|
|
|
|
|
|
|
|
|
|
|
|
|
|
|
|
|
|
|
|
|
|
|
|
|
|
|
|
|
|
|
|
|
|
|
|
|
|
||
2010 |
|
2012 |
2014 |
2016 |
2018 |
2010 |
|
|
2012 |
2014 |
2016 |
2018 |
|||||||||||||||||||||||||||||||
M&A Value by Region (Median)
$250M |
|
|
|
|
|
Bay Area |
|
|
|
|
|
|
|
|
East Coast |
|
|
|
 West Coast Ex-Bay Area
$200M  Mid-Regions
$150M
$100M
$50M
$0M
2010 |
2012 |
2014 |
2016 |
2018 |
Source: PitchBook and SVB analysis. |
State of the Markets: Second Quarter 2019 |
16 |