

SolarPower-Europe-Global-Market-Outlook-2019-2023_watermark
.pdfvk.com/id446425943
Global Market Outlook
For Solar Power / 2019 - 2023
Supported by:
vk.com/id446425943
Mobilising Investments
in Emerging Markets
Picture credits © Alliance for Rural Electrification
ACCESS TO FINANCE
GET.invest’s Finance Catalyst delivers advisory services for the preparation of decentralised renewable energy projects and connects your business to financing.
NETWORKING & INFORMATION EVENTS
Our information and networking sessions stimulate cooperation and new business development.
Caption to image. © SPE
MARKET INFORMATION
We provide investors, project and business developers with critical market intelligence for informed decisions.
FUNDING DATABASE
Navigate the complex landscape of funding sources and find out which instrument suits your renewables project or business.
www.get-invest.eu |
@GET_invest |
|
GET.invest |
|
|||
|
GET.invest is supported by
vk.com/id446425943
FOREWORD
Welcome to SolarPower Europe’s Global Market Outlook 2019 – 2023.
The year 2018 was unique to us – we won the title ‘Overall Best European Association’ at the European Association Awards 2019 at a time when the European solar market has entered another growth phase. We expect this growth to continue beyond 2020 as the European Union has provided a legislative energy package that lives up to its name, ‘Clean Energy for All Europeans’. It is now about the implementation of these directives into member states’ laws – and we are looking forward to supporting our national members in their efforts to push the solar business case in their home markets – creating future high-tech jobs as we are fighting climate change.
This Global Market Outlook 2019 – 2023 is a manifesto of our successful work that has only been possible through close cooperation with our members: companies active across all parts of the solar value chain from around the world, and national solar and storage associations from many European countries. We are again very thankful to the Global Solar Council (GSC) and its members for providing deep insights into their home countries for our GWmarkets chapter, which now includes overviews on the 11 leading solar markets, a number that is quickly rising. Contributions of solar associations from all continents have made this Global Market Outlook evermore a truly global collaborative effort.
2018 was also a unique year for the entire global solar industry, as we were able to exceed the magic installation mark of 100 GW per year for the first time. This led the solar power generation fleet to grow to over 500 GW or 0.5 TW. We were seeing again strong cost improvements; new applications unfolding, such as floating solar; corporate renewable Power Purchase Agreements reaching a double-digit GW-level; and a market for merchant solar starting to emerge in several markets (for more trends, please check our Solar Trends Chapter).
However, unlike in the previous two years, with 30-50% annual growth rates, solar demand rose in the single-digit range in 2018, as the world ‘s largest market China suddenly decided to restructure its incentives scheme to make solar fit for the next growth phase. The good news is that despite China’s solar restructuring, global solar demand continued to grow last year, as new and emerging solar markets, as well as Europe, have been embracing solar’s attractive business proposition – a truly clean, highly versatile and very low-cost power generation source. This market diversification means interest in solar is quickly rising around the globe, which will minimise risks to the sector if demand in any of the bigger solar markets stumbles for some reason.
Solar’s short slowdown is luckily already behind us. Until 2021, we expect two-digit growth rates that will more than double the total installed solar power capacity within four years – from 0.5 TW at the end of 2018, to over 1.1 TW by the end of 2022. This sounds impressive, but when taking into consideration that global CO2 emissions rose to a new high last year – and knowing that solar and other renewables are key to solve that overarching issue, growth needs to speed up dramatically. In any case, the solar industry is ready for much more!
Enjoy reading our Global Market Outlook.
Thanks to our Sponsor Members:
|
|
|
|
|
|
|
|
|
|
|
|
|
|
|
|
|
|
|
|
|
|
|
|
|
|
WALBURGA |
MICHAEL SCHMELA |
|
|
|
|
|
||||||
|
|
|
|
|
||||||||
HEMETSBERGER |
EXECUTIVE ADVISOR |
|
|
|
|
|
||||||
CEO |
|
|
|
|
|
|
|
|
|
|
|
|
|
|
|
|
|
|
|
|
|
|
|
|
|
|
|
|
|
|
|
|
|
|
|
|
|
|
|
|
|
|
|
|
|
|
|
|
|
|
|
|
|
|
|
|
|
|
|
|
|
|
|
|
SolarPower Europe / GLOBAL MARKET OUTLOOK FOR SOLAR POWER 2019-2023 / 3

vk.com/id446425943
TABLE OF CONTENTS
FOREWORD |
|
3 |
EXECUTIVE SUMMARY |
|
5 |
1 GLOBAL SOLAR MARKET |
7 |
|
UPDATE 2000 – 2018 |
7 |
|
PROSPECTS 2019 |
– 2023 |
17 |
PROSPECTS 2019 |
– 2023 / SEGMENTS |
24 |
TRENDS WHAT’S COOL IN SOLAR |
27 |
|
1 Digital Solar & Storage I – What solar prosumers really need |
28 |
|
2Digital Solar & Storage II – Unleashing large-scale solar
|
& storage through grid intelligent solar |
30 |
3 |
BIPV – The next generation is ready for the mass market |
33 |
4 |
Solar Mobility – Electrification of the transport |
|
|
sector will rely heavily on solar |
35 |
5 |
Taking care – Sustainability in solar |
37 |
6Asset Management 2.0: More transparency,
more digitalisation |
38 |
7Corporate Sourcing of renewables – Why corporates
|
increasingly strive to go 100% RE |
40 |
8 |
Tenders – Towards intelligent tenders |
42 |
9 |
Emerging Markets – Joint efforts to mitigate risks |
|
|
and scaling solar |
44 |
10 |
Solar + hydrogen – The perfect match for a |
|
|
Paris-compatible hydrogen strategy? |
47 |
11 |
Technology update: What’s hot in solar |
49 |
2 |
GW-SCALE SOLAR POWER MARKETS IN 2018 |
53 |
|
3 |
THE EUROPEAN SOLAR MARKET |
79 |
|
|
UPDATE 2000 |
- 2018 |
79 |
|
UPDATE 2000 |
– 2018 / SEGMENTS |
82 |
|
PROSPECTS 2019 – 2023 |
84 |
|
4 |
GLOBAL MARKET OUTLOOK FOR SOLAR POWER |
88 |
|
Project manager & lead author: Michael Schmela, SolarPower Europe.
Market intelligence: Raffaele Rossi, Michael Schmela, SolarPower Europe.
Internal co-authors: Aurélie Beauvais, Naomi Chevillard, Mariano Guillén Paredes, Máté Heisz, Raffaele Rossi, Michael Schmela, SolarPower Europe.
External co-authors: China Photovoltaic Industry Association (CPIA); Dan Whitten, US Solar Energy Industries Association (SEIA); Subrahmanyam Pulipaka & Pranav R. Mehta, National Solar Energy Federation of India (NSEFI); Takeaki Masukawa & Hishashi Suzuki, Japan Photovoltaic Energy Association (JPEA); Steve Blume, Smart Energy Council; Virdiana Vázquez Guerrero, Mexican Solar Energy Association (ASOLMEX); Chang Sik Son & Eun-Chel Cho, Korea Photovoltaic Society (KPVS); Esen Erkan, Günder Turkish Solar Energy Society (GÜNDER); Jaap Baarsma, Holland Solar; Rodrigo Lopes Sauaia & Stephanie Betz, Brazilian Photovoltaic Solar Energy Association (ABSOLAR).
External contributors: ACESOL, AEA, ALER, APESF, APREN, BPVA, BSW-Solar, CADER, EDAMA, EDORA, Elettricità Futura, EMPOWER Kosovo, ENERPLAN, European Energy, GIZ, Green Energy Association of Israel, HELAPCO, Institut Luxembourgeois de Régulation, IRENA, ISEA, Lithuanian Solar Energy Association, MANAP, MEEREA, MESIA, Photovoltaic Austria, PV POLAND, Solar Trade Association, Solární Asociace, Solenergiklyngen, SPAQ, Svensk Solenergi, Swissolar, TPVIA, UNEF.
Design: Onehemisphere, Sweden.
Supported by: Intersolar Europe, Global Solar Council (GSC).
Disclaimer: Please note that all historical figures provided in this brochure are valid at the time of publication and will be revised when new and proven figures are available. All forecast figures are based on SolarPower Europe knowledge at the time of publication. Please also note that forecast figures have been rounded.
SolarPower Europe’s five-year forecast consists of Low, Medium and High Scenarios. The Medium scenario anticipates the most likely development given the current state of play of the market. The Low Scenario forecast is based on the assumption that policymakers halt solar support and other issues arise, including interest rate hikes and severe financial crisis situations. Conversely, the High Scenario forecasts the best optimal case in which policy support, financial conditions and other factors are enhanced.
Segmentation is based on the following system size: Residential (<10 kW); Commercial (<250 kW); Industrial (<1000 kW); Utility-scale (>1000 kW, ground-mounted). SolarPower Europe’s methodology includes only grid-connected systems. Installed capacity is always expressed in DC.
4 / SolarPower Europe / GLOBAL MARKET OUTLOOK FOR SOLAR POWER 2019-2023

vk.com/id446425943
EXECUTIVE SUMMARY
2018 will be remembered as the year solar broke the 100 GW threshold of annual installations, and it will be recalled as the year solar in total reached a cumulative operational capacity of over 500 GW or 0.5 TW.
2018 will also likely go down in history as the year solar took a short ‘break’ for the next growth phase. A total of 102.4 GW went on the grid around the world last year. That’s still 4% more than the 98.5 GW installed in 2017 but compares to two years with very high growth rates – around 30% in 2017 and 50% in 2016.
Despite its rather low, one-digit year- on-year growth, solar was again the power generation technology with the largest capacity additions globally in 2018. More solar was deployed than for any other single technology. In fact, solar additions were more than twice as high as net additions for coal and also for wind. Like the year before, solar alone installed more capacity than all fossil fuels and nuclear together in 2018, although the lead was paper-thin, less than 1%. While solar’s capacity additions seem impressive in relation to its fossil fuel peers, the truth is that solar still has a very long way to go to tap its vast potential – its share in the global power output for 2018 was a very small 2%.
On the plus side, solar’s power generation cost (LCOE) decreased by around 14% year-on-year in 2018, according to Lazard Capital, now enabling power prices in the 2 US cents per kWh range in many sunny places around the world.
Low generation cost alone is not enough to facilitate growth; it also needs the right policy frameworks and energy market designs. The administration in China, the world’s largest solar market for years now, has pulled the break for its generous feed-in tariff incentive scheme in mid-2018 to make itself fit for the grid parity age, looking into tools to better steer growth and have generation closer to where demand is. At 44.4 GW, China’s market shrunk by 16% compared to its record 52.8 GW in 2017. While other leading solar markets also stagnated (US) or shrank (India, Japan) for various reasons, many new and emerging markets more than compensated for the weakness of the tier 1 group. In 2018, 11 countries installed more than 1 GW of solar; that’s two more compared to the nine GW-scale solar markets in 2017. Our Medium Scenario estimates that the number will significantly increase to 16 countries in 2019.
Europe is one of the new solar growth regions. Driven by the European Union’s binding national 2020 targets, the continent added 11.3 GW in 2018, a 21% rise over the 9.3 GW installed the year before. This year, our Medium Scenario sees demand surge by over 80% to 20.4 GW, and for 2020, we see 18% growth to 24.1 GW, which would be a new installation record, beating the 22.5 GW Europe added in 2011.
While several emerging markets showed impressive growth in 2018, Australia was probably the solar shooting star of the last year. The country and continent accelerated its stellar growth pace in 2018, adding 5.3 GW, up nearly 300% from 1.3 GW in 2017 – and this high demand is supposed to continue.
In our Medium Scenario we anticipate around 128 GW newly installed PV capacity in 2019, which would translate into a 25% market growth over the 2018 additions. Next to many other markets, we are more upbeat on solar in the world’s largest solar market China in 2019 than in last year’s GMO, anticipating a newly installed capacity of 43 GW. That’s because the Chinese administration seems to be getting their restructuring act together faster than anticipated. Also, for the following four years we are upbeat on global solar. Our Medium Scenario anticipates demand to rise by 12% to 144 GW in 2020, 10% to 158 GW in 2021, 7% to 169 GW in 2022, and 6% to 180 GW in 2023.
Like in previous years, the scenarios of the Global Market Outlook 2019 show higher growth than in last year’s edition of the GMO. In 2019, we estimate a cumulative installed capacity of 645 GW for the Medium Scenario 2019, which is about 4% higher than in last year’s GMO. Our new 5-year global market outlook anticipates for our most likely Medium Scenario, that global solar power generationplantcapacitieswillreach1,297GWin2023.Underoptimalconditions, we estimate that the world could get as high as 1,610 GW by the end of 2023 and enter the terawatt production capacity level already in 2021. However, the year that will be more likely remembered for entering the solar terawatt age is 2022, which would translate into around 4% of global electricity production.
The report and all figures can be downloaded at:
www.solarpowereurope.org
SolarPower Europe / GLOBAL MARKET OUTLOOK FOR SOLAR POWER 2019-2023/ 5
vk.com/id446425943
vk.com/id446425943
1
GLOBAL SOLAR MARKET
UPDATE 2000 - 2018
© First Solar
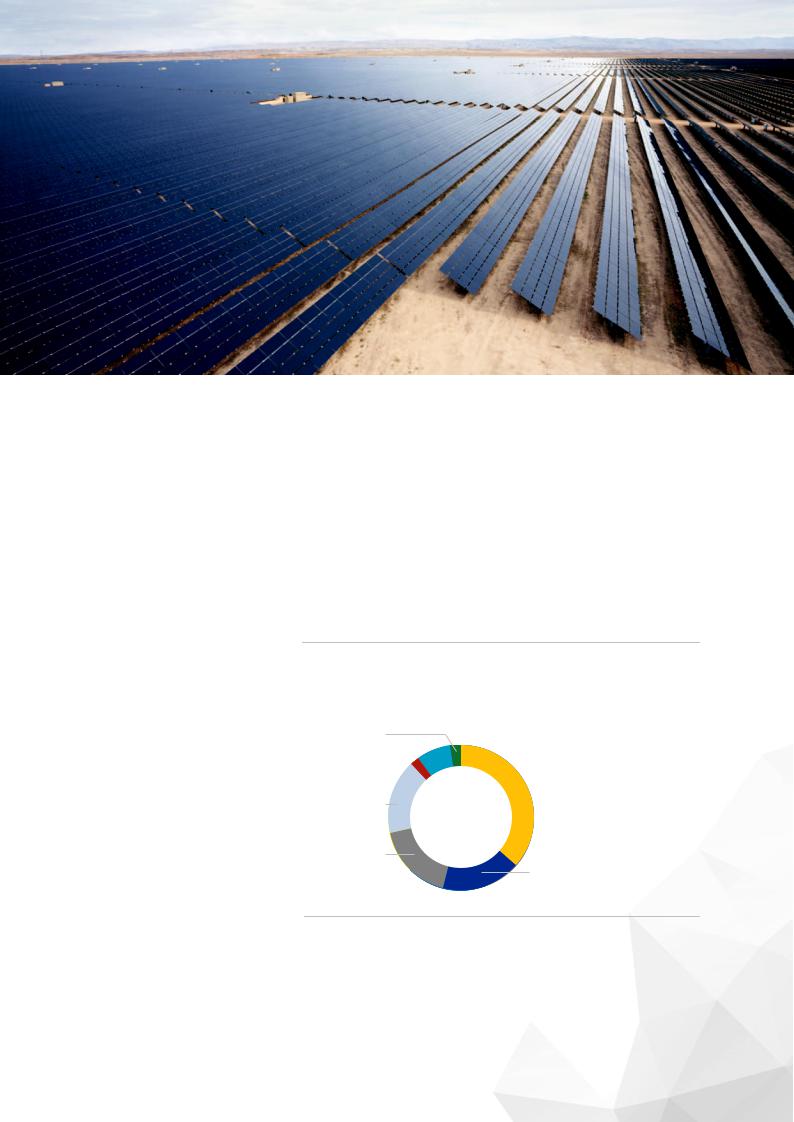
In 2018, solar took a little break from the enormous growth rates seen in previous years. Although the solar market grew modestly by only 4%, it was enough to again outdo any other power generation technology last year. More solar PV was deployed than all fossil fuels and nuclear together. Solar also added more capacity than all renewables combined—including large hydro—and had twice as much installed than wind power (see Fig. 1).
Relatively, solar’s share reached 36% of all newly added power capacities in 2018, compared to 38% the year before. While impressive at first sight, the ‘stagnation’ in both solar and wind growth in 2018 meant that renewable capacities only contributed 63% to total power additions (see Fig. 2). When looking at the share of total installed power generation capacities, renewables contributed 33% in 2018, and 26% in terms of power output. All solar PV power plants together produced only 2.2% of the world’s electricity output. This shows that despite solar’s recent dominating role in annual power generation additions, there’s huge untapped potential for both solar and its renewable peers.
FIGURE 1 NET POWER GENERATING CAPACITY ADDED IN 2018
BY MAIN TECHNOLOGY
|
|
2018 |
|
|
||
Other Res; 7 GW |
|
|
|
|
|
|
Large Hydro; 21 |
GW |
|
|
|
|
Solar; 102 GW |
|
|
|
|
|||
Nuclear; 5 |
GW |
|
|
|
|
|
|
|
|
|
|
||
Gas; 46 GW
Coal; 50 GW
Wind; 49 GW
Source: Global Energy Monitor (2019); IRENA (2019); SolarPower Europe (2019). |
© SOLARPOWER EUROPE 2019 |
SolarPower Europe / GLOBAL MARKET OUTLOOK FOR SOLAR POWER 2019-2023 / 7
vk.com/id446425943
1 GLOBAL SOLAR MARKET
UPDATE 2000 - 2018 / CONTINUED
FIGURE 2 RENEWABLE POWER GENERATION AND CAPACITY AS A SHARE OF GLOBAL POWER 2008-2018
%
70
|
|
|
|
|
|
|
|
|
|
|
62% |
63% |
|
|
|
|
|
|
|
|
|
|
60% |
|
|
||
60 |
|
|
|
|
|
|
|
|
|
|
|
||
|
|
|
|
|
53% |
54% |
|
|
57% |
|
|
||
|
|
|
|
|
|
|
|
|
|||||
|
|
|
|
|
|
|
|
|
|
||||
|
|
|
|
|
|
|
|
|
|
|
|||
50 |
|
|
|
|
|
|
|
49% |
|
|
|
|
|
|
|
|
|
|
|
|
|
|
|
|
|||
|
|
|
|
|
|
|
|
|
|
|
|
||
40 |
|
39% |
39% |
|
44% |
|
|
|
|
|
|
|
|
|
38% |
|
|
|
|
|
|
|
|
||||
|
|
|
|
|
|
|
|
|
|
|
|
||
30 |
|
|
|
|
|
|
|
|
|
31% |
32% |
33% |
|
|
|
|
|
|
|
|
28% |
30% |
|
||||
|
|
|
|
|
|
|
|
|
|
||||
|
|
|
|
|
|
|
27% |
|
|
|
|||
|
|
|
|
|
|
26% |
|
|
|
26% |
|||
|
|
|
|
|
25% |
|
|
|
25% |
||||
|
|
|
|
24% |
|
|
|
|
|||||
|
|
23% |
24% |
|
|
|
23% |
24% |
|||||
20 |
|
|
|
22% |
|
||||||||
|
|
21% |
22% |
|
|
||||||||
18% |
19% |
19% |
20% |
|
|
|
|
||||||
|
|
|
|
|
|
|
|
||||||
10 |
|
|
0.1% |
0.2% |
0.3% |
0.4% |
0.6% |
0.8% |
1.0% |
1.3% |
1.8% |
2.2% |
|
|
0.1% |
||||||||||||
|
|||||||||||||
0 |
|
|
|||||||||||
2008 |
2009 |
2010 |
2011 |
2012 |
2013 |
2014 |
2015 |
2016 |
2017 |
2018 |
|||
|
|||||||||||||
Renewable capacity change as a % of global capacity change (net)
Renewable power as a % of global capacity
Renewable power as a % of global power generation
Solar power as a % of global power generation
Source: IRENA (2019). |
© SOLARPOWER EUROPE 2019 |
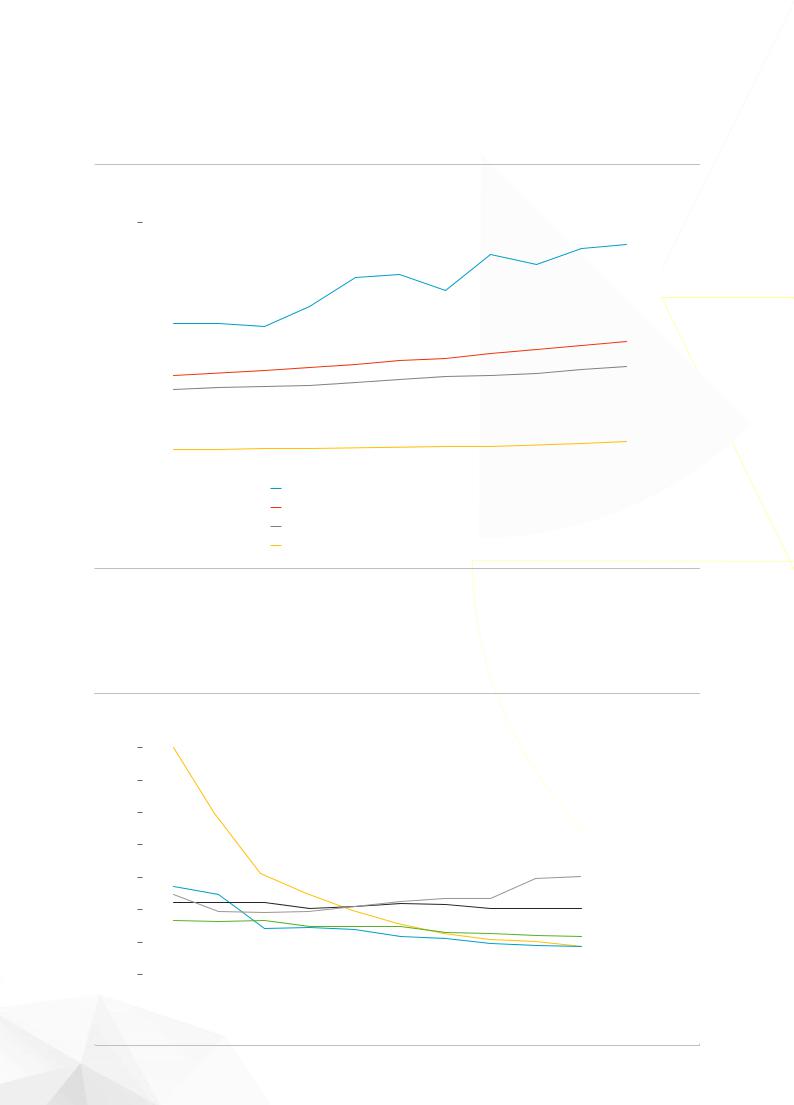
The reason for a preference for solar over other technologies has been, among other reasons, its steep cost reduction curve – which is continuing to decrease (see Fig. 3). Today, generation costs for solar power are significantly lower than for new nuclear and coal plants,
but usually also below gas, and in the range of wind, depending on the region, even lower. In 2018, tenders and PPAs showed several instances of bids, awards and contracts with solar power prices in the 2 US cents/kWh range. Such price levels were reached in various
FIGURE 3 SOLAR ELECTRICITY GENERATION COST IN COMPARISON WITH OTHER POWER SOURCES 2009-2018
USD/MWh
350
300
250
200
150
100
50
0
2009 |
2010 |
2011 |
2012 |
2013 |
2014 |
2015 |
2016 |
2017 |
2018 |
|
|
Solar |
|
Wind |
|
CCGT |
|
Coal |
|
Nuclear |
|
|
|
|
|
|
|||||
Source: Lazard (2018). All prices In 2019 USD. |
|
|
|
|
|
|
|
© SOLARPOWER EUROPE 2019 |
||
8 / SolarPower Europe / GLOBAL MARKET OUTLOOK FOR SOLAR POWER 2019-2023
vk.com/id446425943
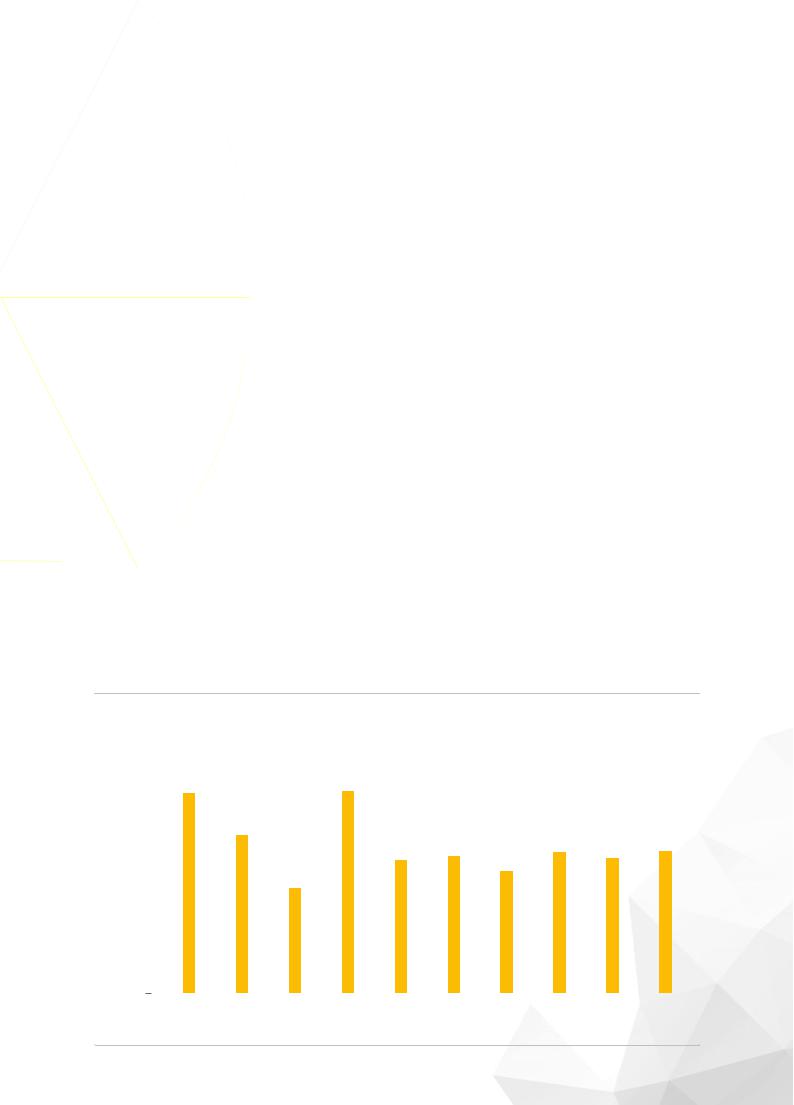
geographies around the world (see Fig. 4). The lowest solar power price bid in 2018 was recorded at 1.38 INR (1.86 US cents) per kWh in India; although this was an escalating tariff with a special business model for government rooftop buildings.
In general, prices for solar power are much higher in developing countries than in economies with stable policy conditions and high credit ratings. But with support from international lenders, such as development financing institutions, project risks can be considerably reduced in developing countries. In Egypt, for example, in 2018, a 200 MW solar tender from the Egyptian Electricity Transmission Company received the best offers from international developers in the 2 US cent range – at 2.8 US cents per kWh. This solar project is backed by the European Bank for Reconstruction and Development (EBRD). The Scaling Solar Programme of the World Bank Group, which is probably the largest solar scheme of this kind, is supporting solar deployment in African countries, Ethiopia, Madagascar, Senegal and Zambia, and in its latest tenders, has led to awards in the low 4 US cent/kWh range. In April 2019, Zambia’s GET FIT programme between the country’s energy ministry and the German Development Bank (KfW) awarded 120 MW of solar capacity at a price of 3.99 US cents/kWh: a new record for Sub-Saharan Africa.
While low-cost financing is key for developers to opt for solar, another important part of the cost equation are
technology improvements, which continue to (see overview Technology Trends, p.49)
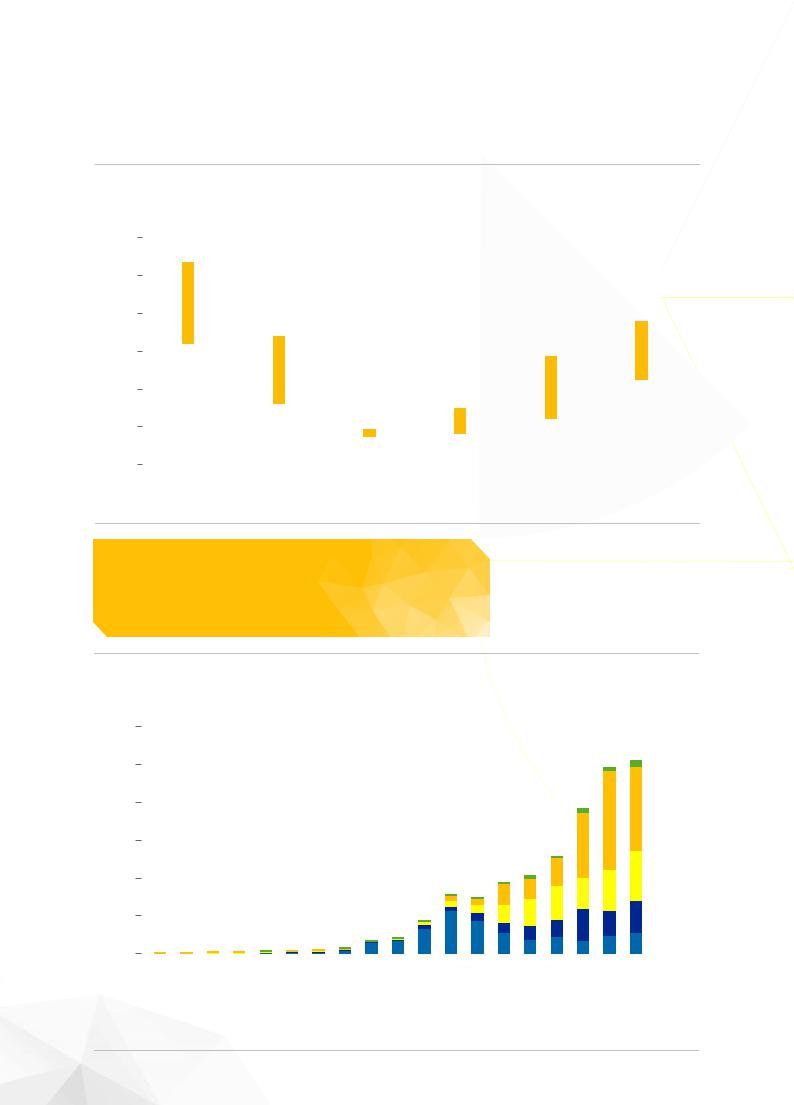
The latest Levelized Cost of Energy (LCOE) Analysis – Version 12.0, released in November 2018 by US investment bank Lazard, shows utility-scale solar’s cost improving over the previous version by 14%. Utilityscale solar is again cheaper than new conventional power generation sources nuclear and coal, as well as combined cycle gas turbines (CCGT) (see Fig. 5).
A total of 102.4 GW solar was installed in 2018 (see Fig. 6), exceeding the 100 GW level in one year for the first time. While that’s only a 4% year-on-year growth over the 98.5 GW installed in 2017, it is once again higher than many solar analysts had anticipated. After the world’s largest solar market, China, had stopped its utility-scale solar subsidy programme in May 2018, many analysts dramatically reduced their forecasts, with Goldman Sachs being the most conservative, anticipating solar demand to drop by 24% to 75 GW in 2018. We did not change our GMO 2018 Medium Scenario over the course of last year, keeping our market growth estimate at 4% to 102.6 GW. The actual 102.4 GW installation figure deviates only 200 MW or less than 1% from our original estimate, and it’s the first time in years that we have not underestimated the growth of the solar sector; in the past, actual installed capacities usually turned out be closer to the upper end of our GMO High Scenario estimate.
FIGURE 4 SELECTION OF LOWEST SOLAR AUCTION BIDS AROUND THE WORLD IN 2018
US cents/kWh
4 |
|
|
3.55 |
|
|
|
|
|
|
|
|
||
3.52 |
|
|
|
|||
3 |
|
|
2.79 |
2.40 |
2.49 |
2.50 |
|
|
|||||
|
|
|
|
|||
|
|
|
2.34 |
2.38 |
||
|
|
|
2.16 |
|||
|
|
|
|
|
|
|
2 |
|
|
1.86 |
|
|
|
|
|
|
|
|
||
1 |
|
|
|
|
|
|
|
|
|
|
|
|
|
0
Brazil1 |
Egypt |
India |
India |
Saudi Arabia |
UAE |
Arizona, |
Arizona, |
Nevada, |
Texas, |
|
|
|
|
|
|
US*2 |
US* |
US* |
US* |
*: PPA with Production Tax Credit, 1: Average winning bid, 2: With 2.5% annual escalation. |
© SOLARPOWER EUROPE 2019 |
SolarPower Europe / GLOBAL MARKET OUTLOOK FOR SOLAR POWER 2019-2023 / 9
vk.com/id446425943
1 GLOBAL SOLAR MARKET
UPDATE 2000 - 2018 / CONTINUED
FIGURE 5 SOLAR ELECTRICITY GENERATION COST IN COMPARISON WITH CONVENTIONAL POWER SOURCES 2018
LCOE (USD/MWh)
300
250
200
150
100
50
0
Residential PV |
C&I PV |
Utility-scale PV |
CCGT |
Coal |
Nuclear |
Source: Lazard (2018). |
© SOLARPOWER EUROPE 2019 |
More than
100 GW
installed in 2018
FIGURE 6 EVOLUTION OF GLOBAL ANNUAL SOLAR PV INSTALLED CAPACITY 2000-2018
GW
120
102.4
100
80
60
40
20
0
2000 |
2001 |
2002 |
2003 |
2004 |
2005 |
2006 |
2007 |
2008 |
2009 |
2010 |
2011 |
2012 |
2013 |
2014 |
2015 |
2016 |
2017 |
2018 |
|||||||
|
|
|
EUROPE |
|
|
|
AMERICA |
|
|
APAC |
|
|
|
|
CHINA |
|
|
|
MEA |
|
|
||||
|
|
|
|
|
|
|
|
|
|
|
|
|
|
|
|
|
|||||||||
© SOLARPOWER EUROPE 2019
10 / SolarPower Europe / GLOBAL MARKET OUTLOOK FOR SOLAR POWER 2019-2023