


vk.com/id446425943
DECEMBER 10, 2018 THE RUSSIAN EAGLE – 2019 STRATEGY: STANDING AGAINST THE HEADWINDS
Consumer: Headwinds to Abate in 2019
KEY DEVELOPMENTS
This year has been a perfect storm for domestics in general and food retailers in particular. First, nominal income growth has been weak (our economics team’s latest estimate is 5% for the full year) while nominal GDP will have grown 11% (in ruble terms). Higher spending on non food items, coupled with historically low food inflation of 1.4%, will lead to growth of just 3.2% in nominal retail food sales, we estimate, while consumer sentiment is approaching historical lows (which we attribute to the planned VAT increase, pension reform and rise in gasoline prices). Second, record space expansion in 2017 has resulted in ticket dilution, since attracting customers to new stores requires promotions, and price sensitive customers have increased the number of stores they visit each shopping trip. All this has pressured gross margins. Last but not least, retailers specializing in certain categories are expanding rapidly. Five niche players (covered in our report “Disrupted by Specialists”) posted R490 bln in revenues in 2017 (up 40% y o y) and we expect at least 28% growth to R630 bln this year. If they were a single company, it would be the third largest player by revenues, the largest by store count and the fastest growing. Without these specialists, we estimate the three public retailers would have generated R120 bln (or 4%) higher revenues in 2017 with a 1.2 pp stronger EBITDA margin and 1 pp higher LFL sales growth. On a positive note, trading down has not intensified.
STRATEGIC VIEW
Next year should be less challenging, as some of the headwinds should ease. We assume food inflation will accelerate to 3.4% (from 1.4% in 2018), which we think will be passed on to consumers. As a result, we expect food retail revenue growth to accelerate to 4.5%, versus nominal income growth of 5.0%. Conventional competition and cannibalization should ease thanks to slower space growth. Over 2014 17, 3 mln m2 of modern selling space was added per annum in Russia, which should fall to 2 mln m2 in 2018 and then decline further through 2020. This would mean the selling space CAGR slowing to 4% in 2018E 20E from 10% in 2014 17. We think 2H19 will be the point at which industry revenue growth starts outpacing space growth, which represents a tailwind for LFL sales. Whether specialists can continue ratcheting up pressure is unknown: their store rollout rates are still high but the public players have already adjusted prices to match the level of specialists. We think future disruption should be less significant than it has been over the past two years. Thus, we are cautiously positive on the health of the sector moving forward, though we foresee a couple quarters of volatile results. Meanwhile, the market wants to see a recovery in LFL sales amid stable margins. We suggest buying on dips or improvements in operating results in 2Q19.
TOP PICKS
█X5 Retail Group. The company remains our top pick. Although top line growth is likely to decelerate in 2H18, X5 remains the fastest growing public food retailer. Revenue growth should be in the 13 15% range in 2019. Maturing stores will support margins, although the growing share of stores outside of the Moscow and St Petersburg metropolitan areas will have the opposite effect. The stock is trading at record low multiples and retains a discount to Magnit on EV/EBITDA.
█Detsky Mir. The company is showing tight opex control and strong top line growth, driven by LFL sales growth as well as new store openings. We think it will be able to maintain a unique combination of superior revenue growth, high ROIC, strong cash generation and consistently solid dividends.
Mikhail_Krasnoperov@sberbank-cib.ru, Andrey_Krylov@sberbank-cib.ru
26 |
SBERBANK CIB INVESTMENT RESEARCH |
This document is being provided for the exclusive use of iremizov1@bloomberg.net |
This document is being provided for the exclusive use of iremizov1@bloomberg.net |
vk.com/id446425943
THE RUSSIAN EAGLE – 2019 STRATEGY: STANDING AGAINST THE HEADWINDS DECEMBER 10, 2018
CONSUMER |
|
|
|
|
|
|
|
|
|
|
|
|
|
|
|
|
|
|
|
|
|
|
|
|
|
|
|
|
|
|
|
|
|
|
|
|
|
|
|
|
|
|
|
|
|
|
|
|
|
|
|
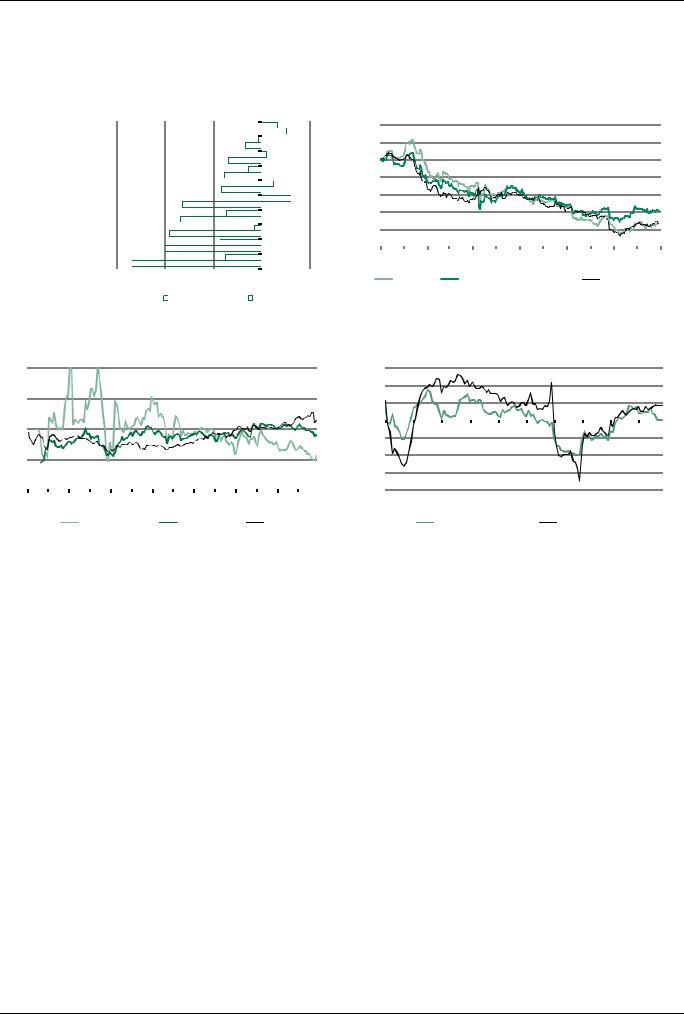
Performance |
|
|
|
|
|
|
|
|
|
|
|
|
|
|
|
|
|
|
|
|
Sector performance vs GEM peers and RTS |
|
|
||
Rusagro |
|
|
|
|
|
|
|
|
|
|
|
|
|
|
|
|
7% |
120 |
|
|
|
|
|||
|
|
|
|
|
|
|
|
|
|
|
|
|
|
|
|
|
|
|
|||||||
|
|
|
|
|
|
|
|
1% |
|
|
|
|
|
|
11% |
110 |
|
|
|
|
|||||
DM |
|
|
|
|
|
|
|
|
|
|
|
|
|
|
|
|
|
|
|
|
|||||
|
|
|
|
|
|
|
|
|
|
|
|
|
|
|
|
|
|
|
|||||||
|
|
|
|
|
|
|
|
7% |
|
|
|
|
|
2% |
|
|
|
|
|
|
|||||
M.Video |
|
|
|
|
|
|
14% |
|
|
|
|
|
|
|
|
|
100 |
|
|
|
|
||||
|
|
|
|
|
|
|
|
|
|
|
|
|
|
|
|
|
|||||||||
|
|
|
|
|
|
|
|
|
|
|
|
|
|
|
|
|
|
|
|
|
|||||
EM |
|
|
|
|
|
|
15% |
|
5% |
|
|
|
|
|
5% |
|
90 |
|
|
|
|
||||
|
|
|
|
|
|
|
|
|
|
|
|
|
|
|
|
|
|||||||||
|
|
|
|
|
|
|
|
|
|
|
|
|
|
|
|
|
|
|
|||||||
Detsky Mir |
|
|
|
|
|
|
|
|
|
|
|
|
|
|
|
|
|
|
|
||||||
|
|
|
|
|
|
16% |
|
|
|
|
|
|
|
|
12% |
80 |
|
|
|
|
|||||
|
|
|
|
|
|
|
|
|
|
|
|
|
|
|
|
|
|
|
|
|
|||||
X5 Retail Group |
|
32% |
|
|
|
|
|
|
|
|
|
|
|
|
|
|
|
|
|
|
|||||
|
|
|
|
|
|
|
|
|
|
|
|
|
|
|
|
70 |
|
|
|
|
|||||
O'Key |
|
33% |
|
|
14% |
|
|
|
|
|
|
|
|
|
|
|
|
|
|
|
|
||||
|
|
|
|
|
|
|
|
|
|
|
|
|
|
|
|
|
|||||||||
|
|
|
|
|
|
|
|
|
|
|
|
|
|
|
|
60 |
|
|
|
|
|||||
Russia |
|
38% |
|
|
|
|
|
|
3% |
|
|
|
|
|
|
|
|
|
|
|
|
||||
|
|
|
|
|
|
|
|
|
|
|
|
|
|
|
|
|
|
||||||||
|
|
|
|
|
|
|
|
|
|
|
|
|
|
|
|
|
|
|
|
||||||
Lenta |
|
40% |
|
|
|
|
17% |
|
|
|
|
|
|
|
|
|
|
|
|
50 |
|
|
|
|
|
|
|
|
|
|
|
|
|
|
|
|
|
|
|
|
|
|
|
|
|
|
|||||
|
|
|
|
|
|
|
|
|
|
|
|
|
|
|
|
|
|
|
|
|
|
||||
Magnit |
53% |
|
|
|
|
|
15% |
|
|
|
|
|
|
|
|
|
|
|
|
|
Dec ’17 Feb ’18 |
Apr ’18 Jun ’18 Aug ’18 |
Oct ’18 Dec ’18 |
||
|
|
|
|
|
|
|
|
|
|
|
|
|
|
|
|
||||||||||
|
|
|
|
|
|
|
|
|
|
|
|
|
|
|
|
|
|
|
|
|
|
|
|
||
|
60% |
40% |
|
|
20% |
0% |
20% |
|
|
Russia |
Relative to EM consumer |
Relative to RTS |
|||||||||||||
|
|
|
|
3m |
|
|
|
|
|
YTD |
|
|
|
|
|
Source: Sberbank CIB Investment Research |
|
|
|||||||
|
|
|
|
|
|
|
|
|
|
|
|
|
|
|
|||||||||||
|
|
|
|
|
|
|
|
|
|
|
|
|
|
|
|
|
|
|
|
|
|
|
|
|
|
Source: Bloomberg, Sberbank CIB Investment Research
Forward P/E |
|
|
|
|
|
|
|
|
Retail sales growth, y o y |
|
|
|
|
|
||||||||
40 |
|
|
|
|
|
|
|
|
|
|
15% |
|
|
|
|
|
|
|
|
|
|
|
|
|
|
|
|
|
|
|
|
|
|
10% |
|
|
|
|
|
|
|
|
|
|
|
30 |
|
|
|
|
|
|
|
|
|
|
5% |
|
|
|
|
|
|
|
|
|
|
|
|
|
|
|
|
|
|
|
|
|
|
|
|
|
|
|
|
|
|
|
|
|
|
20 |
|
|
|
|
|
|
|
|
|
|
0% |
|
|
|
|
|
|
|
|
|
|
|
|
|
|
|
|
|
|
|
|
|
|
|
|
|
|
|
|
|
|
|
|||
|
|
|
|
|
|
|
|
|
|
5% |
|
|
|
|
|
|
|
|
|
|
|
|
|
|
|
|
|
|
|
|
|
|
|
|
|
|
|
|
|
|
|
|
|
|
|
10 |
|
|
|
|
|
|
|
|
|
|
10% |
|
|
|
|
|
|
|
|
|
|
|
|
|
|
|
|
|
|
|
|
|
|
|
|
|
|
|
|
|
|
|
|
|
|
|
|
|
|
|
|
|
|
|
|
|
15% |
|
|
|
|
|
|
|
|
|
|
|
0 |
|
|
|
|
|
|
|
|
|
|
20% |
|
|
|
|
|
|
|
|
|
|
|
|
|
|
|
|
|
|
|
|
|
|
|
|
|
|
|
|
|
|
|
|||
2005 |
2007 |
2009 |
2011 |
2013 |
2015 |
2017 |
|
|
2009 2010 2011 2012 2013 2014 2015 2016 2017 2018 |
|
||||||||||||
|
|
|
Russia |
|
EM |
|
DM |
|
|
|
|
|
|
Food retail |
|
|
|
Non food retail |
||||
Source: Bloomberg, Sberbank CIB Investment Research |
|
|
|
|
|
Source: Bloomberg, Sberbank CIB Investment Research |
|
|
|
|||||||||||||
|
|
|
|
|
|
|
|
|
|
|
|
|
|
|
|
|
|
|
|
|||
Valuation ratios |
|
|
|
|
|
|
|
|
|
|
|
|
|
|
|
|
|
|
|
|||
|
|
|
|
Price Target price |
MCap |
ADT |
|
|
P/E |
|
EPS growth |
|
EV/EBITDA |
|
P/BV |
Div yield |
Net debt/EBITDA |
|||||
|
|
|
|
|
|
|
|
|
||||||||||||||
|
|
|
|
$ |
$ |
$ mln |
$ mln |
Rec |
2018E |
2019E |
|
2018E |
2019E |
|
2018E |
2019E |
|
2018E |
2018E |
2018E |
||
Magnit |
|
|
12.77 |
17.00 |
6,038 |
23.2 |
HOLD |
12.0 |
12.1 |
|
11% |
1% |
|
5.3 |
5.3 |
|
1.5 |
5.1% |
111% |
|||
X5 Retail Group |
|
25.50 |
31.00 |
6,925 |
7.9 |
BUY |
14.3 |
12.0 |
|
11% |
19% |
|
6.1 |
5.3 |
|
2.7 |
4.7% |
177% |
||||
M.Video |
|
|
6.23 |
7.00 |
1,120 |
1.9 |
HOLD |
10.0 |
9.0 |
|
0% |
11% |
|
4.6 |
4.0 |
|
2.3 |
0.0% |
94% |
|||
Lenta |
|
|
3.51 |
5.50 |
1,708 |
1.1 |
BUY |
7.9 |
7.6 |
|
6% |
4% |
|
5.6 |
5.0 |
|
1.3 |
0.0% |
254% |
|||
Rusagro |
|
|
10.94 |
11.00 |
1,495 |
1.0 |
HOLD |
10.6 |
10.7 |
|
36% |
1% |
|
7.2 |
7.0 |
|
1.0 |
3.9% |
189% |
|||
Detsky Mir |
|
|
1.39 |
1.86 |
1,029 |
0.3 |
BUY |
10.8 |
9.2 |
|
0% |
18% |
|
6.5 |
5.4 |
|
90.5 |
6.7% |
82% |
|||
O'Key |
|
|
1.67 |
1.50 |
449 |
0.2 |
SELL |
30.2 |
22.3 |
|
73% |
36% |
|
5.9 |
5.8 |
|
1.2 |
6.7% |
269% |
|||
Russian retail |
|
– |
– |
17,903 |
34.6 |
– |
11.8 |
10.9 |
|
8% |
11% |
|
5.6 |
5.1 |
|
2.0 |
4.1% |
151% |
||||
EM retail |
|
|
– |
– |
– |
– |
– |
20.5 |
17.5 |
|
3% |
17% |
|
10.2 |
9.1 |
|
2.4 |
2.2% |
107% |
|||
Source: Bloomberg, Sberbank CIB Investment Research
SBERBANK CIB INVESTMENT RESEARCH |
27 |
This document is being provided for the exclusive use of iremizov1@bloomberg.net |
This document is being provided for the exclusive use of iremizov1@bloomberg.net |

vk.com/id446425943
DECEMBER 10, 2018 THE RUSSIAN EAGLE – 2019 STRATEGY: STANDING AGAINST THE HEADWINDS
Utilities: Modernization Further
Postponed
KEY DEVELOPMENTS
The discussion between industrial consumers and utilities companies regarding future tariffs and pricing continues. The industry has been opposing changes in grid tariffs that could result in payments being introduced for reserved grid capacity. It has also been trying to limit the increase in capacity payments and therefore lobbying for less lucrative parameters in modernization contracts. Meanwhile, recent changes at the Energy Ministry (Vyacheslav Kravchenko, the deputy energy minister, resigned and Alexei Teksler became responsible for the oversight of the utilities sector) have added to the uncertainty over when regulatory changes, including those relating to modernization, will be finalized. InterRAO UES expects the legislation to be finalized by the end of this year, though even in that case the first modernization tender would still not take place until late January or early February 2019, and the regular KOM auction could be postponed to May or June 2019. We believe that these delays are souring investor sentiment toward gencos. Our base case is that no changes will be made to the initial draft legislation, which would mean a 14% rate of return at an 8.5% government bond yield at least for the first tender, which will cover 2022 24.
STRATEGIC VIEW
We do not expect the approval of modernization regulation to have a material impact on genco stocks. First, we think it is next to impossible to predict the results of the first tender. Media have speculated that the rate of return could be revised going forward, so we believe there is a chance that some companies may try to include the maximum number of projects in the first tender, leading to increased competition. Second, the impact of modernization on EBITDA is unlikely to appear until 2023; before that, contracts will probably only have a negative impact on FCF owing to the capex involved. Therefore, though we see modernization as the next material trigger for power generation companies, we do not expect the market to fully price in the potential effects this year.
TOP PICKS
█InterRAO UES. We still prefer InterRAO to other names in the sector. Its combination of strong financial indicators (a R146.4 bln net cash position at end 3Q18, an FCF yield of 13% in 2017 that is set to increase as the company moves beyond its mandatory CSA capex spending and FCF that should more than cover modernization capex) and a cheap valuation (a current EV/EBITDA of 1.4, or 3.7 if the net cash position and treasuries are not accounted for) makes it an attractive investment opportunity. The main issue, in our opinion, is that the market will need to see the company start using the cash it has accumulated (either via major M&A deals or dividend distributions) before it begins to price in these factors. So far, there have not been any signs that it will take such steps in the near future.
Fedor_Kornachev@sberbank-cib.ru, Alexey_Ryabushko@sberbank-cib.ru
28 |
SBERBANK CIB INVESTMENT RESEARCH |
This document is being provided for the exclusive use of iremizov1@bloomberg.net |
This document is being provided for the exclusive use of iremizov1@bloomberg.net |

vk.com/id446425943
THE RUSSIAN EAGLE – 2019 STRATEGY: STANDING AGAINST THE HEADWINDS DECEMBER 10, 2018
UTILITIES |
|
|
|
|
|
|
|
|
|
|
|
|
|
|
|
|
|
|
|
|
|
|
|
|
|
|
|
|
|
|
|
|
|
|
|
|
|
|
|
|
|
|
|
|
|
|
|
|
|
|
|
|
|
|
|
|
|
|
|
|
|
|
|
|
|
|
|
|
|
|
|
|
|
|
|
||||||
Performance |
|
|
|
|
|
|
|
|
|
|
|
|
|
|
|
|
|
|
|
|
|
|
|
|
|
Sector performance versus peers and RTS |
|
|
||||||||||||
MSCI World Utilities |
|
|
|
|
|
|
|
|
|
|
|
|
|
|
|
|
|
|
1% |
|
|
|
110 |
|
|
|
|
|
|
|
|
|
|
|
|
|||||
|
|
|
|
|
|
|
|
|
|
|
|
|
|
|
|
|
|
|
|
|
|
|
|
|
|
|
|
|
|
|
|
|||||||||
|
|
|
|
|
|
|
|
|
|
|
|
|
|
|
|
|
|
|
|
|
|
|
|
|
|
|
|
|
|
|||||||||||
|
|
|
|
|
|
|
|
|
|
|
|
|
|
|
|
|
|
1% |
7% |
|
|
|
|
|
|
|
|
|
|
|
|
|
|
|||||||
|
|
Unipro |
|
|
|
|
|
|
|
|
7% |
|
|
|
|
|
|
|
|
|
|
|
100 |
|
|
|
|
|
|
|
|
|
|
|
|
|||||
|
|
|
|
|
|
|
|
|
|
|
|
|
|
|
|
|
|
|
|
|
|
|
|
|
|
|
|
|
|
|
|
|
||||||||
|
|
|
|
|
|
|
|
|
|
|
|
|
|
|
|
|
2% |
|
|
|
|
|
|
|
|
|
|
|
|
|
|
|
||||||||
|
MSCI EM Utilities |
|
|
|
|
|
|
|
|
7% |
|
|
|
|
|
|
|
|
|
|
|
|
|
|
|
|
|
|
|
|
|
|
||||||||
|
|
|
|
|
|
|
|
|
|
|
|
|
|
|
|
|
|
|
|
|
|
|
|
|
|
|
|
|
|
|
|
|||||||||
|
|
|
|
|
|
|
|
|
|
|
|
|
|
|
|
|
3% |
|
|
90 |
|
|
|
|
|
|
|
|
|
|
|
|
||||||||
Federal Grid Company |
|
|
|
|
18% |
|
|
|
|
|
|
|
|
|
|
|
|
|
|
|
|
|
|
|
|
|
|
|
|
|
||||||||||
|
|
|
|
|
|
|
|
|
|
|
|
|
|
|
|
|
|
|
|
|
|
|
|
|
||||||||||||||||
|
|
|
|
|
|
|
|
|
|
|
|
|
|
|
|
|
|
|
|
|
|
|
|
|
|
|
|
|
|
|
|
|||||||||
|
|
RosSeti |
|
|
|
|
24% |
|
|
|
|
|
|
|
|
|
|
|
|
|
|
|
|
|
|
80 |
|
|
|
|
|
|
|
|
|
|
|
|
||
|
|
|
|
|
|
|
|
|
|
|
|
|
|
|
|
|
|
|
|
|
|
|
|
|
|
|
|
|
|
|
|
|
|
|
|
|||||
|
|
|
|
|
|
|
|
|
|
|
|
|
|
|
|
|
|
|
|
|
|
|
|
|
|
|
|
|
|
|
|
|
|
|
|
|||||
|
Utilities Russia |
|
|
|
|
28% |
|
|
|
|
|
1% |
|
|
|
|
|
|
|
5% |
|
|
|
|
|
|
|
|
|
|
|
|
|
|
||||||
|
|
|
|
|
|
|
|
|
|
|
|
|
|
|
|
|
|
|
|
|
|
|
|
|
|
|
|
|
|
|||||||||||
|
|
|
|
|
|
|
|
|
|
|
|
|
|
|
|
|
|
|
|
|
|
|
|
|
|
|
|
|
|
|
|
|
|
|
||||||
|
|
OGK 2 |
33% |
|
|
|
|
|
|
|
|
|
|
|
|
|
|
|
|
|
|
|
70 |
|
|
|
|
|
|
|
|
|
|
|
|
|||||
|
|
|
|
|
|
|
|
|
|
|
|
|
|
|
|
|
|
|
|
|
|
|
|
|
|
|
|
|
||||||||||||
|
|
|
|
|
|
|
|
|
|
|
|
|
|
|
0% |
|
|
|
|
|
|
|
|
|
|
|
|
|
|
|
||||||||||
|
|
Enel Russia |
|
|
|
|
|
|
|
|
|
|
|
|
|
|
|
|
|
|
|
|
|
|
|
|
|
|
|
|
||||||||||
|
|
35% |
|
|
|
|
|
|
|
|
|
|
|
|
|
|
|
|
|
|
|
|
|
|
|
|
|
|
|
|
|
|
||||||||
|
|
|
|
|
|
|
|
|
|
|
|
|
|
|
|
|
|
|
|
|
|
|
|
|
|
|
|
|
|
|
|
|
|
|
|
|
||||
|
|
MOESK |
36% |
|
|
|
|
|
|
|
|
1% |
|
|
|
|
|
|
|
|
|
|
|
60 |
|
|
|
|
|
|
|
|
|
|
|
|
||||
|
|
|
|
|
|
|
|
|
|
|
|
|
|
|
|
|
|
|
|
|
|
|
|
|
|
|
|
|
|
|
|
|
||||||||
|
|
|
|
|
|
|
|
|
|
|
|
|
|
|
|
|
|
|
|
|
|
|
|
|
|
|
|
|
|
|
|
|
|
|
|
|||||
|
|
RusHydro |
41% |
|
|
16% |
|
|
|
|
|
|
|
|
|
|
|
|
|
|
|
Dec ’17 Feb ’18 |
|
Apr ’18 |
Jun ’18 |
Aug ’18 Oct ’18 Dec ’18 |
||||||||||||||
|
|
|
|
|
|
|
|
|
|
|
|
|
|
|
|
|
|
|
||||||||||||||||||||||
|
|
|
|
|
|
|
|
|
|
|
|
|
|
|
|
|
|
|
|
|
|
|
|
|
|
|
|
|
|
|
|
|
|
|
|
|
|
|||
|
|
Mosenergo |
43% |
|
|
|
|
|
|
|
7% |
|
|
|
|
|
|
|
|
|
|
|
|
|
|
|
|
Russian utilities |
|
Relative to EM Utilities |
Relative to RTS |
|||||||||
|
|
|
|
|
|
|
|
|
|
|
|
|
|
|
|
|
|
|
|
|
|
|
|
|
||||||||||||||||
|
|
|
|
|
|
|
|
|
|
|
|
|
|
|
|
|
|
|
|
|
|
|
|
|
|
|
|
|
|
|||||||||||
|
|
|
|
|
|
|
|
|
|
|
|
|
|
|
|
|
|
|
|
|
|
|
|
|
|
|
|
|
|
|
||||||||||
|
|
|
50% 40% |
|
30% 20% 10% |
0% |
|
|
10% |
|
Source: Bloomberg, Sberbank CIB Investment Research |
|
|
|
||||||||||||||||||||||||||
|
|
|
|
|
|
|
3m |
|
|
|
YTD |
|
|
|
|
|
|
|
|
|
|
|
|
|
|
|
|
|
|
|
|
|
|
|
|
|||||
|
|
|
|
|
|
|
|
|
|
|
|
|
|
|
|
|
|
|
|
|
|
|
|
|
|
|
|
|
|
|
|
|
|
|||||||
|
|
|
|
|
|
|
|
|
|
|
|
|
|
|
|
|
|
|
|
|
|
|
|
|
|
|
|
|
|
|
|
|||||||||
Source: Bloomberg, Sberbank CIB Investment Research |
|
|
|
|
|
|
|
|
|
|
|
|
|
|
|
|
|
|
|
|
|
|
|
|
|
|
|
|
|
|
||||||||||
|
|
|
|
|
|
|
|
|
|
|
|
|
|
|
|
|
|
|
|
|
|
|
|
|
|
|
|
|
|
|
|
|
|
|
|
|
|
|
|
|
Forward P/E |
|
|
|
|
|
|
|
|
|
|
|
|
|
|
|
|
|
|
|
|
|
|
|
|
|
|
|
|
|
|
|
|
|
|
|
|
|
|
||
30 |
|
|
|
|
|
|
|
|
|
|
|
|
|
|
|
|
|
|
|
|
|
|
|
|
|
|
|
|
|
|
|
|
|
|
|
|
|
|
|
|
25 |
|
|
|
|
|
|
|
|
|
|
|
|
|
|
|
|
|
|
|
|
|
|
|
|
|
|
|
|
|
|
|
|
|
|
|
|
|
|
|
|
20 |
|
|
|
|
|
|
|
|
|
|
|
|
|
|
|
|
|
|
|
|
|
|
|
|
|
|
|
|
|
|
|
|
|
|
|
|
|
|
|
|
15 |
|
|
|
|
|
|
|
|
|
|
|
|
|
|
|
|
|
|
|
|
|
|
|
|
|
|
|
|
|
|
|
|
|
|
|
|
|
|
|
|
10 |
|
|
|
|
|
|
|
|
|
|
|
|
|
|
|
|
|
|
|
|
|
|
|
|
|
|
|
|
|
|
|
|
|
|
|
|
|
|
|
|
5 |
|
|
|
|
|
|
|
|
|
|
|
|
|
|
|
|
|
|
|
|
|
|
|
|
|
|
|
|
|
|
|
|
|
|
|
|
|
|
|
|
0 |
|
|
|
|
|
|
|
|
|
|
|
|
|
|
|
|
|
|
|
|
|
|
|
|
|
|
|
|
|
|
|
|
|
|
|
|
|
|
|
|
|
|
|
|
|
|
|
|
|
|
|
|
|
|
|
|
|
|
|
|
|
|
|
|
|
|
|
|
|
|
|
|
|
|
|
|
|
|
|
|
|
2008 |
2010 |
2012 |
|
|
2014 |
|
2016 |
|
|
|
2018 |
|
|
|
|
|
|
|
|
|
|
|
|
|
|
|
|
|||||||||||||
|
|
Russia |
|
EM |
|
|
|
|
|
DM |
|
|
|
|
|
|
|
|
|
|
|
|
|
|
|
|
||||||||||||||
|
|
|
|
|
|
|
|
|
|
|
|
|
|
|
|
|
|
|
|
|
|
|
|
|
|
|
|
|
|
|
||||||||||
Source: Bloomberg, Sberbank CIB Investment Research |
|
|
|
|
|
|
|
|
|
|
|
|
|
|
|
|
|
|
|
|
|
|
|
|
|
|
|
|
|
|
||||||||||
|
|
|
|
|
|
|
|
|
|
|
|
|
|
|
|
|
|
|
|
|
|
|
|
|
|
|
|
|
|
|
|
|
|
|
|
|
|
|
||
Valuation ratios |
|
|
|
|
|
|
|
|
|
|
|
|
|
|
|
|
|
|
|
|
|
|
|
|
|
|
|
|
|
|
|
|
|
|
|
|
|
|
||
|
|
|
Price Target price |
MCap |
ADT |
|
|
|
|
|
|
|
|
|
|
P/E |
|
EPS growth |
|
EV/EBITDA |
|
P/BV |
Div yield |
Net debt/EBITDA |
||||||||||||||||
|
|
|
|
|
|
|
|
|
|
|
|
|
|
|
|
|||||||||||||||||||||||||
|
|
|
$ |
|
|
$ |
$ mln |
$ mln |
|
|
|
Rec |
|
2018E |
2019E |
|
2018E |
2019E |
|
2018E |
2019E |
2018E |
2018E |
2018E |
||||||||||||||||
InterRAO UES |
0.0610 |
|
|
0.0838 |
6,367 |
4.8 |
|
|
|
BUY |
|
6.3 |
6.0 |
|
27% |
4% |
|
2.1 |
1.6 |
|
0.8 |
4.0% |
|
neg |
||||||||||||||||
RusHydro |
|
0.0075 |
|
|
0.0124 |
2,903 |
10.4 |
|
|
|
HOLD |
|
4.3 |
4.2 |
|
66% |
4% |
|
3.1 |
2.9 |
|
0.3 |
11.6% |
145% |
||||||||||||||||
Federal Grid Company |
0.0023 |
|
|
0.0025 |
2,946 |
2.1 |
|
|
|
HOLD |
|
2.5 |
2.8 |
|
28% |
12% |
|
2.8 |
2.9 |
|
0.2 |
10.2% |
142% |
|||||||||||||||||
RosSeti |
|
0.0109 |
|
|
0.0085 |
2,173 |
1.6 |
|
|
|
SELL |
|
1.4 |
1.4 |
|
16% |
4% |
|
3.3 |
3.5 |
|
0.1 |
0.7% |
179% |
||||||||||||||||
Unipro |
|
0.0410 |
|
|
0.0494 |
2,587 |
0.5 |
|
|
|
HOLD |
|
9.7 |
9.4 |
|
53% |
2% |
|
6.2 |
6.2 |
|
1.5 |
8.1% |
0% |
||||||||||||||||
Mosenergo |
|
0.0261 |
|
|
|
|
– |
1,036 |
0.4 |
|
|
|
UR |
|
3.1 |
5.6 |
|
32% |
44% |
|
1.3 |
1.6 |
|
0.2 |
4.8% |
38% |
||||||||||||||
OGK 2 |
|
0.0052 |
|
|
|
|
– |
575 |
0.3 |
|
|
|
UR |
|
4.3 |
2.7 |
|
4% |
59% |
|
3.3 |
2.3 |
|
0.3 |
8.8% |
179% |
||||||||||||||
Enel Russia |
|
0.0164 |
|
|
0.0206 |
579 |
0.3 |
|
|
|
BUY |
|
5.5 |
5.4 |
|
29% |
2% |
|
3.8 |
4.2 |
|
0.9 |
11.8% |
136% |
||||||||||||||||
Russia |
|
|
– |
|
|
– |
13,290 |
15.7 |
|
|
|
– |
|
2.9 |
3.1 |
|
17% |
3% |
|
3.0 |
3.3 |
|
0.2 |
7.8% |
136% |
|||||||||||||||
EM |
|
|
– |
|
|
– |
|
|
– |
|
|
– |
|
|
|
– |
|
12.0 |
10.2 |
|
2% |
18% |
|
7.5 |
6.9 |
|
1.0 |
4.4% |
377% |
|||||||||||
DM |
|
|
– |
|
|
– |
|
|
– |
|
|
– |
|
|
|
– |
|
15.9 |
14.4 |
|
2% |
10% |
|
9.0 |
8.5 |
|
1.6 |
4.0% |
402% |
|||||||||||
Source: Bloomberg, Sberbank CIB Investment Research
SBERBANK CIB INVESTMENT RESEARCH |
29 |
This document is being provided for the exclusive use of iremizov1@bloomberg.net |
This document is being provided for the exclusive use of iremizov1@bloomberg.net |