


vk.com/id446425943
DECEMBER 10, 2018 THE RUSSIAN EAGLE – 2019 STRATEGY: STANDING AGAINST THE HEADWINDS
Financials: Looking to Avoid Repeat of 2018 Dichotomy
KEY DEVELOPMENTS
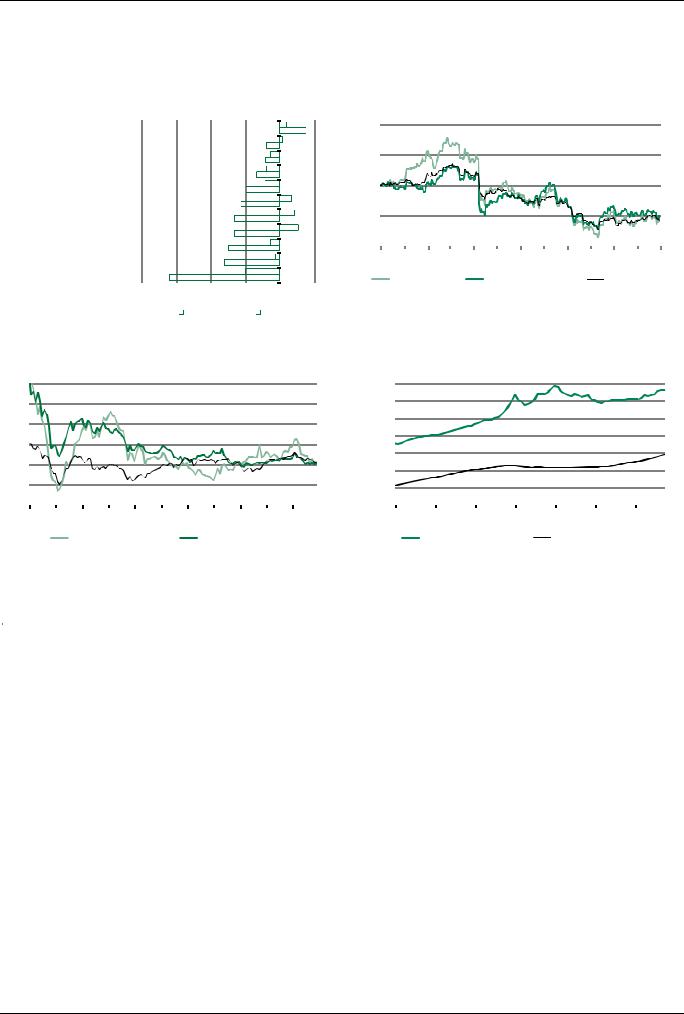
This year was a good one for the fundamentals of Russian banks, with record earnings for many names, but a bad one for their stocks, which have largely had a dismal year. Russia’s two largest banks (Sberbank and VTB) underperformed the Russian market by 25% and more despite increasing earnings to record levels. The cases of Bank of St Petersburg and TCS were similar. Meanwhile, Moscow Exchange both underperformed the Russian market, by about 30%, and showed lacking fundamental performance, with annual earnings heading for a third consecutive decline.
This is all despite the fact that the landscape for banks has been much calmer in 2018 than 2017, when the CBR took over three large failing banks. What has of course hurt banks’ share price performance, however, are sanctions – both action and talk. Indeed, prior to new US sanctions in early April, Sberbank’s share price was up 13% and nicely outperforming the market.
STRATEGIC VIEW
How sanctions play out is inevitably likely to dominate stock performance in the early months of 2019. But the fundamental outlook again looks supportive, marked by stability (we expect) in terms of economic growth, interest rates (with a flat key rate inked in for 1H19 and maybe 50 bps worth of cuts in 2H) and the ruble. We anticipate credit growth of around 10% in 2019. Retail will continue to drive overall loan growth, albeit at a slower pace than in 2018 (about 14% versus 22%), pressured by a combination of rising consumer leverage, higher interest rates, weak real disposable income growth and tighter regulation. Corporate lending, as well as retail and corporate deposits, should see growth in the mid to high single digits, in our view. Meanwhile, asset quality should remain broadly benign, margins should be more or less stable as asset repricing takes some of the heat out of higher deposit rates, and the ongoing shift to digital banking and payments should help maintain decent fee income growth for the more technologically savvy names.
As for risks, we see rising consumer leverage as one, though it is in better shape than in 2014 15, with a slower pace of growth, the CBR on the front foot and more secured lending. Another is ruble weakness, which has pressured capital ratios and sparked some debate about postponing the final steps to Basel 3, but we do not see any risk of imminent state backed recapitalizations. We expect a mixed picture for dividends from state banks, with VTB looking more constrained than its larger peer.
The final piece of the jigsaw is valuations: they bode well for a good year for Russian banks in 2019 if they can get through the sanctions risks relatively unscathed. Russia’s bellwether Sberbank trades on a consensus 2019 P/E of 4.8 with a 2018 dividend yield of 8.5%.
TOP PICKS
█TCS. Tinkoff amply illustrates the share price fundamentals dichotomy, with almost 40% EPS growth expected and 60% ROE in 2018 but a share price that has been dragged down with other Russian banks. It remains a top pick for us in 2019, even as some risks are set to increase. We think another year of 20% or higher EPS growth looks likely, while the overall build out of the ecosystem (8 mln customers) and non credit card businesses are progressing well. As for those risks, higher consumer leverage means core credit card lending will slow, but we think the increasing diversification of its business better insulates Tinkoff against cycle risks, which are also being mitigated by CBR policy.
Andrew_Keeley@sberbank-cib.ru Kirill_Rogachev@sberbank-cib.ru
22 |
SBERBANK CIB INVESTMENT RESEARCH |
This document is being provided for the exclusive use of iremizov1@bloomberg.net |
This document is being provided for the exclusive use of iremizov1@bloomberg.net |
vk.com/id446425943
THE RUSSIAN EAGLE – 2019 STRATEGY: STANDING AGAINST THE HEADWINDS DECEMBER 10, 2018
FINANCIALS |
|
|
|
|
|
|
|
|
|
|
|
|
|
|
|
|
|
|
|
|
|
|
|
|
|
|
|
|
|
|
|
|
|
|
|
|
|
|
|
|
|
|
|
|
|
|
|
|
|
|
|
|
|
|
|
|
|
Performance |
|
|
|
|
|
|
|
|
|
|
|
|
|
|
|
|
|
|
|
|
|
|
|
Sector performance versus peers and RTS |
|
|
||
Halyk Bank |
|
|
|
|
|
|
|
|
|
|
|
|
|
|
|
|
|
|
4% |
15% |
140 |
|
|
|
|
|||
|
|
|
|
|
|
|
|
|
|
|
|
|
|
|
|
|
|
|
|
|
||||||||
|
|
|
|
|
|
|
|
|
||||||||||||||||||||
|
|
|
|
|
|
|
|
|
|
|
|
|
|
|
|
|
|
|
|
|
|
|
|
|
|
|
||
MSCI EM Banks |
|
|
|
|
7% |
|
|
|
|
2% |
|
120 |
|
|
|
|
||||||||||||
|
|
|
|
|
|
|
|
|
|
|||||||||||||||||||
|
|
|
|
|
|
|
|
|
|
|
|
|
|
|
|
|
||||||||||||
TCS |
|
|
|
|
5% |
|
|
|
|
|
|
|
|
|
|
|
|
|
||||||||||
|
|
|
|
|
|
|
|
|
|
|
|
|
|
|||||||||||||||
|
|
|
|
8% |
|
|
|
|
|
|
|
|
|
|
|
|
|
|
|
|
||||||||
MSCI World Banks |
|
|
|
|
8% |
|
|
|
|
|
|
|
|
|
|
|
|
|
|
|
||||||||
|
|
|
|
|
|
|
|
|
|
|
|
|
|
|
|
|
|
|||||||||||
|
|
|
|
13% |
|
|
|
|
|
|
|
|
|
|
|
|
|
|
|
|
|
|||||||
TBC Bank |
|
|
|
|
8% |
|
|
|
|
|
|
|
|
|
|
100 |
|
|
|
|
||||||||
|
|
|
|
|
|
|
|
|
|
|
|
|
|
|
|
|||||||||||||
|
|
|
|
19% |
|
|
|
|
|
|
|
|
|
|
|
7% |
|
|
|
|
|
|
||||||
Bank of St Petersburg |
|
|
|
|
22% |
|
|
|
|
|
|
|
|
|
|
|
|
|
|
|
|
|
||||||
|
|
|
|
|
|
|
|
|
|
|
||||||||||||||||||
|
|
|
|
|
|
|
|
|
|
|
|
|
|
|
|
8% |
80 |
|
|
|
|
|||||||
Russia Financials |
|
|
|
|
26% |
|
|
|
|
|
|
|
|
|
|
|
|
|
|
|
|
|
||||||
|
|
|
|
|
|
|
|
|
||||||||||||||||||||
|
|
|
|
|
|
|
|
|
|
|
|
|
|
|
|
|
|
11% |
|
|
|
|
||||||
Sberbank |
|
|
|
|
26% |
|
|
|
|
|
|
|
|
|
|
|
|
|
|
|
|
|
|
|
|
|||
|
|
|
|
|
|
|
|
|
|
|
|
|
|
|
|
|
|
|
|
|
|
|
|
|||||
|
|
|
|
|
|
|
|
|
|
|
|
|
|
|
|
|
|
|
|
|
|
|
|
|
||||
Moscow Exchange |
|
|
|
|
5% |
|
|
|
|
|
|
|
|
60 |
|
|
|
|
||||||||||
|
|
|
|
|
|
|
|
|
|
|
|
|
|
|
|
|||||||||||||
|
|
|
|
30% |
|
|
|
|
|
|
|
|
|
|
|
|
|
|
|
|
|
|
|
|
|
|||
VTB |
|
|
|
|
2% |
|
|
|
|
|
|
|
|
Dec ’17 Feb ’18 |
Apr ’18 Jun ’18 Aug ’18 |
Oct ’18 Dec ’18 |
||||||||||||
|
|
|
|
|
|
|
|
|
|
|
||||||||||||||||||
|
|
|
|
32% |
|
|
|
|
|
|
|
|
|
|
|
|
|
|
|
|
|
|
|
|
|
|
|
|
Bank of Georgia |
64% |
|
|
|
20% |
|
|
|
|
|
|
|
|
|
|
|
|
|
|
|
|
Russian banks |
Relative to EM banks |
Relative to RTS |
||||
|
|
|
|
|
|
|
|
|
|
|
|
|
|
|
|
|
|
|||||||||||
|
|
|
|
|
|
|
|
|
|
|
|
|
|
|
|
|
|
|
|
|
|
|
||||||
|
80% 60% |
40% 20% 0% |
|
|
|
20% |
|
|
|
|
|
|
||||||||||||||||
|
|
|
|
|
Source: Bloomberg, Sberbank CIB Investment Research |
|
|
|||||||||||||||||||||
|
|
|
|
|
|
|
|
|
|
|
|
|
|
|
|
|
|
|
|
|
|
|
|
|
|
|||
|
|
|
|
3m |
|
|
|
|
|
|
|
|
YTD |
|
|
|
|
|
|
|
||||||||
|
|
|
|
|
|
|
|
|
|
|
|
|
|
|
|
|
|
|
||||||||||
|
|
|
|
|
|
|
|
|
|
|
|
|
|
|
|
|
|
|
|
|
|
|
|
|
||||
Source: Bloomberg, Sberbank CIB Investment Research |
|
|
|
|
|
|
|
|
|
|
|
|
|
|
|
|
|
|
|
|
|
|
|
|
||||
Trailing P/BV |
|
|
|
|
|
|
Russian banks loan portfolio, R bln |
|
|
|
|
|
||||||||||
3.0 |
|
|
|
|
|
|
|
|
35,000 |
|
|
|
|
|
|
|
|
|
|
|
|
|
2.5 |
|
|
|
|
|
|
|
|
30,000 |
|
|
|
|
|
|
|
|
|
|
|
|
|
|
|
|
|
|
|
|
|
|
|
|
|
|
|
|
|
|
|
|
|
|
|
|
2.0 |
|
|
|
|
|
|
|
|
25,000 |
|
|
|
|
|
|
|
|
|
|
|
|
|
|
|
|
|
|
|
|
|
|
|
|
|
|
|
|
|
|
|
|
|
|
|
|
1.5 |
|
|
|
|
|
|
|
|
20,000 |
|
|
|
|
|
|
|
|
|
|
|
|
|
|
|
|
|
|
|
|
|
15,000 |
|
|
|
|
|
|
|
|
|
|
|
|
||
|
|
|
|
|
|
|
|
|
|
|
|
|
|
|
|
|
|
|
|
|
||
1.0 |
|
|
|
|
|
|
|
|
10,000 |
|
|
|
|
|
|
|
|
|
|
|
|
|
|
|
|
|
|
|
|
|
|
|
|
|
|
|
|
|
|
|
|
|
|
||
0.5 |
|
|
|
|
|
|
|
|
5,000 |
|
|
|
|
|
|
|
|
|
|
|
|
|
|
|
|
|
|
|
|
|
|
|
|
|
|
|
|
|
|
|
|
|
|
||
0.0 |
|
|
|
|
|
|
|
|
0 |
|
|
|
|
|
|
|
|
|
|
|
|
|
|
|
|
|
|
|
|
|
|
|
|
|
|
|
|
|
|
|
|
|
|||
2008 |
2010 |
2012 |
2014 |
2016 |
2018 |
|
|
2012 |
2013 |
2014 |
2015 |
2016 |
2017 |
2018 |
|
|
||||||
|
|
Russia financials |
EM |
|
DM |
|
|
|
|
|
Corporate loans |
|
|
Loans to households |
|
|
||||||
Source: Bloomberg, Companies |
|
|
|
|
|
|
Source: CBR |
|
|
|
|
|
|
|
|
|
|
|
||||
|
|
|
|
|
|
|
|
|
|
|
|
|
|
|
|
|
|
|
|
|
||
Valuation ratios |
|
|
|
|
|
|
|
|
|
|
|
|
|
|
|
|
|
|
|
|
||
|
|
|
Price |
Target price |
MCap |
ADT |
|
|
|
P/E |
|
|
P/BV |
|
|
ROE |
|
|
EPS growth |
|||
|
|
|
|
|
|
|
|
|
|
|
|
|||||||||||
|
|
|
$ |
$ |
$ mln |
$ mln |
Rec |
|
2018E |
2019E |
|
2017 |
2018E |
|
2018E |
2019E |
|
2018E |
2019E |
|||
Sberbank |
|
2.89 |
– |
64,889 |
329 |
– |
|
5.1 |
4.7 |
|
1.0 |
1.1 |
|
22% |
21% |
|
6% |
9% |
||||
VTB |
|
1.25 |
1.60 |
8,074 |
16.4 |
HOLD |
|
4.0 |
4.3 |
|
0.6 |
0.7 |
|
16% |
14% |
|
44% |
8% |
||||
Moscow Exchange |
1.33 |
1.88 |
3,038 |
13.0 |
BUY |
|
9.7 |
9.1 |
|
1.4 |
1.7 |
|
18% |
18% |
|
11% |
7% |
|||||
TCS |
|
17.34 |
26.00 |
3,167 |
2.4 |
BUY |
|
8.3 |
7.2 |
|
4.3 |
4.7 |
|
57% |
49% |
|
16% |
15% |
||||
Bank of Georgia |
|
17.47 |
25.83 |
690 |
1.4 |
HOLD |
|
6.4 |
5.2 |
|
0.7 |
1.2 |
|
19% |
21% |
|
26% |
22% |
||||
TBC Bank |
|
19.08 |
24.55 |
955 |
0.5 |
HOLD |
|
6.2 |
5.8 |
|
1.4 |
1.2 |
|
20% |
19% |
|
16% |
6% |
||||
Halyk Bank |
|
11.40 |
17.50 |
3,134 |
0.3 |
BUY |
|
4.8 |
4.6 |
|
1.2 |
1.2 |
|
25% |
24% |
|
24% |
2% |
||||
Bank of St Petersburg |
0.73 |
1.33 |
323 |
0.2 |
BUY |
|
2.9 |
2.6 |
|
0.3 |
0.3 |
|
12% |
12% |
|
4% |
12% |
|||||
FSU |
|
– |
– |
84,484 |
363.1 |
– |
|
4.9 |
4.6 |
|
1.0 |
1.1 |
|
21% |
20% |
|
0% |
7% |
||||
EM |
|
– |
– |
– |
– |
– |
|
7.9 |
7.1 |
|
1.0 |
1.0 |
|
13% |
13% |
|
5% |
10% |
||||
DM |
|
– |
– |
– |
– |
– |
|
15.5 |
14.4 |
|
2.3 |
2.2 |
|
14% |
14% |
|
14% |
9% |
||||
Source: Bloomberg, Sberbank CIB Investment Research
SBERBANK CIB INVESTMENT RESEARCH |
23 |
This document is being provided for the exclusive use of iremizov1@bloomberg.net |
This document is being provided for the exclusive use of iremizov1@bloomberg.net |

vk.com/id446425943
DECEMBER 10, 2018 THE RUSSIAN EAGLE – 2019 STRATEGY: STANDING AGAINST THE HEADWINDS
TMT: Betting on the Digital Economy
KEY DEVELOPMENTS
This year has been mixed for the TMT and IT universe. Mobile carriers’ stocks have been among the worst performers, with MTS and VEON down 27% and 29% YTD in dollar terms. In addition to intensified market competition and increased cost pressure, MTS has seen one of its key risks materialize: it has booked a R55.8 bln provision related to the investigation into its Uzbek operations. Meanwhile, VEON has suffered from currency depreciation in its key markets. Rostelecom’s 4% decline has also been uninspiring. Internet names have been under pressure too. Yandex is off 10% YTD after media reports of possible changes in governance, while Mail.ru Group and QIWI have declined a respective 14% and 13%, as, despite strong top line growth, their margins have come under pressure due to investments in new verticals. The performance of IT names has been mixed: EPAM Systems has gained 21%, while Luxoft has lost 41%.
STRATEGIC VIEW
We think next year will be positive for internet stocks. Online advertising trends remain solid, as internet ads have finally overtaken TV ads and we expect them to remain the biggest segment of the Russian ad market. In addition, internet companies are expanding their service ecosystems and exploring different ways to crystallize the value of new verticals. Yandex is our preference in the space given the impressive prospects for its taxi segment, its core search business and e commerce. We are also positive on Mail.ru Group and QIWI, as their elevated investment in 2018 should start to pay off in 2019.
We remain cautious on the 2019 outlook for Russian telecoms. Competition looks set to intensify, with the mobile customer base likely to show little if any growth and weak prospects for ARPU, especially given that unlimited data tariffs have been reintroduced. Margins will also be pressured by the increased share of low margin handset sales, and we see upside risks for capex due to potential 5G investment and the costs of complying with the Yarovaya law. We expect both MTS and VEON to remain high dividend payers, with 2019 yields of 11.2% and 11.4%. We prefer VEON given the support to FCF from the sale of its stake in the Italian JV and the potential simplification of the corporate structure.
While we expect EPAM Systems’ financial performance to remain strong, we see the stock as fairly valued given the circa 40% premium to peers (a 25.8 2019E P/E). We like Luxoft at current levels (an 11.6 P/E for calendar year 2019) but note that visibility on the financial services vertical is likely to remain low.
TOP PICKS
█Yandex. We consider Yandex to be in its best ever fundamental shape given the improved visibility over the profitability of the taxi segment (which could make the plans for an IPO more viable) and the monetization of new verticals, including Zen, Yandex.Auto and Yandex.Station. We think the market should slowly but surely start to price in these factors.
█QIWI. We anticipate strong trends for the core payment segment as well as progress in terms of Tochka Bank breaking even. We believe the phase of accelerated investment is over and that a key catalyst to watch for in 2019 will be the potential resumption of dividend payments.
█Mail.ru Group. The outlook for ad and gaming revenues remains solid, and there are a number of positive catalysts that we expect in 2019, including the closing of the AliExpress Russia JV deal and the crystallization of the value of the O2O businesses.
Svetlana_Sukhanova@sberbank-cib.ru, Oksana_Mustiatsa@sberbank cib.ru
24 |
SBERBANK CIB INVESTMENT RESEARCH |
This document is being provided for the exclusive use of iremizov1@bloomberg.net |
This document is being provided for the exclusive use of iremizov1@bloomberg.net |

vk.com/id446425943
THE RUSSIAN EAGLE – 2019 STRATEGY: STANDING AGAINST THE HEADWINDS DECEMBER 10, 2018
TELECOMS AND MEDIA |
|
|
|
|
|
|
|
|
|
|
|
|
|
|
|
|
|
|
|
|
|
|
|
|
|
|
|
|
|
|
|
|
|
|
|
|
|
|
|
|
|
|
|
|
|
|
|
|
|
|
|
|
|
||
Performance |
|
|
|
|
|
|
|
|
|
|
|
|
|
|
|
|
|
|
|
|
|
|
Sector performance versus GEM peers and RTS |
||||
EPAM Systems |
10% |
|
|
|
|
|
|
|
|
|
|
21% |
110 |
|
|
|
|
||||||||||
|
|
|
|
|
|
|
|
|
|
|
|
|
|||||||||||||||
|
|
|
|
|
|
|
|
|
|
|
|
|
|
|
|
|
|
|
|
|
|
|
|
|
|
||
Rostelecom |
4% |
|
|
|
|
|
|
7% |
|
|
100 |
|
|
|
|
||||||||||||
|
|
|
|
|
|
|
|
|
|
|
|
||||||||||||||||
|
|
|
|
|
|
|
|
|
|
|
|
|
|
||||||||||||||
Media/IT Russia |
4% |
|
|
|
|
|
|
|
|
|
|
|
|
|
|
||||||||||||
|
|
|
|
|
|
|
|
|
|
|
|||||||||||||||||
6% |
|
|
|
|
1% |
|
|
|
|
|
|
|
|
||||||||||||||
MSCI World Telecoms |
7% |
|
|
|
|
|
|
|
|
|
|
|
|
||||||||||||||
|
|
|
|
|
|
|
|
|
|
|
|
||||||||||||||||
|
|
|
|
|
|
|
|
|
|
|
|
|
|
|
|
||||||||||||
Yandex |
5% |
|
|
|
|
|
|
|
|
|
|
90 |
|
|
|
|
|||||||||||
|
|
|
|
|
|
|
|
|
|
|
|
||||||||||||||||
10% |
|
|
|
|
|
|
|
|
7% |
|
|
|
|
|
|
|
|
||||||||||
QIWI |
13% |
|
|
|
|
|
|
|
|
|
16% |
80 |
|
|
|
|
|||||||||||
|
|
|
|
|
|
|
|
|
|
|
|
||||||||||||||||
|
|
|
|
|
|
|
|
|
|
|
|
|
|
||||||||||||||
Mail.ru Group |
14% |
|
|
|
|
|
|
|
|
|
|
|
|
|
|
||||||||||||
|
|
|
|
|
|
|
|
|
|
|
|
|
|
||||||||||||||
|
|
|
|
|
|
|
|
|
|
|
|
|
|
|
|
||||||||||||
MSCI EM Telecoms |
1% |
|
|
|
|
|
|
|
|
|
|
|
|
|
|
||||||||||||
|
|
|
|
|
|
|
|
|
|
|
|
|
|
||||||||||||||
16% |
|
|
|
|
|
|
|
|
|
|
|
|
|
|
|
|
|
|
|
||||||||
Kcell |
2% |
|
|
|
|
|
|
|
|
|
70 |
|
|
|
|
||||||||||||
|
|
|
|
|
|
|
|
|
|
|
|
||||||||||||||||
17% |
|
|
|
|
|
|
|
|
|
|
|
|
|
|
|
|
|
||||||||||
Russian telecoms |
0% |
|
|
|
|
|
|
|
|
Dec ’17 Feb ’18 |
Apr ’18 Jun ’18 Aug ’18 |
Oct ’18 Dec ’18 |
|||||||||||||||
|
|
|
|
|
|
|
|||||||||||||||||||||
20% |
|
|
|
|
|
|
|
|
|
|
|
|
|
|
|
|
|
|
|
|
|||||||
MTS |
2% |
|
|
|
|
|
|
|
|
|
|
|
|
|
|
|
|||||||||||
|
|
|
|
|
|
|
|
|
|
|
|
|
|
||||||||||||||
27% |
|
|
|
|
|
|
|
|
|
|
|
|
|
|
|
|
|
|
Russian telecoms |
Relative to EM telecoms |
Relative to RTS |
||||||
VEON |
6% |
|
|
|
|
|
|
|
|
|
|
|
|
|
|
|
|
||||||||||
29% |
|
|
|
|
|
|
|
|
|
|
|
|
5% |
|
|
|
Source: Sberbank CIB Investment Research |
|
|
||||||||
Sistema |
39% |
|
|
|
|
|
|
|
|
|
|
|
|
|
|
|
|
|
|
|
|
||||||
|
|
|
|
|
|
|
|
|
|
|
|
|
|
|
|
|
|
|
|
|
|
||||||
|
|
|
|
|
|
|
|
|
|
|
|
|
|
|
|
|
|
|
|
|
|
|
|
|
|
||
Luxoft |
29% |
|
|
|
|
|
|
|
|
|
|
|
|
|
|
|
|
|
|
|
|
|
|
|
|||
|
|
|
|
|
|
|
|
|
|
|
|
|
|
|
|
|
|
|
|
|
|
||||||
41% |
|
|
|
|
|
|
|
|
|
|
|
|
|
|
|
|
|
|
|
|
|
|
|
|
|
|
|
|
50% 30% 10% |
|
10% |
30% |
|
|
|
|
|
|
|||||||||||||||||
|
|
|
|
|
3m |
|
|
|
YTD |
|
|
|
|
|
|
|
|
||||||||||
|
|
|
|
|
|
|
|
|
|
|
|
|
|
|
|
||||||||||||
Source: Bloomberg, Sberbank CIB Investment Research
Forward P/E, telecoms |
|
|
|
|
|
|
|
|
|
Forward P/E, IT |
|
|
|
|
|
|
|
|
|||||||
25 |
|
|
|
|
|
|
|
|
|
|
|
30 |
|
|
|
|
|
|
|
|
|
|
|
|
|
20 |
|
|
|
|
|
|
|
|
|
|
|
25 |
|
|
|
|
|
|
|
|
|
|
|
|
|
|
|
|
|
|
|
|
|
|
|
|
|
|
|
|
|
|
|
|
|
|
|
|
|
||
15 |
|
|
|
|
|
|
|
|
|
|
|
|
|
|
|
|
|
|
|
|
|
|
|
|
|
|
|
|
|
|
|
|
|
|
|
|
|
20 |
|
|
|
|
|
|
|
|
|
|
|
|
|
10 |
|
|
|
|
|
|
|
|
|
|
|
|
|
|
|
|
|
|
|
|
|
|
|
|
|
5 |
|
|
|
|
|
|
|
|
|
|
|
15 |
|
|
|
|
|
|
|
|
|
|
|
|
|
|
|
|
|
|
|
|
|
|
|
|
|
|
|
|
|
|
|
|
|
|
|
|
|
|
|
0 |
|
|
|
|
|
|
|
|
|
|
|
10 |
|
|
|
|
|
|
|
|
|
|
|
|
|
|
|
|
|
|
|
|
|
|
|
|
|
|
|
|
|
|
|
|
|
|
|
||||
2005 |
2007 |
2009 |
2011 |
2013 |
2015 |
2017 |
|
|
|
2012 |
2013 |
2014 |
2015 |
2016 |
2017 |
2018 |
|
||||||||
|
|
|
Russia |
|
EM |
|
|
DM |
|
|
|
|
|
|
|
|
Luxoft |
|
|
EPAM Systems |
|
IT peers |
|||
Source: Bloomberg, Sberbank CIB Investment Research |
|
|
|
|
|
|
|
Source: Bloomberg, Sberbank CIB Investment Research |
|
|
|
||||||||||||||
|
|
|
|
|
|
|
|
|
|
|
|
|
|
|
|
|
|
|
|
|
|
|
|||
Valuation ratios |
|
|
|
|
|
|
|
|
|
|
|
|
|
|
|
|
|
|
|
|
|
|
|||
|
|
|
Price |
Target price |
MCap |
ADT |
|
|
P/E |
|
|
|
EPS growth |
|
EV/EBITDA |
|
P/BV |
Div yield |
Net debt/EBITDA |
||||||
|
|
|
|
|
|
|
|
|
|
||||||||||||||||
|
|
|
$ |
|
$ |
$ mln |
$ mln |
Rec |
2018E |
2019E |
|
2018E |
2019E |
|
2018E |
2019E |
|
2018E |
2018E |
2018E |
|||||
Yandex |
|
29.50 |
48.80 |
9,562 |
91.1 |
BUY |
28.2 |
|
20.6 |
|
|
29% |
37% |
|
13.8 |
9.1 |
|
4.4 |
0.0% |
289% |
|||||
EPAM Systems |
130.25 |
142.00 |
6,629 |
41.4 |
HOLD |
31.6 |
|
25.8 |
|
|
19% |
23% |
|
18.0 |
14.0 |
|
5.9 |
0.0% |
275% |
||||||
MTS |
|
7.41 |
13.28 |
7,656 |
31.8 |
HOLD |
6.8 |
|
6.4 |
|
|
4% |
7% |
|
3.2 |
3.1 |
|
3.3 |
11.3% |
89% |
|||||
Luxoft |
|
33.02 |
47.68 |
1,096 |
9.1 |
BUY |
11.8 |
|
13.9 |
|
|
3% |
15% |
|
7.4 |
7.5 |
|
2.4 |
0.0% |
97% |
|||||
VEON |
|
2.72 |
|
4.50 |
4,757 |
6.2 |
BUY |
17.4 |
|
13.1 |
|
157% |
33% |
|
3.2 |
3.1 |
|
0.9 |
11.4% |
179% |
|||||
Rostelecom |
|
1.06 |
|
1.14 |
2,920 |
5.7 |
HOLD |
9.3 |
|
7.8 |
|
|
9% |
20% |
|
3.4 |
3.2 |
|
0.6 |
7.1% |
168% |
||||
QIWI |
|
15.04 |
20.16 |
909 |
3.1 |
BUY |
12.7 |
|
8.7 |
|
|
4% |
46% |
|
6.2 |
4.3 |
|
2.1 |
0.0% |
242% |
|||||
Mail.ru Group |
|
24.98 |
40.66 |
5,498 |
2.7 |
BUY |
22.1 |
|
14.8 |
|
|
2% |
50% |
|
14.0 |
9.2 |
|
1.8 |
0.0% |
130% |
|||||
Sistema |
|
2.56 |
|
– |
1,235 |
2.1 |
– |
6.4 |
|
4.1 |
|
167% |
55% |
|
2.6 |
2.4 |
|
0.6 |
0.0% |
217% |
|||||
Russia Telecoms |
– |
|
– |
20,721 |
44.6 |
– |
9.7 |
|
8.6 |
|
|
74% |
12% |
|
3.3 |
3.1 |
|
1.3 |
8.2% |
140% |
|||||
Russia Media |
– |
|
– |
23,693 |
147.2 |
– |
23.9 |
|
17.9 |
|
|
14% |
33% |
|
13.6 |
9.7 |
|
3.3 |
0.0% |
226% |
|||||
EM |
|
– |
|
– |
– |
– |
– |
13.8 |
|
14.6 |
|
|
21% |
0% |
|
4.3 |
4.1 |
|
1.5 |
4.0% |
47% |
||||
DM |
|
– |
|
– |
– |
– |
– |
13.1 |
|
11.8 |
|
|
2% |
10% |
|
6.3 |
6.1 |
|
1.7 |
4.2% |
224% |
||||
Source: Bloomberg, Sberbank CIB Investment Research
SBERBANK CIB INVESTMENT RESEARCH |
25 |
This document is being provided for the exclusive use of iremizov1@bloomberg.net |
This document is being provided for the exclusive use of iremizov1@bloomberg.net |