

vk.com/id446425943
Magnit is better positioned than X5 to realise headcount savings
For food retailers staff costs are the largest SG&A expense and hence highly important to their bottom-line profitability. Over the past few years the large food retailers have been able to keep salary expenses under control, to a large extent due to low inflation. We believe both X5 and Magnit still have room to optimise headcount costs, with Magnit better positioned in this regard. In terms of other cost items, it’s not obvious there are major differences in efficiency levels between X5 and Magnit.
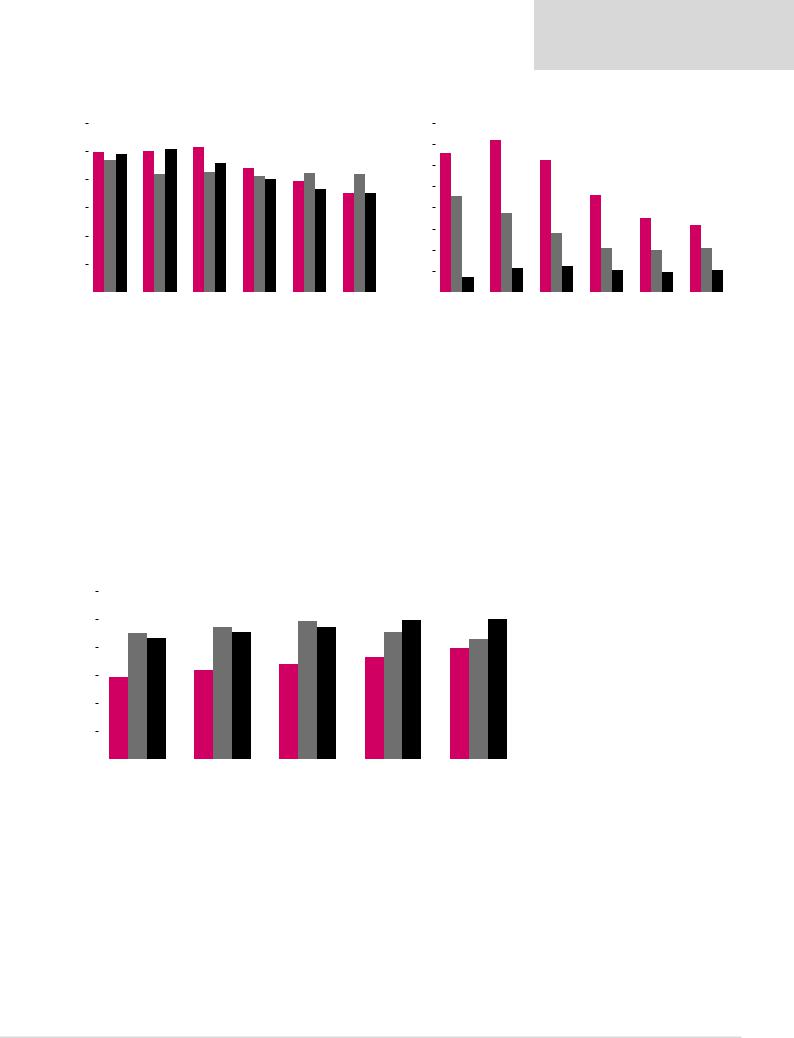
Figure 48: Staff costs are the largest SG&A expense for the major food retailers and they have managed to keep them under control in recent years (payroll as % of revenue)
|
Lenta |
|
X5 |
|
Magnit |
|
|
|
|||
|
|
|
14.0%
12.0%
10.0%
8.0%
6.0%
4.0%
2.0%
0.0%
2013 2014 2015 2016 2017
Source: Company data
Magnit has significantly optimised its headcount
While all major Russian retailers showed broadly stable or even slightly decreasing staff costs as a percentage of sales in recent years, the drivers of the improvement have varied. While X5’s average number of employees per m2 decreased only slightly over the past five years (48 in 2017 vs 53 in 2013), Magnit and Lenta showed significant improvements. Magnit’s comparable metric was at 48 in 2017 (vs 72 in 2013), with reduction achieved via both in-store and logistics operations optimisation.
Figure 49: Employees / ‘000sqm is going down
Employees / '000sqm
 Magnit
  X5
X5  Lenta
Lenta
80.0
70.0
60.0
50.0
40.0
30.0
20.0
10.0
0.0
2012 2013 2014 2015 2016 2017
Source: Company data, Renaissance Capital estimates
Renaissance Capital
21 January 2019
Russian retail
31
vk.com/id446425943
Renaissance Capital
21 January 2019
Russian retail
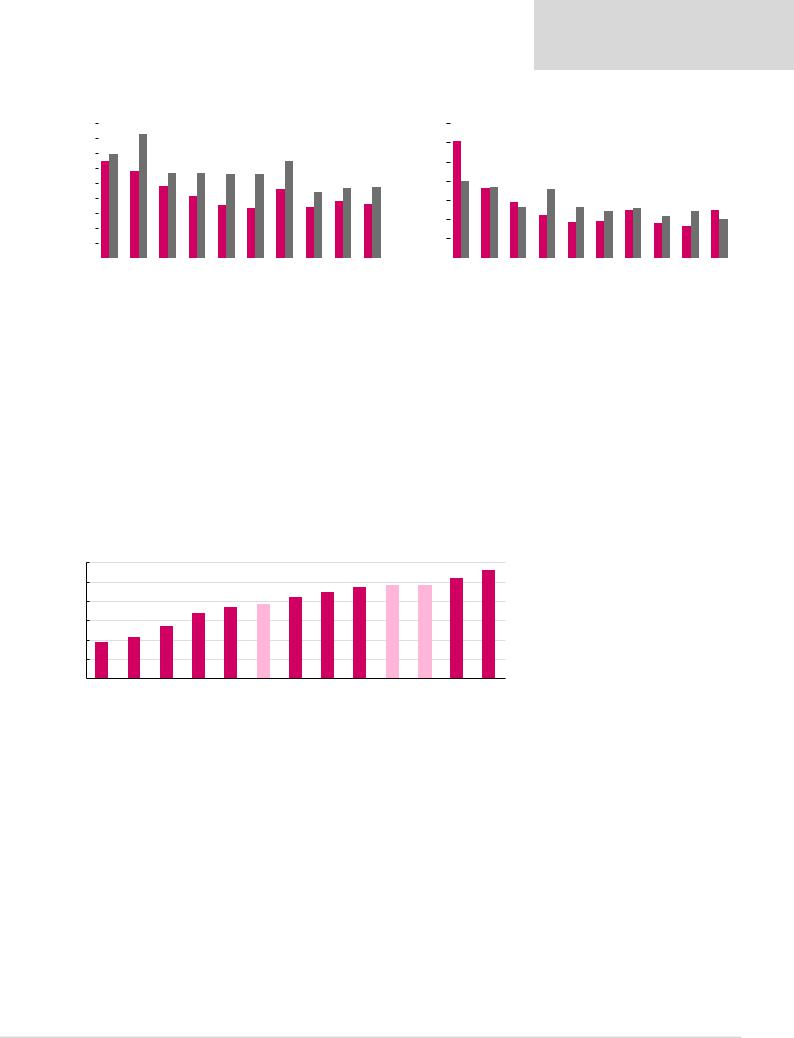
Figure 50: Retail employees / ‘000sqm |
|
|
|
|
|
|
Figure 51: Logistics employees / ‘000sqm |
|
|
|
|
|
|||||||||||
60.0 |
|
|
|
Magnit |
|
X5 |
|
Lenta |
|
|
|
16.0 |
|
|
|
Magnit |
|
X5 |
|
Lenta |
|
|
|
|
|
|
|
|
|
|
|
|
|
|
|
|
|
|
|
||||||||
|
|
|
|
|
|
|
|
|
|
|
|
|
|
|
|
||||||||
|
|
|
|
|
|
|
|
|
|
|
|
|
|
|
|
|
|
|
|
|
|
||
|
|
|
|
|
|
|
|
|
|
|
|
|
|
|
|
|
|
|
|
|
|
||
50.0 |
|
|
|
|
|
|
|
|
|
|
|
14.0 |
|
|
|
|
|
|
|
|
|
|
|
|
|
|
|
|
|
|
|
|
|
|
|
|
|
|
|
|
|
|
|
|
|
||
|
|
|
|
|
|
|
|
|
|
|
12.0 |
|
|
|
|
|
|
|
|
|
|
|
|
40.0 |
|
|
|
|
|
|
|
|
|
|
|
|
|
|
|
|
|
|
|
|
|
|
|
|
|
|
|
|
|
|
|
|
|
|
|
|
|
|
|
|
|
|
|
|
|
||
|
|
|
|
|
|
|
|
|
|
|
10.0 |
|
|
|
|
|
|
|
|
|
|
|
|
|
|
|
|
|
|
|
|
|
|
|
|
|
|
|
|
|
|
|
|
|
|
||
|
|
|
|
|
|
|
|
|
|
|
|
|
|
|
|
|
|
|
|
|
|
|
|
30.0 |
|
|
|
|
|
|
|
|
|
|
|
8.0 |
|
|
|
|
|
|
|
|
|
|
|
|
|
|
|
|
|
|
|
|
|
|
|
|
|
|
|
|
|
|
|
|
|
||
20.0 |
|
|
|
|
|
|
|
|
|
|
|
6.0 |
|
|
|
|
|
|
|
|
|
|
|
|
|
|
|
|
|
|
|
|
|
|
|
|
|
|
|
|
|
|
|
|
|
||
|
|
|
|
|
|
|
|
|
|
|
4.0 |
|
|
|
|
|
|
|
|
|
|
|
|
10.0 |
|
|
|
|
|
|
|
|
|
|
|
|
|
|
|
|
|
|
|
|
|
|
|
|
|
|
|
|
|
|
|
|
|
|
|
|
|
|
|
|
|
|
|
|
|
||
|
|
|
|
|
|
|
|
|
|
|
2.0 |
|
|
|
|
|
|
|
|
|
|
|
|
|
|
|
|
|
|
|
|
|
|
|
|
|
|
|
|
|
|
|
|
|
|
||
|
|
|
|
|
|
|
|
|
|
|
|
|
|
|
|
|
|
|
|
|
|
|
|
0.0 |
|
|
|
|
|
|
|
|
|
|
|
0.0 |
|
|
|
|
|
|
|
|
|
|
|
|
|
|
|
|
|
|
|
|
|
|
|
|
|
|
|
|
|
|
|
|
|
||
2012 |
2013 |
2014 |
|
2015 |
2016 |
2017 |
|
2012 |
2013 |
2014 |
|
2015 |
2016 |
2017 |
|
||||||||
|
|
|
|
|
|
|
Source: Company data, Renaissance Capital estimates |
|
|
|
|
|
|
|
Source: Company data, Renaissance Capital estimates |
||||||||
X5 is likely to face elevated wage inflation in order to catch up with the market
Unlike its peers, X5 cost optimisation measures in recent years seem to have been more focused on salary rather than headcount, with its average expense per employee down by 13% between 2015 and 2017 vs growth at Magnit and Lenta. While this is partially due to X5’s more regionally-focused expansion (with the opposite true for Magnit), its salary levels appear to be visibly below its main peers based on open vacancies in the same cities. Thus, we expect higher wage inflation at X5 vs Magnit over the next year making it more difficult to achieve material profitability improvement via staff optimisation.
Figure 52: Unlike its peers, X5 saw declining average cost per employee in recent years (average monthly wage expenses per employee, RUB)
60,000 |
|
|
|
Magnit |
|
X5 |
|
Lenta |
|
|
|
|
|
|
|
||||
|
|
|
|
|
|
||||
|
|
|
|
|
|
|
|
|
|
|
|
|
|
|
|
|
|
|
|
50,000 |
|
|
|
|
|
|
|
|
|
|
|
|
|
|
|
|
|
|
|
40,000 |
|
|
|
|
|
|
|
|
|
|
|
|
|
|
|
|
|
|
|
30,000 |
|
|
|
|
|
|
|
|
|
|
|
|
|
|
|
|
|
|
|
20,000 |
|
|
|
|
|
|
|
|
|
|
|
|
|
|
|
|
|
|
|
10,000 |
|
|
|
|
|
|
|
|
|
|
|
|
|
|
|
|
|
|
|
0 |
|
|
|
|
|
|
|
|
|
|
|
|
|
|
|
|
|
|
|
2013 |
2014 |
|
|
2015 |
2016 |
2017 |
|||
Note: Based on IFRS financials.
Source: Company data, Renaissance Capital estimates
32
vk.com/id446425943
Renaissance Capital
21 January 2019
Russian retail
Figure 53: Average cashier salary, RUB |
|
|
|
|
|
|
|
|
Figure 54: Average salary of store director, RUB |
|
|
|
|
|
|||||||||||||
45,000 |
|
|
|
|
Pyaterochka |
|
Magnit |
|
|
|
|
140,000 |
|
|
|
|
Pyaterochka |
|
Magnit |
|
|
|
|
||||
|
|
|
|
|
|
|
|
|
|
|
|
|
|
|
|
|
|
||||||||||
|
|
|
|
|
|
|
|
|
|
|
|
|
|
|
|
|
|
||||||||||
|
|
|
|
|
|
|
|
|
|
|
|
|
|
|
|
|
|
|
|
|
|
|
|
|
|
||
|
|
|
|
|
|
|
|
|
|
|
|
|
|
|
|
|
|
|
|
|
|
|
|
|
|
||
40,000 |
|
|
|
|
|
|
|
|
|
|
|
|
|
120,000 |
|
|
|
|
|
|
|
|
|
|
|
|
|
|
|
|
|
|
|
|
|
|
|
|
|
|
|
|
|
|
|
|
|
|
|
|
|
|
|
||
35,000 |
|
|
|
|
|
|
|
|
|
|
|
|
|
|
|
|
|
|
|
|
|
|
|
|
|
|
|
|
|
|
|
|
|
|
|
|
|
|
|
|
100,000 |
|
|
|
|
|
|
|
|
|
|
|
|
|
|
|
|
|
|
|
|
|
|
|
|
|
|
|
|
|
|
|
|
|
|
|
|
|
|
|
|
||
30,000 |
|
|
|
|
|
|
|
|
|
|
|
|
|
|
|
|
|
|
|
|
|
|
|
|
|
|
|
|
|
|
|
|
|
|
|
|
|
|
|
|
|
|
|
|
|
|
|
|
|
|
|
|
|
||
|
|
|
|
|
|
|
|
|
|
|
|
|
80,000 |
|
|
|
|
|
|
|
|
|
|
|
|
|
|
25,000 |
|
|
|
|
|
|
|
|
|
|
|
|
|
|
|
|
|
|
|
|
|
|
|
|
|
|
|
|
|
|
|
|
|
|
|
|
|
|
|
|
|
|
|
|
|
|
|
|
|
|
|
|
|
||
|
|
|
|
|
|
|
|
|
|
|
|
|
|
|
|
|
|
|
|
|
|
|
|
|
|||
20,000 |
|
|
|
|
|
|
|
|
|
|
|
|
|
60,000 |
|
|
|
|
|
|
|
|
|
|
|
|
|
|
|
|
|
|
|
|
|
|
|
|
|
|
|
|
|
|
|
|
|
|
|
|
|
|
|||
|
|
|
|
|
|
|
|
|
|
|
|
|
|
|
|
|
|
|
|
|
|
|
|
|
|
||
15,000 |
|
|
|
|
|
|
|
|
|
|
|
|
|
40,000 |
|
|
|
|
|
|
|
|
|
|
|
|
|
|
|
|
|
|
|
|
|
|
|
|
|
|
|
|
|
|
|
|
|
|
|
|
|
|
|
||
10,000 |
|
|
|
|
|
|
|
|
|
|
|
|
|
|
|
|
|
|
|
|
|
|
|
|
|
|
|
|
|
|
|
|
|
|
|
|
|
|
|
|
20,000 |
|
|
|
|
|
|
|
|
|
|
|
|
|
|
|
|
|
|
|
|
|
|
|
|
|
|
|
|
|
|
|
|
|
|
|
|
|
|
|
|
||
5,000 |
|
|
|
|
|
|
|
|
|
|
|
|
|
|
|
|
|
|
|
|
|
|
|
|
|
|
|
|
|
|
|
|
|
|
|
|
|
|
|
|
|
|
|
|
|
|
|
|
|
|
|
|
|
||
|
|
|
|
|
|
|
|
|
|
|
|
|
|
|
|
|
|
|
|
|
|
|
|
|
|
|
|
0 |
|
|
|
|
|
|
|
|
|
|
|
|
|
0 |
|
|
|
|
|
|
|
|
|
|
|
|
|
Moscow |
St-peterburg |
Kazan' |
|
Novosibirsk |
Krasnodar |
|
Ufa |
Anapa |
Penza |
Kopesk |
Tambov |
Moscow |
St-peterburg |
Kazan' |
Novosibirsk |
Krasnodar |
|
Ufa |
Anapa |
Penza |
Kopesk |
Tambov |
|||||
|
|
|
|
|
|||||||||||||||||||||||
|
|
|
|
|
|
|
|
|
Source: hh.ru, Renaissance Capital estimates |
|
|
|
|
|
|
|
|
|
Source: hh.ru, Renaissance Capital estimates |
||||||||
We see scope for both Magnit and X5 to further optimise their staff costs, with Magnit better positioned
The above said, a comparison of Russian largest retailers to international peers in terms of average number of employees per m2 suggests that there is still scope for optimisation at both Magnit and X5. However, given the higher level of salaries at Magnit in LfL locations, we think it is better positioned for staff cost optimisation over the next couple of years, with X5 potentially continuing to see pressure on its margin from employee expenses in the near term.
Figure 55: We think there is scope for headcount optimisation at both Magnit and X5 (employees / ‘000 m2)
Employees/'000sqm
60.0
50.0
40.0
30.0
20.0
10.0
0.0
Migros |
BIM |
Kroger's |
Pick'n'pay |
Biedronka |
Lenta |
Jeronimo Martins |
Dino |
Spar |
Magnit |
X5 |
Tesco |
Sainsbury's |
Source: Company data
33

vk.com/id446425943
Lenta’s outlook is challenging but we see value
Operating and financial trends at Lenta remain negative
As Magnit and X5 have significantly accelerated their expansion and widened their assortment, Lenta’s hypermarket offering has struggled, with LfL traffic consistently soft over the past two years. The proliferation of Magnit and X5 stores in convenient locations lessens the need for consumers to travel further to hypers and Magnit’s and X5’s expanded assortment means hypers’ value proposition needs to be extremely well defined. The net result for Lenta has been decelerating top-line growth, with profitability seeing a material deterioration, despite relatively favourable salary and rental trends across the market. With the company’s CEO and CFO having stepped down towards the end of 2018, near-term trading is unlikely to show any improvement, in our view, and we believe Lenta’s medium-term outlook is challenging.
Figure 56: Increased competition from alternative formats has contributed to soft LfL trends at Lenta
20.0% |
|
|
|
Sales |
Traffic |
Basket |
|
|
|
|
|
|
|
|
|
|
|
|
|
|
|
|
|
15.0% |
|
|
|
|
|
|
|
|
|
|
|
10.0% |
|
|
|
|
|
|
|
|
|
|
|
5.0% |
|
|
|
|
|
|
|
|
|
|
|
0.0% |
|
|
|
|
|
|
|
|
|
|
|
-5.0% |
|
|
|
|
|
|
|
|
|
|
|
1Q13 |
3Q13 |
1Q14 |
3Q14 |
1Q15 |
3Q15 |
1Q16 |
3Q16 |
1Q17 |
3Q17 |
1Q18 |
3Q18 |
Source: Company data
Renaissance Capital
21 January 2019
Russian retail
Figure 57: Revenue growth has slowed substantially… |
Figure 58: …and we expect margin pressure to continue in the medium term |
|
Revenue, RUBbn |
|
|
|
Growth, % |
500.0 |
|
|
|
|
|
40% |
45.0 |
450.0 |
|
|
|
|
|
35% |
40.0 |
400.0 |
|
|
|
|
|
30% |
35.0 |
|
|
|
|
|
|
||
350.0 |
|
|
|
|
|
|
|
|
|
|
|
|
|
30.0 |
|
|
|
|
|
|
|
25% |
|
300.0 |
|
|
|
|
|
|
|
|
|
|
|
|
|
25.0 |
|
250.0 |
|
|
|
|
|
20% |
|
|
|
|
|
|
20.0 |
||
200.0 |
|
|
|
|
|
|
|
|
|
|
|
|
15% |
|
|
|
|
|
|
|
|
15.0 |
|
150.0 |
|
|
|
|
|
|
|
|
|
|
|
|
10% |
|
|
100.0 |
|
|
|
|
|
10.0 |
|
|
|
|
|
|
|
||
|
|
|
|
|
|
|
|
50.0 |
|
|
|
|
|
5% |
5.0 |
0.0 |
|
|
|
|
|
0% |
0.0 |
2012 |
2013 |
2014 |
2015 |
2016 |
2017 |
2018E 2019E 2020E |
|
|
Adj. EBITDA, RUBbn |
|
|
|
Margin, % |
|
|
|
|
|
|
12.0% |
|
|
|
|
|
|
11.5% |
|
|
|
|
|
|
11.0% |
|
|
|
|
|
|
10.5% |
|
|
|
|
|
|
10.0% |
|
|
|
|
|
|
9.5% |
|
|
|
|
|
|
9.0% |
|
|
|
|
|
|
8.5% |
|
|
|
|
|
|
8.0% |
2012 |
2013 |
2014 |
2015 |
2016 |
2017 |
2018E 2019E 2020E |
Source: Company data, Renaissance Capital estimates |
Source: Company data, Renaissance Capital estimates |
Lenta scale disadvantage vs X5 and Magnit will likely continue to worsen
Given its poor financial results and management changes we expect all aspects of Lenta’s strategy to be up for review, with significant changes possible. In hypers, some new stores are likely to be seeing lower-than-expected returns and/or cannibalising legacy stores to a greater extent than anticipated, hence we assume expansion will be scaled back again. Lenta’s supermarkets have not lived up to expectations and lack scale; expansion plans were cut back in 2018 and assuming no major ramp up this year it
34

vk.com/id446425943
Renaissance Capital
21 January 2019
Russian retail
will be difficult to build a sustainable business in the absence of meaningful M&A, in our view. The supermarket segment is highly competitive in Russia’s large cities and, in our view, it would be better if Lenta exited the format. Slower expansion will lead to a material improvement in cash generation and in 2019 we forecast Lenta to become free cash flow positive for the first time. However, limited expansion and sales growth below X5 and Magnit means that Lenta’s importance to suppliers is likely to deteriorate relative to the market leaders, with negative implications for purchasing terms and profitability. Deteriorating competitiveness is the major structural risk to Lenta’s business model, but if combined with another large player, purchasing terms, profitability, cash flow and competitiveness could all improve substantially, in our view.
Figure 59: Lenta’s gross margin is materially lower vs X5 and Magnit… |
Figure 60: …due to worse purchasing terms |
|
|
||||||||||||||||||||
|
|
|
|
|
Gross margin, % |
|
|
|
|
|
|
CoGS as % of sales |
|||||||||||
25.0% |
|
|
|
|
Lenta |
|
X5 |
|
|
Magnit |
|
|
76.0% |
|
|
|
|
Lenta |
|
X5 |
|
Magnit |
|
|
|
|
|
|
|
|
|
|
|
|
|
|
|
|
|||||||||
|
|
|
|
|
|
|
|
|
|||||||||||||||
|
|
|
|
|
|
|
|
|
|
|
|
|
|
|
|||||||||
|
|
|
|
|
|
|
|
|
|
|
|
|
|
|
|
|
|
|
|
|
|
||
24.0% |
|
|
|
|
|
|
|
|
|
|
|
|
75.0% |
|
|
|
|
|
|
|
|
|
|
|
|
|
|
|
|
|
|
|
|
|
|
|
|
|
|
|
|
|
|
|
|
||
|
|
|
|
|
|
|
|
|
|
|
|
74.0% |
|
|
|
|
|
|
|
|
|
|
|
|
|
|
|
|
|
|
|
|
|
|
|
|
|
|
|
|
|
|
|
|
|
||
|
|
|
|
|
|
|
|
|
|
|
|
|
|
|
|
|
|
|
|
|
|
|
|
23.0% |
|
|
|
|
|
|
|
|
|
|
|
|
73.0% |
|
|
|
|
|
|
|
|
|
|
|
|
|
|
|
|
|
|
|
|
|
|
|
|
|
|
|
|
|
|
|
|
||
|
|
|
|
|
|
|
|
|
|
|
|
72.0% |
|
|
|
|
|
|
|
|
|
|
|
|
|
|
|
|
|
|
|
|
|
|
|
|
|
|
|
|
|
|
|
|
|
|
|
|
|
|
|
|
|
|
|
|
|
|
|
|
|
|
|
|
|
|
|
|
|
|
|
22.0% |
|
|
|
|
|
|
|
|
|
|
|
|
71.0% |
|
|
|
|
|
|
|
|
|
|
|
|
|
|
|
|
|
|
|
|
|
|
|
|
|
|
|
|
|
|
|
|
||
21.0% |
|
|
|
|
|
|
|
|
|
|
|
|
70.0% |
|
|
|
|
|
|
|
|
|
|
|
|
|
|
|
|
|
|
|
|
|
|
|
|
|
|
|
|
|
|
|
|
||
|
|
|
|
|
|
|
|
|
|
|
|
69.0% |
|
|
|
|
|
|
|
|
|
|
|
|
|
|
|
|
|
|
|
|
|
|
|
|
|
|
|
|
|
|
|
|
|
||
|
|
|
|
|
|
|
|
|
|
|
|
|
|
|
|
|
|
|
|
|
|
|
|
20.0% |
|
|
|
|
|
|
|
|
|
|
|
|
68.0% |
|
|
|
|
|
|
|
|
|
|
|
|
|
|
|
|
|
|
|
|
|
|
|
|
|
|
|
|
|
|
|
|
||
|
|
|
|
|
|
|
|
|
|
|
|
67.0% |
|
|
|
|
|
|
|
|
|
|
|
|
|
|
|
|
|
|
|
|
|
|
|
|
|
|
|
|
|
|
|
|
|
|
|
|
|
|
|
|
|
|
|
|
|
|
|
|
|
|
|
|
|
|
|
|
|
|
|
19.0% |
|
|
|
|
|
|
|
|
|
|
|
|
66.0% |
|
|
|
|
|
|
|
|
|
|
|
Lenta |
|
|
X5 |
Magnit |
|
Lenta |
|
X5 |
Magnit |
|||||||||||||
|
|
|
|
|
|
|
|||||||||||||||||
Note: Data for 2018E. |
|
|
|
|
|
|
|
|
|
|
|
Note: Data for 2018E. |
|
|
|
|
|
|
|
|
|
||
|
|
|
|
|
|
|
|
|
|
|
Source: Renaissance Capital estimates |
|
|
|
|
|
|
|
|
|
Source: Renaissance Capital estimates |
||
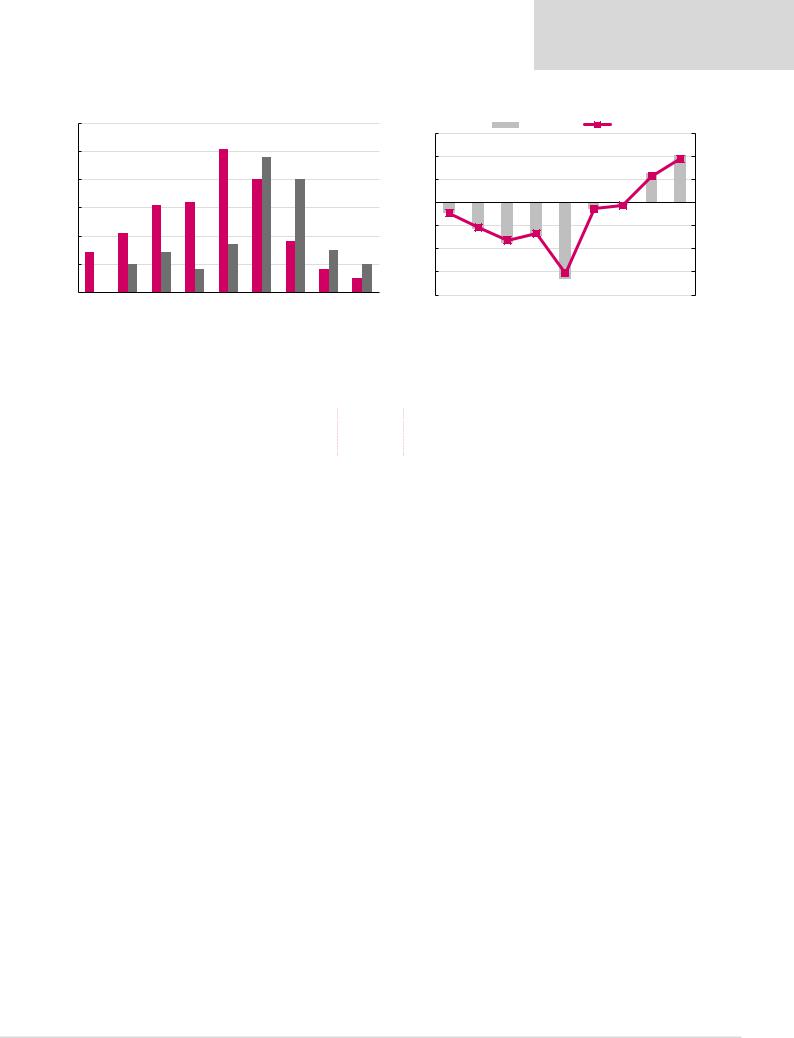
Lenta’s improving free cash flow points to significant value
In our base case, moderating space growth in 2019 and 2020 translates into free cash flow yields of 12% and 19%, respectively, and even considering the various risks we think this illustrates material value. Lenta has already announced a buy-back programme of up to RUB11.6bn and although liquidity and stock market rules mean this will be difficult to fully deploy, we believe a tender offer is also a possibility. Additional upside to profitability and cash generation could result from Lenta combining with another sizeable player, such as X5, Magnit, Auchan or even Azbuka Vkusa. This is not our base case for Lenta but given its valuation we think it competitors would be remiss not to at least consider this strategic route. For the publicly held companies, X5 and Magnit, beyond the financial rationale, the addition of Lenta stores to their networks could confirm overall market leadership and all the scale advantages this brings, additional regional scale in important geographies such as St Petersburg and Siberia and retail and marketing know-how, which could be leveraged across their own hyper and supermarket formats.
35
vk.com/id446425943
Renaissance Capital
21 January 2019
Russian retail
Figure 61: However, given the planned expansion slowdown…
|
Hyper openings |
|
Super openings |
|
|
||
|
|
60
50
40
30
20
10
0
2012 |
2013 |
2014 |
2015 |
2016 |
2017 |
2018E |
2019E |
2020E |
Figure 62: …FCF is likely to improve, with yield increasing to 12% / 19% in 2019 / 2020
30.0 |
|
|
FCF, RUBbn |
|
FCF yield |
30.0% |
|
|
|
|
|
|
|
||
20.0 |
|
|
|
|
|
|
20.0% |
10.0 |
|
|
|
|
|
|
10.0% |
0.0 |
|
|
|
|
|
|
0.0% |
-10.0 |
|
|
|
|
|
|
-10.0% |
-20.0 |
|
|
|
|
|
|
-20.0% |
-30.0 |
|
|
|
|
|
|
-30.0% |
-40.0 |
|
|
|
|
|
|
-40.0% |
2012 |
2013 |
2014 |
2015 |
2016 |
2017 |
2018E 2019E 2020E |
|
Source: Company data, Renaissance Capital estimates Source: Company data, Renaissance Capital estimates
Figure 63: …and we would see significant profitability and valuation upside if Lenta received purchasing terms of Magnit or X5, with FCF yield also looking highly attractive vs base case (TP sensitivity to long-term profitability assumptions)
|
|
Gross margin change vs base case |
|
||
|
-1.50% |
-0.75% |
0.00% |
0.75% |
1.50% |
TP, $/GDR |
2.1 |
3.2 |
4.2 |
5.2 |
6.2 |
FCF yield 2019 |
6.5% |
9.0% |
11.5% |
14.0% |
16.5% |
FCF yield 2020 |
13.6% |
16.3% |
19.0% |
21.8% |
24.5% |
Source: Renaissance Capital estimates
The potential acquisition of Lenta with a substantial premium to its market price could be substantially earnings-accretive
Below we illustrate a hypothetical scenario of Lenta being combined with a large player such as Magnit and X5, estimating the possible impact on the acquirer’s earnings. For illustrative purposes only we consider an acquisition of Lenta with the following assumptions:
▪The addition of Lenta’s revenue to standalone Magnit’s and X5’s revenue, without any major portfolio reorganisation.
▪Extra 120-bpt / 20-bpt increases in gross margin for Lenta / standalone Magnit and X5 on the back of increased scale.
▪A 10% reduction in Lenta’s SG&A costs vs our base case.
▪Valuation of Lenta, implying a 30% premium to the current market cap, with the deal 100% financed by debt at 7.5% interest rate.
36

vk.com/id446425943
Renaissance Capital
21 January 2019
Russian retail
Figure 64: Key financial estimates of the combined company in a hypothetical scenario of Magnit acquiring Lenta
|
2018E |
2019E |
2020E |
2021E |
2022E |
Revenue |
1,647 |
1,848 |
2,037 |
2,219 |
2,389 |
Growth, % |
|
12.2% |
10.3% |
8.9% |
7.7% |
Magnit |
1,229 |
1,403 |
1,562 |
1,720 |
1,872 |
Lenta |
418 |
445 |
475 |
499 |
517 |
Gross profit |
388 |
442 |
486 |
529 |
570 |
Margin, % |
23.5% |
23.9% |
23.9% |
23.8% |
23.9% |
Magnit base case |
298 |
339 |
378 |
416 |
453 |
Lenta base case |
89 |
94 |
99 |
103 |
107 |
Extra gross profit |
|
8.1 |
8.8 |
9.4 |
9.9 |
Extra gross margin (Magnit) |
|
0.20% |
0.20% |
0.20% |
0.20% |
Extra gross margin (Lenta) |
|
1.20% |
1.20% |
1.20% |
1.20% |
SG&A |
263 |
283 |
309 |
342 |
371 |
as % of revenue |
16.0% |
15.3% |
15.2% |
15.4% |
15.5% |
Magnit base case |
211 |
232 |
255 |
286 |
313 |
Lenta base case |
52 |
56 |
60 |
62 |
65 |
Savings at Lenta |
|
-6 |
-6 |
-6 |
-6 |
as % of Lenta's SG&A |
|
10.0% |
10.0% |
10.0% |
10.0% |
EBITDA |
125 |
159 |
177 |
187 |
199 |
Margin, % |
7.6% |
8.6% |
8.7% |
8.4% |
8.3% |
Magnit base case |
88 |
107 |
123 |
130 |
141 |
Lenta base case |
37 |
38 |
39 |
41 |
42 |
Extra EBITDA |
0 |
14 |
15 |
16 |
16 |
Net income |
44 |
50 |
64 |
72 |
83 |
Magnit base case |
32 |
43 |
54 |
59 |
66 |
Lenta base case |
12 |
13 |
15 |
18 |
21 |
Extra EBITDA less tax |
0 |
11 |
12 |
12 |
13 |
Extra financing costs |
|
-18 |
-18 |
-18 |
-18 |
Net income vs Magnit base case |
|
14% |
18% |
22% |
25% |
x |
|
|
|
|
|
Net debt |
212 |
429 |
385 |
327 |
271 |
Magnit base case |
118 |
106 |
83 |
50 |
21 |
Lenta base case |
94 |
82 |
61 |
37 |
11 |
Extra net debt |
|
241 |
241 |
240 |
239 |
Net debt / EBITDA |
1.7 |
2.7 |
2.2 |
1.8 |
1.4 |
Source: Renaissance Capital estimates
Figure 65: Sensitivity of an average increase in net income vs base case in 2019-2023E in the above scenario to different deal value and gross margin improvement
MktCap
Lenta's
Premium to
|
|
|
Lenta's gross margin increase |
|
|
|
0.60% |
0.90% |
1.20% |
1.50% |
1.80% |
50% |
12% |
15% |
17% |
19% |
21% |
40% |
14% |
16% |
18% |
20% |
22% |
30% |
15% |
18% |
20% |
22% |
24% |
20% |
17% |
19% |
21% |
23% |
25% |
10% |
18% |
21% |
23% |
25% |
27% |
Source: Renaissance Capital estimates
37

vk.com/id446425943
Renaissance Capital
21 January 2019
Russian retail
Figure 66: Key financial estimates of the combined company in a hypothetical scenario of X5 acquiring Lenta
|
2018E |
2019E |
2020E |
2021E |
2022E |
Revenue |
1,947 |
2,189 |
2,377 |
2,561 |
2,742 |
Growth, % |
|
12.4% |
8.6% |
7.7% |
7.1% |
X5 |
1,530 |
1,744 |
1,902 |
2,062 |
2,225 |
Lenta |
418 |
445 |
475 |
499 |
517 |
Gross profit |
459 |
522 |
563 |
602 |
645 |
Margin, % |
23.6% |
23.8% |
23.7% |
23.5% |
23.5% |
X5 base case |
370 |
419 |
455 |
489 |
527 |
Lenta base case |
89 |
94 |
99 |
103 |
107 |
Extra gross profit |
|
8.8 |
9.5 |
10.1 |
10.7 |
Extra gross margin (X5) |
|
0.20% |
0.20% |
0.20% |
0.20% |
Extra gross margin (Lenta) |
|
1.20% |
1.20% |
1.20% |
1.20% |
SG&A |
315 |
352 |
383 |
413 |
443 |
as % of revenue |
16.2% |
16.1% |
16.1% |
16.1% |
16.2% |
X5 base case |
263 |
302 |
329 |
357 |
385 |
Lenta base case |
52 |
56 |
60 |
62 |
65 |
Savings at Lenta |
|
-6 |
-6 |
-6 |
-6 |
as % of Lenta's SG&A |
|
10.0% |
10.0% |
10.0% |
10.0% |
EBITDA |
144 |
169 |
180 |
189 |
202 |
Margin, % |
7.4% |
7.7% |
7.6% |
7.4% |
7.4% |
X5 base case |
107 |
117 |
125 |
132 |
142 |
Lenta base case |
37 |
38 |
39 |
41 |
42 |
Extra EBITDA |
0 |
14 |
15 |
16 |
17 |
Net income |
43 |
39 |
48 |
58 |
71 |
X5 base case |
31 |
32 |
39 |
45 |
54 |
Lenta base case |
12 |
13 |
15 |
18 |
21 |
Extra EBITDA less tax |
0 |
11 |
12 |
13 |
13 |
Extra financing costs |
|
-18 |
-18 |
-18 |
-18 |
Net income vs X5 base case |
|
20% |
25% |
29% |
30% |
Net debt |
295 |
544 |
523 |
492 |
447 |
X5 base case |
201 |
221 |
222 |
215 |
197 |
Lenta base case |
94 |
82 |
61 |
37 |
11 |
Extra net debt |
|
241 |
240 |
240 |
239 |
Net debt / EBITDA |
2.0 |
3.2 |
2.9 |
2.6 |
2.2 |
Source: Renaissance Capital estimates
Figure 67: Sensitivity of an average increase in net income vs base case in 2019-2023E in the above scenario to different deal value and gross margin improvement
MktCap
Lenta's
Premium to
|
|
|
Lenta's gross margin increase |
|
|
|
0.60% |
0.90% |
1.20% |
1.50% |
1.80% |
50% |
17% |
20% |
22% |
25% |
28% |
40% |
19% |
22% |
24% |
27% |
30% |
30% |
21% |
24% |
26% |
29% |
32% |
20% |
23% |
26% |
28% |
31% |
34% |
10% |
25% |
28% |
30% |
33% |
36% |
Source: Renaissance Capital estimates
38