

vk.com/id446425943
Russian retail
Focus on Magnit’s turnaround
We upgrade Magnit to BUY with a $20.0/share TP (previously Hold; $15/share TP) as we believe improving operations and financial results over 2019 can help investor interest recover from a very low base. Valuation expectations for X5 have moderated but we think its management has a big challenge improving the product and protecting returns. We maintain our SELL rating ($23.0/share TP). Near-term trading at Lenta will remain difficult, in our view, but we see value as its expansion plans are scaled back and its cash flow yields become substantial, on our estimates. We therefore upgrade to BUY with a $4.2/share TP (previously Sell; $3.9/share TP).
Concerns that X5’s and Magnit’s growth is return-dilutive should moderate
X5’s and Magnit’s expansion has driven market space growth and led to deteriorating store economics. We believe the opportunity for further expansion is modest and expect X5’s and Magnit’s expansion mix to shift to non-organic openings. This should allow the leading players to keep growing without diluting returns.
We expect Magnit to take traffic from X5
Magnit’s assortment is now more comparable with X5’s in terms of choice and the look and feel of its stores has improved significantly. Given Magnit’s high overlap with Pyaterochka and planned focus on expansion in Moscow we expect Magnit to at least partially regain traffic lost to nearby Pyateochka’s stores. Better operating and financial results over 2019 could help investor interest in Magnit recover from a low base. Clearly Magnit’s largest shareholder will need to be hands-off and the board will have to work hard to convince a sceptical market it can deliver top-notch corporate governance and management stability this year.
Competition from specialists will weigh on X5’s earnings
Moscow is X5’s most important revenue and profit generator, with we estimate EBITDA profitability currently exceeding 11%. Given the ongoing rise of speciality retail in the capital as well as the potential push into the region by Magnit, we believe
X5’s Moscow margin is unsustainable in the medium term. Its management team seems to have convinced the market that it can continue to deliver near-term EBITDA profitability above 7% and valuation expectations have moderated but delivering ongoing product improvements and protecting returns will be a tough balancing act to maintain, in our view.
Lenta’s valuation is attractive – upgrade to BUY from Sell
Near-term trading is unlikely to show any signs of improvement and Lenta’s mediumterm outlook is challenging. However, we think expansion will be scaled back again and with cash flow yields of 12% and 19% in 2019/2020, respectively, on our estimates, we believe its share price offers good value even considering its weak competitive position. Though not the reason for our upgrade to BUY from Sell, potential upside to profitability and cash flow could result from Lenta being combined with another major player, with such a transaction leading to a material improvement in purchasing terms and SG&A efficiencies, in our view.
Sector update
Equity Research
21 January 2019
Consumer Goods & Retail Russia
David Ferguson +7 (495) 641-4189
DFerguson@rencap.com
Kirill Panarin
+7 (495) 258-7770 x4009 KPanarin@rencap.com
Lenta
Bloomberg |
LNTA LI |
Target price, $ |
4.2 |
Previous TP, $ |
3.9 |
Current price, $ |
3.4 |
Upside potential, % |
22.4 |
Rating |
BUY |
Previous rating |
Sell |
|
|
Magnit |
|
Bloomberg |
MGNT LI |
Target price, $ |
20.0 |
Previous TP, $ |
15.0 |
Current price, $ |
15.4 |
Upside potential, % |
29.9 |
Rating |
BUY |
Previous rating |
Hold |
|
|
X5 |
|
Bloomberg |
FIVE LI |
Target price, $ |
23.0 |
Previous TP, $ |
23.0 |
Current price, $ |
27.0 |
Upside potential, % |
-14.8 |
Rating |
SELL |
Previous rating |
Sell |
Prices in this report are intraday 18 January 2019
Source: Bloomberg, Renaissance Capital estimates
Important disclosures are found at the Disclosures Appendix. Communicated by Renaissance Securities (Cyprus) Limited, regulated by the Cyprus Securities & Exchange Commission, which together with non-US affiliates operates outside of the USA under the brand name of Renaissance Capital.

vk.com/id446425943
Contents
Investment summary |
3 |
Organic store openings should slow with M&A becoming more |
|
important |
4 |
New openings have led to sharp falls in traffic per store and the pace of expansion |
|
remains high |
4 |
Convenience store penetration is high in most geographies |
4 |
M&A is likely to become a more important growth driver |
7 |
Forcing smaller companies out of the market organically is an alternative strategy |
|
and already happening |
11 |
Magnit can once again take traffic from X5 |
12 |
Product offering matters more than ever and Magnit’s CVP has visibly improved |
12 |
There’s still room for improvement at Magnit but further roll-out of existing initiatives |
|
should lead to traffic regains |
16 |
Competition from specialists and Magnit in Moscow will |
|
weigh on X5’s earnings |
20 |
Moscow is an important profit generator for X5 and returns are declining |
20 |
Specialist retailers are growing rapidly in Moscow |
21 |
Profiles of the largest Russian speciality retailers |
22 |
Magnit is better positioned than X5 to realise headcount savings |
31 |
Magnit has significantly optimised its headcount |
31 |
X5 is likely to face elevated wage inflation in order to catch up with the market |
32 |
We see scope for both Magnit and X5 to further optimise their staff costs, |
|
with Magnit better positioned |
33 |
Lenta’s outlook is challenging but we see value |
34 |
Operating and financial trends at Lenta remain negative |
34 |
Lenta scale disadvantage vs X5 and Magnit will likely continue to worsen |
34 |
Lenta’s improving free cash flow points to significant value |
35 |
The potential acquisition of Lenta with a substantial premium to its market price could be |
|
substantially earnings-accretive |
36 |
Financials and valuation |
39 |
Magnit |
39 |
X5 |
40 |
Lenta |
41 |
Disclosures appendix |
43 |
Renaissance Capital
21 January 2019
Russian retail
2

vk.com/id446425943
Investment summary
Over the past few years X5 and Magnit have both expanded fast driving overall space growth in the market. With share gains from smaller players insufficient to offset their growing presence, the net result has been deteriorating store economics. In this report we look at convenience and supermarket penetration across Russia and conclude that the opportunity for further expansion is modest, at least if current levels of profitability are to be maintained. Hence, going forward we expect X5’s and Magnit’s expansion mix to shift towards non-organic openings. Although M&A comes with significant risks it should allow the leading players to keep growing without diluting returns and remove one of the main concerns held by investors over the past couple of years, in our view.
Assuming less aggressive openings by the largest players, share gains will increasingly depend on who offers the best consumer proposition. We believe Magnit’s assortment is now more comparable with X5’s in terms of choice and the look and feel of its stores has improved significantly. Given Magnit’s high overlap with Pyaterochka and planned focus on expansion in Moscow, we expect Magnit to at least partially regain traffic lost to nearby Pyaterochka’s stores and given Magnit’s often superior locations in regions, many of its stores do not need to be significantly better than X5’s; being comparable should be enough to help Magnit deliver better operating and financial results by the end of 2019 than it has done for many years, in our view. We believe Magnit’s largest shareholder will need to learn from its mistakes last year and be hands-off and Magnit’s board will have to convince a sceptical market that it can deliver top-notch corporate governance and management stability. Clearly the jury is out here but if progress is made we believe investor interest in Magnit can gradually recover from what is a very low base. As a result, we upgrade Magnit to BUY with a $20/share TP (previously Hold, $15/share TP).
Moscow is X5’s most important revenue and profit generator, contributing disproportionately to earnings growth over the past couple of years with we estimate EBITDA profitability currently exceeding 11%. Given the ongoing rise of speciality retail in the capital as well as the potential push into the region by Magnit, we believe X5’s Moscow margin is unsustainable in the medium term. X5 has more to lose than Magnit from speciality retail, in our view, and even though it can adjust its assortment, some traffic loss is inevitable. Following its investor day towards the end of last year X5 seems to have convinced the market that it can maintain near-term EBITDA profitability above 7% and valuation expectations have moderated a lot vs 12 months ago, although we still think its shares are vulnerable to any slip-up vs expectations and only time will tell whether its new management team can achieve a good balance between continuing to improve its product and protecting returns. We maintain our SELL on X5 ($23/share TP).
The proliferation of Magnit and X5 stores in convenient locations has lessened the need for consumers to travel further to Lenta hypers and Magnit’s and X5’s expanded assortment has meant Lenta’s value proposition is weaker than in the past. With the company’s CEO and CFO both having stepped down towards the end of 2018, near-term trading is unlikely to show any signs of improvement and we view Lenta’s medium-term outlook as challenging. Going forward we expect expansion to be scaled back and cash flow yields of 12% and 19% in 2019/2020, respectively, which even considering all the various risks Lenta is subject to points to material value, in our view. Though not the reason for our upgrade to BUY from Sell, we believe potential upside to profitability and cash generation could result from Lenta being combined with another major player leading to a substantial improvement in purchasing terms. For large players such as X5 and Magnit, beyond the financial rationale, the possible addition of Lenta stores to their networks could lead to overall market leadership and all the scale advantages this brings, additional regional scale in important geographies such as St Petersburg and Siberia and retail and marketing know-how, which could be leveraged across their own hyper and supermarket formats. We see value in Lenta as its expansion plans are scaled back and its cash flow yields become substantial, on our estimates. We therefore upgrade Lenta to BUY with a $4.2/share TP (previously Sell and $3.9/share TP).
Renaissance Capital
21 January 2019
Russian retail
3
vk.com/id446425943
Organic store openings should slow with M&A becoming more important
New openings have led to sharp falls in traffic per store and the pace of expansion remains high
Over the past few years X5 and Magnit have both continued expanding fast driving overall space growth in the market. At the same time, market share gains from smaller players have not offset their growing presence, with the net result being an ongoing reduction in average traffic per store. In 9M18 average weekly customers at Pyaterochka and Magnit Convenience stood at 6.1k and 5.7k, respectively, which is substantially lower than a few years ago.
Given deteriorating store economics X5 and Magnit have recently slowed their rate of openings. Nevertheless, overall expansion plans remain aggressive, with Magnit having guided for 9.4k new convenience stores during 2019-2023 and X5 having guided for 1.8k Pyaterochka openings in 2019.
Renaissance Capital
21 January 2019
Russian retail
Figure 1: Pyaterochka and Magnit Convenience have expanded fast in recent years…
Figure 2: …as a result, both chains have seen traffic per store decline reaching 6.1k / 5.7k customers per week in 9M18
|
|
|
|
|
Net openings |
|
|
|
|
|
|
|
|
Weekly traffic per store |
|
|
|
|||||||
3,500 |
|
|
|
Pyaterochka |
|
|
Magnit Convenience |
|
|
|
7,500 |
|
|
|
Pyaterochka |
|
Magnit Convenience |
|
|
|
||||
|
|
|
|
|
|
|
|
|
|
|
|
|
|
|
||||||||||
|
|
|
|
|
|
|
|
|
|
|
||||||||||||||
|
|
|
|
|
|
|
|
|
|
|
|
|
|
|
||||||||||
|
|
|
|
|
|
|
|
|
|
|
|
|
|
|
|
|
|
|
|
|
|
|||
|
|
|
|
|
|
|
|
|
|
|
|
|
|
|
|
|
|
|
|
|
|
|||
3,000 |
|
|
|
|
|
|
|
|
|
|
|
|
7,000 |
|
|
|
|
|
|
|
|
|
|
|
|
|
|
|
|
|
|
|
|
|
|
|
|
|
|
|
|
|
|
|
|
|
|||
2,500 |
|
|
|
|
|
|
|
|
|
|
|
|
|
|
|
|
|
|
|
|
|
|
||
|
|
|
|
|
|
|
|
|
|
|
|
|
|
|
|
|
|
|
|
|
|
|||
|
|
|
|
|
|
|
|
|
|
|
|
6,500 |
|
|
|
|
|
|
|
|
|
|
||
|
|
|
|
|
|
|
|
|
|
|
|
|
|
|
|
|
|
|
|
|
|
|||
2,000 |
|
|
|
|
|
|
|
|
|
|
|
|
|
|
|
|
|
|
|
|
|
|
||
|
|
|
|
|
|
|
|
|
|
|
|
|
|
|
|
|
|
|
|
|
|
|||
|
|
|
|
|
|
|
|
|
|
|
|
|
|
|
|
|
|
|
|
|
||||
1,500 |
|
|
|
|
|
|
|
|
|
|
|
|
6,000 |
|
|
|
|
|
|
|
|
|
|
|
|
|
|
|
|
|
|
|
|
|
|
|
|
|
|
|
|
|
|
|
|
|
|||
1,000 |
|
|
|
|
|
|
|
|
|
|
|
|
|
|
|
|
|
|
|
|
|
|
||
|
|
|
|
|
|
|
|
|
|
|
|
|
|
|
|
|
|
|
|
|
|
|||
|
|
|
|
|
|
|
|
|
|
|
|
5,500 |
|
|
|
|
|
|
|
|
|
|
||
|
|
|
|
|
|
|
|
|
|
|
|
|
|
|
|
|
|
|
|
|
|
|||
500 |
|
|
|
|
|
|
|
|
|
|
|
|
|
|
|
|
|
|
|
|
|
|
||
|
|
|
|
|
|
|
|
|
|
|
|
|
|
|
|
|
|
|
|
|
|
|||
|
|
|
|
|
|
|
|
|
|
|
|
|
|
|
|
|
|
|
|
|
|
|
||
0 |
|
|
|
|
|
|
|
|
|
|
|
|
5,000 |
|
|
|
|
|
|
|
|
|
|
|
|
|
|
|
|
|
|
|
|
|
|
|
|
|
|
|
|
|
|
|
|
|
|||
2013 |
2014 |
2015 |
2016 |
2017 |
9M17 |
9M18 |
|
|
|
|
|
|
|
|
|
|
||||||||
2014 |
2015 |
2016 |
2017 |
9M17 |
9M18 |
|||||||||||||||||||
|
|
|
|
|
|
|
|
|
|
|
|
|
||||||||||||
|
|
|
|
|
|
|
|
|
|
Source: Company data |
|
|
|
|
|
|
|
|
|
Source: Company data |
||||
Convenience store penetration is high in most geographies
To assess the expediency of the expansion strategies of Magnit and X5 and to what extent they could be achieved via the addition of new space to the market, we have looked at the penetration of convenience and supermarket formats in 57 Russian cities with a total population of around 34mn people. The sample covers c. 30% of Russia’s population excluding the Moscow area and Far East, and is quite representative, in our view. We have not, however, included very small chains or independent mom & pop stores in our analysis, which if included would result in even higher levels of penetration.
The average number of stores per 1mn people in our sample stands at 500, which we believe is quite high and implies around 5.5k weekly traffic per store, on our estimates. In terms of geographies, Siberia stands out as the region with the greatest potential to keep adding new space to the market, with Krasnoyarsk, Tyumen, Novosibirsk and Tomsk among the cities with the lowest number of stores per capita. St Petersburg is also one of the cities with the lowest saturation in terms of convenience and supermarket stores per capita; however, this might not reflect the real expansion opportunity due to high population density, lack of vacant real estate and the high hypermarket penetration in the city.
4
vk.com/id446425943
Renaissance Capital
21 January 2019
Russian retail
Figure 3: The number of convenience and supermarket stores per capita is already quite high in many Russian cities…
1,000 |
|
|
|
|
|
|
|
Stores per 1mn people |
|
|
Average |
||||
|
|
|
|
|
|
|
|
|
|||||||
|
|
|
|
|
|
|
|
|
|
|
|
|
|
|
|
|
|
|
|
|
|
|
|
|
|
|
|
|
|
|
|
900 |
|
|
|
|
|
|
|
|
|
|
|
|
|
|
|
|
|
|
|
|
|
|
|
|
|
|
|
|
|
|
|
800 |
|
|
|
|
|
|
|
|
|
|
|
|
|
|
|
|
|
|
|
|
|
|
|
|
|
|
|
|
|
|
|
700 |
|
|
|
|
|
|
|
|
|
|
|
|
|
|
|
|
|
|
|
|
|
|
|
|
|
|
|
|
|
|
|
600 |
|
|
|
|
|
|
|
|
|
|
|
|
|
|
|
|
|
|
|
|
|
|
|
|
|
|
|
|
|
|
|
500 |
|
|
|
|
|
|
|
|
|
|
|
|
|
|
|
|
|
|
|
|
|
|
|
|
|
|
|
|
|
|
|
400 |
|
|
|
|
|
|
|
|
|
|
|
|
|
|
|
|
|
|
|
|
|
|
|
|
|
|
|
|
|
|
|
300 |
|
|
|
|
|
|
|
|
|
|
|
|
|
|
|
|
|
|
|
|
|
|
|
|
|
|
|
|
|
|
|
200 |
|
|
|
|
|
|
|
|
|
|
|
|
|
|
|
|
|
|
|
|
|
|
|
|
|
|
|
|
|
|
|
100 |
|
|
|
|
|
|
|
|
|
|
|
|
|
|
|
|
|
|
|
|
|
|
|
|
|
|
|
|
|
|
|
0 |
|
|
|
|
|
|
|
|
|
|
|
|
|
|
|
|
|
|
|
|
|
|
|
|
|
|
|
|
|
|
|
Krasnoyarsk Starodub (Bryansk region) Novosibirsk Tomsk Michurinsk Shadrinsk (Kurgan region) Lipetsk Kropotkin Apatity (Murmansk region) Mikhailovka (Volgograd region) Rostov-on-Don Chelyabinsk Morshansk (Tambov region) Kamenka (Penza region) Murmansk Ufa Tyumen' St Pete Kuznetsk Vladimir Barnaul Belovo (Kemerovo region) Omsk Kursk Kartaly (Chelyabinsk region) Penza Kirov Volgograd Sarapul Orenburg Ekaterinburg Ishimbay (Bashkortostan region) Kaluga Krasnodar Izhevsk Sochi Velikiy Novgorod Kazan' Perm Magnitogorsk Novokuznetsk Stavropol Belgorod Anapa Kostroma Samara Smolensk Arhangelsk Naberezhnye Chelny Mtsensk (Orel region) Yoshkar Ola Ulianovsk Tolyatti Niznhy Novrogod Orel Znamenka (Orel region) Petrozavodsk |
|||||||||||||||
Note: Excludes small chains and mom & pop stores. |
|
|
|
|
|
|
|||||||||
|
|
|
|
|
|
|
|
|
|
|
|
Source: Companies' websites, Rosstat, Yandex.Maps, Renaissance Capital estimates |
|||
Figure 4: …and implies an average c. 5.5k weekly traffic per store in our sample |
|
|
|
|
|
|
|||||||||
14,000 |
|
|
|
|
|
Weekly traffic per store |
|
|
|
Average |
|||||
|
|
|
|
|
|
|
|
||||||||
|
|
|
|
|
|
|
|
|
|
|
|
|
|
||
|
|
|
|
|
|
|
|
|
|
|
|
|
|
||
12,000 |
|
|
|
|
|
|
|
|
|
|
|
|
|
|
|
|
|
|
|
|
|
|
|
|
|
|
|
|
|
||
10,000 |
|
|
|
|
|
|
|
|
|
|
|
|
|
|
|
|
|
|
|
|
|
|
|
|
|
|
|
|
|
||
8,000 |
|
|
|
|
|
|
|
|
|
|
|
|
|
|
|
|
|
|
|
|
|
|
|
|
|
|
|
|
|
||
6,000 |
|
|
|
|
|
|
|
|
|
|
|
|
|
|
|
|
|
|
|
|
|
|
|
|
|
|
|
|
|
||
4,000 |
|
|
|
|
|
|
|
|
|
|
|
|
|
|
|
|
|
|
|
|
|
|
|
|
|
|
|
|
|
||
2,000 |
|
|
|
|
|
|
|
|
|
|
|
|
|
|
|
|
|
|
|
|
|
|
|
|
|
|
|
|
|
||
0 |
|
|
|
|
|
|
|
|
|
|
|
|
|
|
|
|
|
|
|
|
|
|
|
|
|
|
|
|
|
||
Krasnoyarsk
Starodub (Bryansk region)
Novosibirsk
Tomsk
Michurinsk
Shadrinsk (Kurgan region)
Lipetsk
Kropotkin
Apatity (Murmansk region)
Mikhailovka (Volgograd region)
Rostov-on-Don
Chelyabinsk
Morshansk (Tambov region)
Kamenka (Penza region)
Murmansk
Ufa
Tyumen'
St Pete
Kuznetsk
Vladimir
Barnaul
Belovo (Kemerovo region)
Omsk
Kursk
Kartaly (Chelyabinsk region)
Penza
Kirov
Volgograd
Sarapul
Orenburg
Ekaterinburg
Ishimbay (Bashkortostan region)
Kaluga
Krasnodar
Izhevsk
Sochi
Velikiy Novgorod
Kazan'
Perm
Magnitogorsk
Novokuznetsk
Stavropol
Belgorod
Anapa
Kostroma
Samara
Smolensk
Arhangelsk
Naberezhnye Chelny
Mtsensk (Orel region)
Yoshkar Ola
Ulianovsk
Tolyatti
Niznhy Novrogod
Orel
Znamenka (Orel region)
Petrozavodsk
Note: Excludes small chains and mom & pop stores.
Source: Companies' websites, Rosstat, Yandex.Maps, Renaissance Capital estimates
5
vk.com/id446425943
Renaissance Capital
21 January 2019
Russian retail
Figure 5: An average of 500 stores (convenience and supermarket) per 1mn people in our sample is higher than in some Western European markets and broadly in line with the UK, Spain and Italy
Stores per 1mn people
700
600
500
400
300
200
100
0
Belgium |
France |
Germany |
Spain |
UK |
Italy |
Russia |
Austria |
Czech |
|
|
|
|
|
|
(RenCap |
|
Republic |
|
|
|
|
|
|
sample) |
|
|
Source: Euromonitor, Renaissance Capital estimates
When compared on a country level Russia is behind Western Europe and the US in terms of retail space per capita, especially in the modern segment. However, in our view this does not mean there is a lot of scope to add new space in Russia as retailers’ EBITDA margins in western markets are lower vs Russian peers, with those levels likely being unsustainable for Russian retailers due to their higher cost of capital. Moreover, given the country’s size and unequal retail development among different regions, we think countrywide metrics are misleading in the case of Russia.
Figure 6: Russia is behind Western Europe and the US in terms of grocery retail selling space per capita overall…
Grocery retail selling space per 1k people, '000s m2
800
700
600
500
400
300
200
100
00
Figure 7: …and in the modern segment…
Modern grocery retail selling space per 1k people, '000s m2
600
500
400
300
200
100
00
UK |
Russia |
Poland |
Netherlands |
Belgium |
Germany |
France |
USA |
Russia |
UK |
Belgium |
Poland |
Netherlands |
France |
Germany |
USA |
|
|
|
|
|
|
|
Source: Euromonitor |
|
|
|
|
|
|
|
Source: Euromonitor |
6
vk.com/id446425943
Renaissance Capital
21 January 2019
Russian retail
Figure 8: …but we don’t think there is a lot of scope to add new space in Russia as western markets’ players’ margins are unlikely to be sustainable in Russia due to the higher cost of capital
EBITDA margin (last FY reported)
12.0% |
|
|
|
|
|
|
|
|
|
|
|
|
|
|
|
|
|
10.0% |
|
|
|
|
|
|
|
|
|
|
|
|
|
|
|
|
|
8.0% |
|
|
|
|
|
|
|
|
|
|
|
|
|
|
|
|
|
6.0% |
|
|
|
|
|
|
|
|
|
|
|
|
|
|
|
|
|
4.0% |
|
|
|
|
|
|
|
|
|
|
|
|
|
|
|
|
|
2.0% |
|
|
|
|
|
|
|
|
|
|
|
|
|
|
|
|
|
0.0% |
Magnit |
X5 |
Shoprite |
Walmart |
|
|
|
|
|
Morrison |
Kroger |
|
Costco |
Massmart |
|
Spar |
Eurocash |
Dino |
Casey's |
Migros |
Jeronimo Martin's |
Tesco |
BIM |
Sainsbury's |
Pick'n'pay |
Note: 2018E forecasts shown for Magnit and X5.
Source: Company data, Renaissance Capital estimates
M&A is likely to become a more important growth driver
Assuming the minimum weekly traffic per store of 5k people (equivalent to an estimated 500 stores per 1mn people) we estimate the remaining organic expansion opportunity at 2.3k stores in our sample of 57 cities, with the bulk of it being in St Petersburg and Siberia. While it’s clearly possible to open more than 500 stores per 1mn people (as is the case in many geographies already), we think this would inevitably lead to further reduction of margins and returns for all market participants including Magnit and X5, and so we think there is not enough scope for them to keep expanding organically at a rapid rate and maintain their current levels of profitability.
7

vk.com/id446425943
Renaissance Capital
21 January 2019
Russian retail
Figure 9: We believe that outside Siberia there is limited scope for federal retailers to keep adding new space to the market while maintaining a solid RoIC (remaining opportunity to add new convenience stores to the market before reaching 500 stores per 1mn people)
|
Magnit |
Pyaterochka |
Others |
|
Total |
Population, |
Share of |
|
Stores per |
Weekly |
|
Maximum |
Remaining |
|
|
|
traffic per |
|
number of |
||||||||
|
stores |
stores |
(total) |
|
stores |
'000s |
MGNT/X5 |
|
1mn people |
|
opportunity |
||
|
|
|
|
|
|
|
|
|
|
store (est.) |
|
stores |
|
St Pete |
213 |
370 |
1,191 |
|
2,157 |
5,352 |
30% |
|
403 |
6,203 |
|
2,676 |
519 |
Novosibirsk |
54 |
78 |
324 |
475 |
1,613 |
28% |
295 |
8,489 |
806 |
331 |
|||
Ekaterinburg |
165 |
180 |
357 |
|
737 |
1,469 |
50% |
|
502 |
4,982 |
|
734 |
0 |
Niznhy Novrogod |
162 |
318 |
393 |
900 |
1,259 |
56% |
715 |
3,497 |
630 |
0 |
|||
Kazan' |
177 |
210 |
272 |
|
671 |
1,244 |
59% |
|
540 |
4,633 |
|
622 |
0 |
Chelyabinsk |
112 |
158 |
113 |
450 |
1,202 |
63% |
374 |
6,678 |
601 |
151 |
|||
Omsk |
178 |
92 |
228 |
|
508 |
1,172 |
54% |
|
433 |
5,768 |
|
586 |
78 |
Samara |
179 |
286 |
236 |
730 |
1,163 |
67% |
627 |
3,984 |
582 |
0 |
|||
Rostov-on-Don |
132 |
133 |
134 |
|
411 |
1,130 |
67% |
|
364 |
6,875 |
|
565 |
154 |
Ufa |
80 |
89 |
257 |
438 |
1,128 |
41% |
388 |
6,438 |
564 |
126 |
|||
Krasnoyarsk |
22 |
0 |
187 |
|
210 |
1,091 |
11% |
|
193 |
12,986 |
|
545 |
335 |
Perm |
139 |
230 |
196 |
574 |
1,048 |
66% |
548 |
4,564 |
524 |
0 |
|||
Volgograd |
147 |
54 |
255 |
|
471 |
1,014 |
46% |
|
465 |
5,380 |
|
507 |
36 |
Krasnodar |
159 |
72 |
220 |
471 |
900 |
53% |
524 |
4,775 |
450 |
0 |
|||
Tyumen' |
61 |
75 |
155 |
|
308 |
768 |
47% |
|
401 |
6,237 |
|
384 |
76 |
Tolyatti |
107 |
114 |
263 |
496 |
707 |
46% |
701 |
3,566 |
354 |
0 |
|||
Izhevsk |
114 |
85 |
133 |
|
340 |
648 |
61% |
|
525 |
4,766 |
|
324 |
0 |
Barnaul |
32 |
20 |
213 |
269 |
633 |
19% |
425 |
5,886 |
317 |
48 |
|||
Ulianovsk |
109 |
72 |
245 |
|
434 |
627 |
43% |
|
693 |
3,609 |
|
313 |
0 |
Tomsk |
18 |
6 |
154 |
179 |
574 |
13% |
312 |
8,012 |
287 |
108 |
|||
Orenburg |
113 |
115 |
43 |
|
281 |
565 |
83% |
|
498 |
5,025 |
|
282 |
1 |
Novokuznetsk |
35 |
12 |
275 |
325 |
552 |
15% |
588 |
4,250 |
276 |
0 |
|||
Naberezhnye Chelny |
77 |
133 |
140 |
|
359 |
532 |
60% |
|
674 |
3,708 |
|
266 |
0 |
Penza |
93 |
61 |
78 |
239 |
524 |
67% |
456 |
5,478 |
262 |
23 |
|||
Lipetsk |
60 |
84 |
30 |
|
181 |
510 |
83% |
|
355 |
7,050 |
|
255 |
74 |
Kirov |
77 |
56 |
98 |
232 |
507 |
58% |
457 |
5,465 |
254 |
22 |
|||
Kursk |
83 |
63 |
53 |
|
204 |
449 |
74% |
|
455 |
5,499 |
|
224 |
20 |
Stavropol |
73 |
65 |
115 |
260 |
434 |
55% |
599 |
4,172 |
217 |
0 |
|||
Sochi |
65 |
71 |
83 |
|
228 |
424 |
64% |
|
537 |
4,652 |
|
212 |
0 |
Magnitogorsk |
47 |
71 |
102 |
230 |
417 |
55% |
552 |
4,527 |
208 |
0 |
|||
Belgorod |
87 |
61 |
82 |
|
235 |
392 |
64% |
|
600 |
4,165 |
|
196 |
0 |
Vladimir |
44 |
48 |
30 |
149 |
357 |
66% |
417 |
5,990 |
179 |
30 |
|||
Arhangelsk |
48 |
51 |
133 |
|
235 |
350 |
43% |
|
672 |
3,721 |
|
175 |
0 |
Kaluga |
51 |
62 |
40 |
173 |
341 |
66% |
508 |
4,926 |
170 |
0 |
|||
Smolensk |
57 |
37 |
102 |
|
216 |
330 |
44% |
|
654 |
3,820 |
|
165 |
0 |
Orel |
69 |
73 |
106 |
257 |
315 |
57% |
815 |
3,067 |
158 |
0 |
|||
Murmansk |
15 |
13 |
73 |
|
114 |
295 |
25% |
|
386 |
6,478 |
|
148 |
34 |
Petrozavodsk |
54 |
26 |
154 |
251 |
279 |
33% |
899 |
2,781 |
140 |
0 |
|||
Kostroma |
22 |
32 |
107 |
|
171 |
277 |
33% |
|
617 |
4,054 |
|
139 |
0 |
Yoshkar Ola |
39 |
58 |
79 |
182 |
268 |
57% |
678 |
3,685 |
134 |
0 |
|||
Velikiy Novgorod |
39 |
30 |
39 |
|
120 |
223 |
59% |
|
539 |
4,639 |
|
111 |
0 |
Sarapul |
13 |
4 |
28 |
46 |
98 |
39% |
470 |
5,321 |
49 |
3 |
|||
Michurinsk |
16 |
11 |
4 |
|
32 |
94 |
88% |
|
342 |
7,320 |
|
47 |
15 |
Kuznetsk |
12 |
15 |
6 |
34 |
83 |
82% |
408 |
6,132 |
42 |
8 |
|||
Kropotkin |
11 |
3 |
13 |
|
28 |
79 |
54% |
|
356 |
7,021 |
|
39 |
11 |
Anapa |
19 |
10 |
15 |
46 |
76 |
67% |
606 |
4,123 |
38 |
0 |
|||
Shadrinsk (Kurgan region) |
9 |
3 |
14 |
|
26 |
76 |
46% |
|
344 |
7,271 |
|
38 |
12 |
Belovo (Kemerovo region) |
5 |
7 |
20 |
32 |
74 |
38% |
432 |
5,785 |
37 |
5 |
|||
Ishimbay (Bashkortostan region) |
11 |
7 |
13 |
|
33 |
65 |
61% |
|
504 |
4,956 |
|
33 |
0 |
Mikhailovka (Volgograd region) |
8 |
4 |
8 |
21 |
58 |
62% |
359 |
6,956 |
29 |
8 |
|||
Apatity (Murmansk region) |
10 |
3 |
5 |
|
20 |
56 |
65% |
|
359 |
6,964 |
|
28 |
8 |
Morshansk (Tambov region) |
4 |
4 |
7 |
15 |
39 |
53% |
381 |
6,560 |
20 |
5 |
|||
Mtsensk (Orel region) |
7 |
11 |
4 |
|
26 |
38 |
69% |
|
678 |
3,688 |
|
19 |
0 |
Kamenka (Penza region) |
8 |
2 |
4 |
14 |
37 |
71% |
383 |
6,530 |
18 |
4 |
|||
Kartaly (Chelyabinsk region) |
4 |
4 |
3 |
|
13 |
29 |
69% |
|
455 |
5,496 |
|
14 |
1 |
Starodub (Bryansk region) |
3 |
2 |
0 |
5 |
19 |
100% |
266 |
9,412 |
9 |
4 |
|||
Znamenka (Orel region) |
2 |
2 |
2 |
|
10 |
12 |
40% |
|
864 |
2,893 |
|
6 |
0 |
|
|
|
|
|
|
|
|
|
|
|
|
|
|
Note: Excludes small chains and mom & pop stores.
Source: Renaissance Capital estimates
We believe that going forward X5’s and Magnit’s growth mix will increasingly shift in favour of non-organic openings, with M&A becoming a bigger theme. Although this comes with risks, especially around price paid and integration, we would view such a shift positively as this would allow the leading players to keep growing and be less dilutive for traffic and returns and hence eliminate one of the main concerns currently held by
8
vk.com/id446425943
Renaissance Capital
21 January 2019
Russian retail
investors. In this regard, below is a list of the largest regional retail chains, with the top-22 players operating around 9k stores, which can suffice several years of expansion for X5 and Magnit combined. With most regional chains having c. 500 stores usually located in close proximity, we believe deals are likely to be bolt-on in nature and relatively easy for Magnit and X5 to digest.
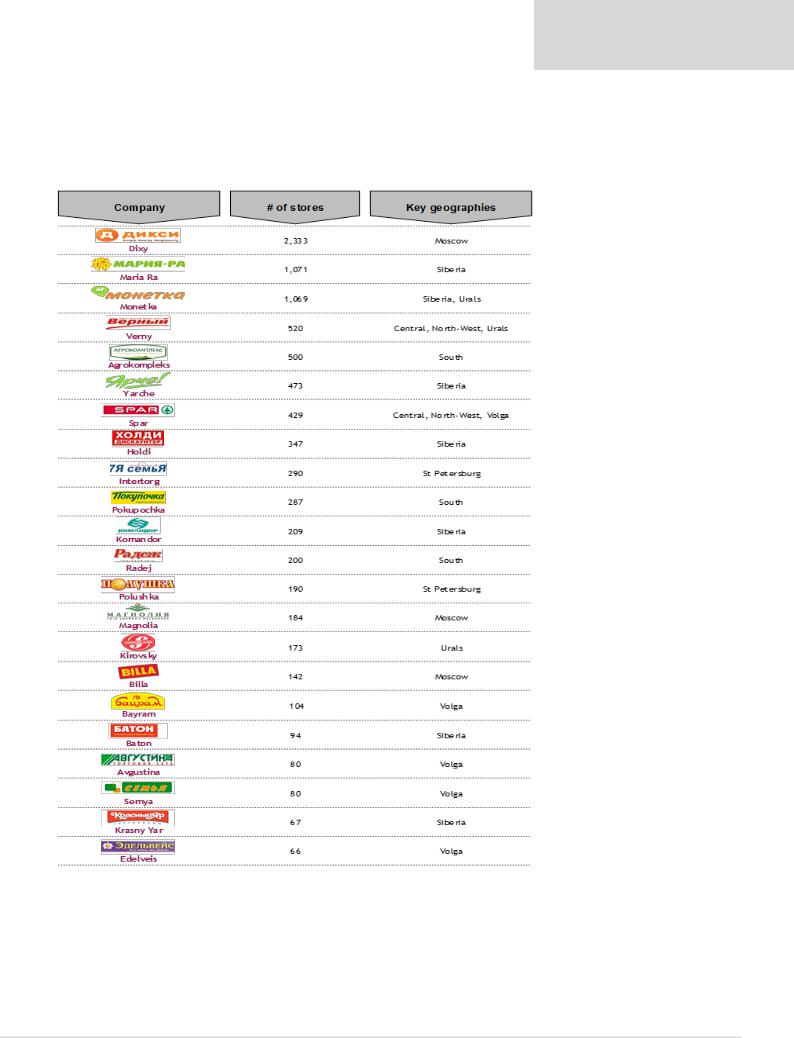
Figure 10: Russian regional food retail chains (convenience and supermarket)
Source: Company data, 2GIS, Yandex.Maps
In our view, not only could X5 and Magnit grow their overall share via M&A, but they could also quickly gain scale in cities where they currently have a limited presence. Many smaller players are typically focused on one or two geographical areas and there are many examples of cities where X5 or Magnit could substantially increase scale via M&A (see Figure 11).
9

vk.com/id446425943
Renaissance Capital
21 January 2019
Russian retail
Figure 11: There are many cities where regional chains have a similar or larger scale than federal players
City |
# of Magnit stores |
# Pyaterochka stores |
Competitors (# of stores) |
|
||
|
|
|
Dixy |
|
288 |
|
|
|
|
Verny |
|
79 |
|
St-Petersburg |
213 |
370 |
Polushka |
|
147 |
|
|
|
|
Intertorg |
|
227 |
|
|
|
|
Spar |
|
102 |
|
|
|
|
Verny |
24 |
||
|
|
|
Edelveis |
66 |
||
Kazan' |
177 |
210 |
Avgustina |
76 |
||
|
|
|
Noy |
26 |
||
|
|
|
Mechta |
25 |
||
|
|
|
Monetka |
|
107 |
|
Ekaterinburg |
165 |
180 |
Verny |
|
92 |
|
|
|
|
Kirovsky |
|
158 |
|
Krasnodar |
159 |
72 |
Agrokomplesk |
138 |
||
|
|
|
Radej |
|
111 |
|
Volgograd |
147 |
54 |
Pokupochka |
|
98 |
|
|
|
|
Man |
|
27 |
|
|
|
|
Monetka |
71 |
||
Perm |
139 |
230 |
Semya |
63 |
||
|
|
|
Zahodi |
26 |
||
|
|
|
Monetka |
|
74 |
|
Kemerovo |
135 |
29 |
Maria-Ra |
|
337 |
|
|
|
|
Yarche |
|
138 |
|
|
|
|
Solnechniy Krug |
19 |
||
Rostov |
132 |
133 |
Assorti |
41 |
||
Agrokomplesk |
39 |
|||||
|
|
|
||||
|
|
|
Apeks Plus |
15 |
||
Saratov |
119 |
71 |
Semeniy |
|
170 |
|
Grozd |
|
230 |
||||
|
|
|
|
|||
|
|
|
Dixy |
54 |
||
Chelyabinsk |
112 |
158 |
Monetka |
54 |
||
Spar |
33 |
|||||
|
|
|
||||
|
|
|
Sitno |
18 |
||
Ufa |
80 |
89 |
Monetka |
|
36 |
|
Bayram |
|
88 |
||||
|
|
|
|
|||
Kirov |
77 |
56 |
Sistema Globus |
31 |
||
Lavka |
28 |
|||||
|
|
|
||||
Tumen |
61 |
75 |
Monetka |
|
46 |
|
Lipetsk |
60 |
84 |
Pokupayka |
30 |
||
|
|
|
Monetka |
|
31 |
|
Novosibirsk |
54 |
78 |
Maria-Ra |
|
136 |
|
Yarche |
|
100 |
||||
|
|
|
|
|||
|
|
|
Holdi |
|
51 |
|
Kaluga |
51 |
62 |
Dixy |
17 |
||
Prazdnichny |
22 |
|||||
|
|
|
||||
|
|
|
Dixy |
|
10 |
|
Velikiy Novgorod |
39 |
30 |
Verny |
|
10 |
|
Kvartal |
|
10 |
||||
|
|
|
|
|||
|
|
|
Osen |
|
14 |
|
|
|
|
Yarche |
64 |
||
Novokuznetsk |
35 |
12 |
Monetka |
41 |
||
Maria Ra |
147 |
|||||
|
|
|
||||
|
|
|
Holdi |
23 |
||
Barnaul |
32 |
20 |
Maria-Ra |
|
160 |
|
Yarche |
|
53 |
||||
|
|
|
|
|||
|
|
|
Krasny Yar |
55 |
||
Krasnoyarsk |
22 |
0 |
Komandor |
82 |
||
Svetofor |
10 |
|||||
|
|
|
||||
|
|
|
Baton |
40 |
||
Anapa |
19 |
10 |
Agrokomplesk |
|
15 |
|
|
|
|
Monetka |
8 |
||
Tomsk |
18 |
6 |
Maria-Ra |
52 |
||
Yarche |
83 |
|||||
|
|
|
||||
|
|
|
Holdi |
10 |
||
|
|
|
Dixy |
|
13 |
|
Murmansk |
15 |
13 |
Intertorg |
|
12 |
|
Yablochko |
|
24 |
||||
|
|
|
|
|||
|
|
|
Euroros |
|
33 |
|
Sarapul |
13 |
4 |
Kopeechka |
|
10 |
|
BMKiK |
13 |
|||||
|
|
|
||||
Kropotkin |
11 |
3 |
Agrokomplesk |
|
12 |
|
Source: Company data, 2GIS, Yandex.Maps
10
vk.com/id446425943
Renaissance Capital
21 January 2019
Russian retail
Forcing smaller companies out of the market organically is an alternative strategy and already happening
In our view, an alternative strategy to M&A could be ongoing rapid organic space addition by the largest players in order to further dilute traffic density for retailers and force smaller and less profitable companies to exit the market. This would likely lead to lower profits for X5 and Magnit in the short term; however, in the event of smaller players exiting the market, it could eventually be a cheaper (albeit slower) way to achieve a stronger market position.
We think this process is already ongoing and there are multiple cases of various-scale regional chains having exited the market or being closed due to bankruptcy:
▪Holiday was historically one of the largest food retailers in Siberia (founded in 2000) operating over 500 stores in several formats. The company generated around RUB56bn revenue in 2017 but its financial position is weak. In late 2017 Holiday sold 22 supermarkets (40k m2) to Lenta; later it closed or reformatted its stores operating under the Holiday Classic banner only keeping its Holdi
(discounters) and Farmer’s Center (natural goods) formats, with the number of stores having fallen to around 300 during 2018. Last year Holiday received over 250 claims from its lenders and suppliers and was declared bankrupt.
▪Chibis is another Siberian retailer which had about 180 stores (under Chibis and Polyana logos) several years ago. In 2016 due to debts, control of the company was transferred to MDM Bank and by the end of 2016 the number of stores had decreased to just over 100. Shortly afterwards Chibis went bankrupt, with most of its locations taken by Maria Ra and Magnit.
▪Estniy is a St Petersburg-based chain which started in 2012 and quickly expanded its store base to around 150 by 2016. However, it failed to operate profitably and in early-2017 received bankruptcy claims from Bank Rossiya and one of its suppliers, eventually closing its stores.
▪There are also multiple cases of smaller local chains being forced out of the market. For example, Vivat, one of the largest food retailers in Perm Region which had around 85 stores, announced insolvency in 2017, with the bulk of locations taken by Magnit and Pyaterochka. Kamilla is a Tatarstan-based retailer which operated about 60 stores a year ago. Several months ago, it reportedly received multiple claims from suppliers totalling over RUB65mn and closed most of its stores, with locations likely to be taken by X5 or Auchan.
Ultimately, we expect Magnit and X5 to pursue a mix of M&A and organic expansion to keep the pressure on local chains over the next few years (albeit with a larger emphasis on M&A vs previous years). In our view, this should result in further market consolidation without significant dilution of traffic and sales densities, which should be positive for the medium-term returns and an improvement of the situation over the past two years.
11