


vk.com/id446425943

 The road ahead
In the year since KPMG International published its first Autonomous Vehicles Readiness Index, countries across the world have made rapid strides in preparing for an AV future.
Governments have been drafting new rules, companies have been testing their vehicles, the media has been analyzing the benefits and risks of adoption, and consumers have been considering their willingness to ride a driverless car.
In the exciting months and years to follow, many governments will be eager to ensure that the policy environment, investment-attractiveness, infrastructure-readiness and consumer acceptance keep pace with evolving technology. Through this report, KPMG International hopes to have provided insight on best practices for developing autonomous technology and what countries can do to improve in a number of areas.
The road ahead: key insights for governments
——Advanced AV markets could invest more in technology and innovation: Countries like the Netherlands and Singapore, which are already at the top of the index, could far outpace other countries if they focused on Pillar 2. In particular, investing in AV-related firms and R&D, industry partnerships, and an innovation-friendly business environment could cement their position at the top.
——Countries leading in technology and innovation could work on achieving greater policy and institutional clarity: The countries that are leading the world in technology and innovation — Germany, Israel, Japan, Norway and the US — have middling scores in their AV regulatory environment and institutions. Adapting and revisiting their regulations, and establishing an AVfocused institution could take these countries to the top of the rankings.
——Most countries that do well on infrastructure readiness should reform their policy and legislative environment: Six of the 10 countries that lead the world on infrastructure readiness (Pillar 3) — Australia, Austria, Japan, South Korea, Sweden and the UAE — do not feature in the top 10 of policy/legislative environment (Pillar 1). Since these countries have some of the more capital-intensive parameters like network connectivity, 4G coverage, and roads in place, to improve their positions, they could work on relatively low-hanging fruit like establishing AV regulations and institutions.
——Less-developed AV markets could take advantage of higher consumer interest in AVs if other areas, including policy and technology, are addressed: Countries with the lowest overall scores like Brazil, India, Mexico and Russia, have the highest scores in our new survey testing respondents’ willingness to ride in an AV.This is good news in the long term for AV manufacturers given the size of these consumer markets, but only if governments actively develop other areas.
402019 Autonomous Vehicles Readiness Index
©2019 KPMG International Cooperative (“KPMG International”). KPMG International provides no client services and is a Swiss entity with which the independent member firms of the KPMG network are affiliated.

vk.com/id446425943
Our role in your decisions
As AV technology evolves, stakeholders across sectors will have to strategically, flexibly and nimbly prepare for a transformation of the world as we know it.
——Transport authorities will develop and adapt governance and legislation to address complex themes like data security, safety, and the ethics of artificial intelligence.
——Infrastructure operators will grapple with an increasing pace of change and shorter planning horizons.
——Manufacturers will develop new operating models to be commercially viable.
——Investors will have to engage with new investment classes and design innovative value capture models.
——Consumers will come to understand a new transportation paradigm enabled by artificial intelligence.
KPMG member firms can help you explore your options and achieve your objectives. Our past and ongoing experience in the sector has prepared us to advise in the following areas.
——We help local, regional and national transport authorities and infrastructure providers develop and execute strategies to keep pace with AV disruption.
——We help local investment authorities identify and pitch to AV prospects for foreign direct investment.
——We help private sector companies and funds analyze and identify opportunities for investment and partnerships in the AV value chain.
——We produce cutting-edge research on AVs that enables a multitude of stakeholders to understand the dynamic and uncertain space.
About KPMG
KPMG’s Global Public Sector Transport network works with public transport authorities to embrace emerging technologies to help increase capacity, optimize asset life cycle and leverage existing data. We help governments and transport providers to understand and shape the future of public transport, while supporting them in improving the experiences of customers today.
We understand that clients need to enhance their performance while cutting costs and using existing assets, and we support them through realizing the value of their land and increasing ancillary revenues, such as from digital advertising. Our teams also support them in helping to maximize opportunities from disruptive technologies including EVs mobility-as-a-service, service, smart assets and transport systems, data and analytics.
For more information, visit kpmg.com/publictransport.
KPMG’s Global Government & Public Sector practice works to deliver meaningful results through a deep understanding of the issues, an appreciation of how the public sector works, and global and local insight into the cultural, social and political pressures facing governments today. Our network of professionals, many of whom have held senior public sector roles, consistently strive to combine their practical, hands-on experience with insight from our global network to help our industry clients implement transformational strategies, economically, efficiently and effectively. We understand the continuing impact of innovation and disruption on governments as they search for more efficient ways to deploy technology to empower change within their organizations. For further information, please visit us online at kpmg.com/government.
2019 Autonomous Vehicles Readiness Index 41
© 2019 KPMG International Cooperative (“KPMG International”). KPMG International provides no client services and is a Swiss entity with which the independent member firms of the KPMG network are affiliated.

vk.com/id446425943

 Appendix: Results
and methodology
The 25 countries have been assessed on
25 different measures, gathered into four pillars. Four measures are scored for this index by KPMG International and ESI ThoughtLab, which used publicly available information, including media reports, press releases and other material. One measure uses a consumer survey carried out
by Branded Research in each of the countries.
A further 20 variables draw on existing research by KPMG International and other organizations.
The variables under the four pillars are combined to arrive at an aggregate score for each. All variables are given equal weight in arriving at the overall pillar score. Before the data is combined it is normalized, as the variables have different measurement units, using the min-max method. This converts the variables to a range between zero and one, by subtracting the minimum value and dividing by the range of the variable values.
Therefore the top-ranked country receives one and the bottom country zero.
Pillars have differing number of variables, so each pillar score is scaled to give them the same maximum possible value. This means that each
pillar has equal weight in the overall score for each country.
ESI ThoughtLab

422019 Autonomous Vehicles Readiness Index
©2019 KPMG International Cooperative (“KPMG International”). KPMG International provides no client services and is a Swiss entity with which the independent member firms of the KPMG network are affiliated.
vk.com/id446425943
2019 Autonomous Vehicles Readiness Index 43
© 2019 KPMG International Cooperative (“KPMG International”). KPMG International provides no client services and is a Swiss entity with which the independent member firms of the KPMG network are affiliated.

vk.com/id446425943


 Policy and legislation
Overview
——Singapore leads this pillar overall and gains the highest scores on five of its seven measures, including a World Economic Forum assessment of effectiveness of lawmaking bodies and
a KPMG measure of government change readiness.
——Singapore also shares the top rating in an assessment of its AV regulations with Australia, Finland and the Netherlands, and for having
a single government entity for AV work with Hungary.
——Along with Canada, the Czech Republic and South Korea, Singapore also gains top marks in the assessment of government-funded AV pilots.
——The UK, second-placed in this pillar, leads on a new measure assessing the data-sharing environment, added as such sharing enables
greater collaboration between government and companies in AV development.
Methodology
The pillar is calculated from seven equally weighted factors, one of which is new for the 2019 edition of the index.
AV regulations, government-funded AV pilots and
AV-focused agency: each of these three factors is scored out of seven for this index based on a review of media articles, government press releases and government regulations.
On AV regulations, countries that have regulations that are supportive of AV use and place few restrictions on when, where and how testing of AVs may occur are scored higher and countries that place greater restrictions on testing are scored lower. The maximum score is awarded to Australia, Finland, Singapore and the Netherlands. The lowest scores go to Mexico, then Brazil and India.
A similar approach is taken for government-funded AV pilots. The maximum score is awarded to Canada, the Czech Republic, Singapore and South Korea. Brazil and Mexico receive the minimum score, followed by India and Russia.
With the AV-focused agency variable, governments that spread the responsibility for AVs across a large number of government entities are given lower marks; those that take the most common approach, of placing responsibility in an existing agency, gain middling marks; and those establishing an AV or transportation technology and innovation-focused agency that has sole responsibility gain the highest marks. As well as providing innovators with a single point of contact, such focus demonstrates a government’s commitment. Hungary and Singapore are awarded maximum marks, followed by Austria, New Zealand and the UAE. India gets the minimum score, followed by Brazil and Mexico.
Government readiness for change: scores are based on KPMG International’s 2017 Change readiness index, updated for 2018.127 This is
a composite index that assesses regulation, government strategic planning and the rule of law among other measures. Singapore, the UAE and Sweden receive the highest scores and Brazil, Mexico and Russia the lowest.
Effectiveness of legislative process and efficiency of the legal system in challenging regulations: both from the World Economic Forum’s Networked Readiness Index for 2018, as judged by business executives in each country.128 The effectiveness
of the legislative process is included to measure a country’s ability to pass regulations necessary for the development of AVs. Singapore, New Zealand and the UK gain the highest scores, while Brazil, Mexico and South Korea receive the lowest.
The measure on challenging regulations through the legal system is included to gauge the ability of AV manufacturers and others to challenge unfavorable government rules. On this, Finland, the US and New Zealand receive the highest scores while Hungary, Brazil and the Czech Republic get the lowest ones.
Data-sharing environment: from the World Wide Web Foundation’s Open data barometer for 2016, the latest edition which covers all 25 AVRI countries.129 Countries adopting open and shared data approaches score higher, as this enables greater collaboration between government and
private industry to encourage AV development. The UK, Canada and France rank highest while China, Hungary and the UAE rank lowest.
442019 Autonomous Vehicles Readiness Index
©2019 KPMG International Cooperative (“KPMG International”). KPMG International provides no client services and is a Swiss entity with which the independent member firms of the KPMG network are affiliated.
vk.com/id446425943
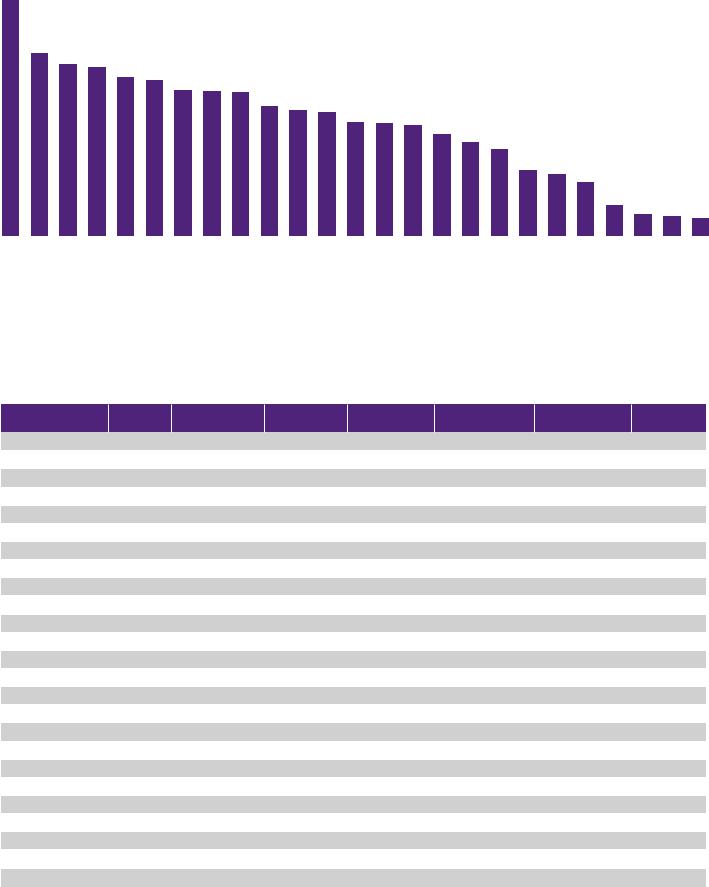
Pillar 1: aggregate scores by country
7.85 |
7.60 |
|
|
|
|
|
|
|
|
|
|
|
|
|
|
|
|
|
|
|
|
|
|
|
|
7.53 |
|
|
|
|
|
|
|
|
|
|
|
|
|
|
|
|
|
|
|
|
|
|
|
|
|
7.30 |
7.27 |
|
|
|
|
|
|
|
|
|
|
|
|
|
|
|
|
|
|
|
|
|
|
|
|
|
|
|
|
|
|
|
|
|
|
|
|
|
|
|
|
|
|
|
|
||
|
|
|
|
|
6.92 |
6.90 |
6.82 |
6.65 |
6.63 |
|
|
|
|
|
|
|
|
|
|
|
|
|
|
|
|
|
|
|
|
|
|
|
|
|
|
|
|
|
|
|
|
|
|
|
|
|
|||
|
|
|
|
|
|
|
|
6.41 |
|
|
|
|
|
|
|
|
|
|
|
|
|
|
||
|
|
|
|
|
|
|
|
|
|
6.24 |
6.23 |
|
|
|
|
|
|
|
|
|
|
|
|
|
|
|
|
|
|
|
|
|
|
|
|
6.12 |
|
|
|
|
|
|
|
|
|
|
|
||
|
|
|
|
|
|
|
|
|
|
|
|
|
|
|
|
|
|
|
|
|
|
|
|
|
|
|
|
|
|
|
|
|
|
|
|
|
|
|
5.74 |
5.71 |
|
|
|
|
|
|
|
|
|
|
|
|
|
|
|
|
|
|
|
|
|
|
|
|
|
4.88 |
4.84 |
4.79 |
|
|
|
|
|
|
|
|
|
|
|
|
|
|
|
|
|
|
|
|
|
|
|
|
|
|
|
|
|
|
|
|
|
|
|
|
|
|
|
|
|
|
|
|
|
|
|
|
|
|
4.44 |
|
|
|
|
|
|
|
|
|
|
|
|
|
|
|
|
|
|
|
|
|
|
|
|
|
3.89 |
|
|
|
|
|
|
|
|
|
|
|
|
|
|
|
|
|
|
|
|
|
|
|
|
|
3.37 |
|
|
|
|
|
|
|
|
|
|
|
|
|
|
|
|
|
|
|
|
|
|
|
|
|
2.50 |
|
|
|
|
|
|
|
|
|
|
|
|
|
|
|
|
|
|
|
|
|
|
|
|
|
1.71 |
|
|
|
|
|
|
|
|
|
|
|
|
|
|
|
|
|
|
|
|
|
|
|
|
|
1.23 |
Singapore |
United Kingdom |
New Zealand |
Finland |
The Netherlands |
Germany |
Norway |
Canada |
United States |
Sweden |
United Arab Emirates |
Australia |
Austria |
France |
Japan |
South Korea |
Czech Republic |
Israel |
Spain |
China |
Hungary |
Russia |
India |
Mexico |
Brazil |
Pillar 1: (Policy and legislation) normalized indicator values by country
|
Country |
AV |
AV department |
|
KPMG Change |
|
WEF — |
|
WEF — Efficiency |
|
Number of |
|
Assessment of |
|
|
|
regulations |
within government |
|
Readiness |
|
Effectiveness of |
|
of the legal system |
|
government-funded |
|
the data-sharing |
|
|
|
|
transportation dept. |
|
Government |
|
lawmaking bodies |
|
in challenging |
|
AV pilots |
|
environment |
|
|
|
|
|
|
Capability pillar |
|
|
|
regulations |
|
|
|
|
|
|
Singapore |
|
1.000 |
|
1.000 |
|
1.000 |
|
0.697 |
|
1.000 |
|
0.411 |
|
|
1.000 |
|
|
|
|
|
|
|||||||
|
|
|
|
|
|
|
|
|
|
|
|
|
|
|
|
United Kingdom |
0.917 |
0.857 |
|
0.673 |
|
0.847 |
|
0.781 |
|
0.833 |
|
1.000 |
|
|
|
|
|
|
|
|
|
|
|
|
|
|
|
|
|
New Zealand |
0.917 |
0.929 |
|
0.845 |
|
0.882 |
|
0.874 |
|
0.667 |
|
0.743 |
|
|
|
|
|
|
|
|
|
|
|
|
|
|
|
|
|
Finland |
1.000 |
0.714 |
|
0.892 |
|
0.786 |
|
1.000 |
|
0.833 |
|
0.451 |
|
|
|
|
|
|
|
|
|
|
|
|
|
|
|
|
|
The Netherlands |
1.000 |
0.714 |
|
0.766 |
|
0.732 |
|
0.837 |
|
0.917 |
|
0.688 |
|
|
|
|
|
|
|
|
|
|
|
|
|
|
|
|
|
Germany |
0.750 |
0.857 |
|
0.778 |
|
0.679 |
|
0.867 |
|
0.833 |
|
0.621 |
|
|
|
|
|
|
|
|
|
|
|
|
|
|
|
|
|
Norway |
0.917 |
0.643 |
|
0.856 |
|
0.792 |
|
0.654 |
|
0.833 |
|
0.674 |
|
|
|
|
|
|
|
|
|
|
|
|
|
|
|
|
|
Canada |
0.750 |
0.714 |
|
0.622 |
|
0.732 |
|
0.617 |
|
1.000 |
|
0.870 |
|
|
|
|
|
|
|
|
|
|
|
|
|
|
|
|
|
United States |
0.833 |
0.714 |
|
0.527 |
|
0.422 |
|
0.986 |
|
0.917 |
|
0.771 |
|
|
|
|
|
|
|
|
|
|
|
|
|
|
|
|
|
Sweden |
0.667 |
0.714 |
|
0.968 |
|
0.785 |
|
0.730 |
|
0.667 |
|
0.625 |
|
|
|
|
|
|
|
|
|
|
|
|
|
|
|
|
|
United Arab Emirates |
0.833 |
0.929 |
|
0.990 |
|
0.748 |
|
0.739 |
|
0.667 |
|
0.081 |
|
|
|
|
|
|
|
|
|
|
|
|
|
|
|
|
|
Australia |
1.000 |
0.714 |
|
0.663 |
|
0.622 |
|
0.592 |
|
0.500 |
|
0.765 |
|
|
|
|
|
|
|
|
|
|
|
|
|
|
|
|
|
Austria |
0.833 |
0.929 |
|
0.648 |
|
0.456 |
|
0.518 |
|
0.833 |
|
0.629 |
|
|
|
|
|
|
|
|
|
|
|
|
|
|
|
|
|
France |
0.750 |
0.714 |
|
0.480 |
|
0.624 |
|
0.545 |
|
0.833 |
|
0.815 |
|
|
|
|
|
|
|
|
|
|
|
|
|
|
|
|
|
Japan |
0.333 |
0.571 |
|
0.537 |
|
0.780 |
|
0.720 |
|
0.833 |
|
0.691 |
|
|
|
|
|
|
|
|
|
|
|
|
|
|
|
|
|
South Korea |
0.833 |
0.857 |
|
0.380 |
|
0.216 |
|
0.391 |
|
1.000 |
|
0.766 |
|
|
|
|
|
|
|
|
|
|
|
|
|
|
|
|
|
Czech Republic |
0.833 |
0.714 |
|
0.484 |
|
0.231 |
|
0.225 |
|
1.000 |
|
0.309 |
|
|
|
|
|
|
|
|
|
|
|
|
|
|
|
|
|
Israel |
0.667 |
0.643 |
|
0.435 |
|
0.364 |
|
0.572 |
|
0.750 |
|
0.331 |
|
|
|
|
|
|
|
|
|
|
|
|
|
|
|
|
|
Spain |
0.833 |
0.714 |
|
0.341 |
|
0.425 |
|
0.245 |
|
0.500 |
|
0.668 |
|
|
|
|
|
|
|
|
|
|
|
|
|
|
|
|
|
China |
0.500 |
0.643 |
|
0.367 |
|
0.460 |
|
0.564 |
|
0.917 |
|
0.000 |
|
|
|
|
|
|
|
|
|
|
|
|
|
|
|
|
|
Hungary |
0.583 |
1.000 |
|
0.232 |
|
0.330 |
|
0.000 |
|
0.833 |
|
0.046 |
|
|
|
|
|
|
|
|
|
|
|
|
|
|
|
|
|
Russia |
0.500 |
0.857 |
|
0.133 |
|
0.304 |
|
0.302 |
|
0.167 |
|
0.360 |
|
|
|
|
|
|
|
|
|
|
|
|
|
|
|
|
|
India |
0.167 |
0.000 |
|
0.221 |
|
0.417 |
|
0.682 |
|
0.167 |
|
0.288 |
|
|
|
|
|
|
|
|
|
|
|
|
|
|
|
|
|
Mexico |
0.000 |
0.143 |
|
0.093 |
|
0.200 |
|
0.225 |
|
0.000 |
|
0.670 |
|
|
|
|
|
|
|
|
|
|
|
|
|
|
|
|
|
Brazil |
0.167 |
0.143 |
|
0.000 |
|
0.000 |
|
0.157 |
|
0.000 |
|
0.488 |
|
|
Source: KPMG International, 2019 |
|
|
|
|
|
|
|
|
|
|
|
|
|
|
|
|
|
|
|
|
|
|
2019 Autonomous Vehicles Readiness Index |
45 |
||||
© 2019 KPMG International Cooperative (“KPMG International”). KPMG International provides no client services and is a Swiss entity with which the independent member firms of the KPMG network are affiliated.

vk.com/id446425943


 Technology and
innovation
Overview
——Israel is the clear leader with the top scores for industry partnerships, AV company headquarters and AV investments, all adjusted for population.
——Japan leads on number of AV-related patents, with data from PatSeer to August 2018 finding 5,272, followed by the US with 4,476 and China with 3,548. Japan also has the most patents per capita, the measure used in the index.
——The World Economic Forum finds that Finland has the best availability of the latest technology and the US has the best capacity for innovation.
——Norway has by far the highest market share for EVs of more than 39 percent. EVs are a precursor for AVs, which are expected to be mostly electric.
Methodology
The pillar is calculated from seven equally weighted factors, two fewer than in the 2018 AVRI.
Industry partnerships: the measure is scored out of seven for this index, based on a review of news coverage from local and global media, research from consulting firms and blogs maintained by
AV industry experts. The rapid and disruptive nature of AV technology has made partnerships between vehicle makers and technology suppliers essential, and many have been formed recently. Those countries that are home to companies that have established a large number of partnerships are given higher scores. Canada, Germany, Israel, South Korea and the US all gain the maximum score while Mexico scores the lowest, followed by Brazil, India and Russia.
AV technology firm headquarters: based on a list of AV-related technology companies built from those published by Vision System Intelligence130 and Comet Labs,131 updated for this edition with data from Crunchbase Pro on AV companies founded since the 2018 report.132 The US has the highest number of headquarters at 258 followed by the UK with 39 and Germany with 26. Numbers
are scaled by national population for the index, with the result that Israel, Finland and Sweden gain the highest scores and Czech Republic, Mexico, New Zealand and the UAE are ranked lowest.
AV-related patents: this measure uses data from PatSeer133 on all AV-related patents and patent applications made by August 2018 for the
25 countries. Numbers are scaled by national populations, and on this basis Japan, South Korea and Germany score highest while the Czech Republic, Singapore and the UAE all get the minimum score.
Industry investments in AV: using data from Crunchbase Pro covering investments since 2007, this measure is based on the countries of investing organizations, rather than where the investment is made. Again, this is scaled by national populations. The leading countries for investment on a per capita basis are Israel, Norway and the US while the Czech Republic, Finland, Hungary, Mexico, New Zealand and the UAE all get the minimum score.
Availability of the latest technology and capacity for innovation: both from the World Economic Forum’s Networked readiness index, based on responses from business executives.134 They judge that Finland, Norway and Israel have the greatest access to the latest technologies and so receive the highest scores while Russia, China and Brazil have the lowest. Executives see the US, Sweden and Israel as having the greatest capacities for innovation and Hungary, Brazil and Mexico as having the least.
Market share of electric cars: data for most countries comes from the International Energy Agency’s Global EV outlook 2018 135 while information for other countries is gathered from country-specific data sources. Countries are scored more highly for bigger market shares for EVs, given that most AVs will be electric. Norway, Sweden and the Netherlands rank highest, while the Czech Republic, Hungary, Israel and Russia all get the minimum score.
462019 Autonomous Vehicles Readiness Index
©2019 KPMG International Cooperative (“KPMG International”). KPMG International provides no client services and is a Swiss entity with which the independent member firms of the KPMG network are affiliated.
vk.com/id446425943
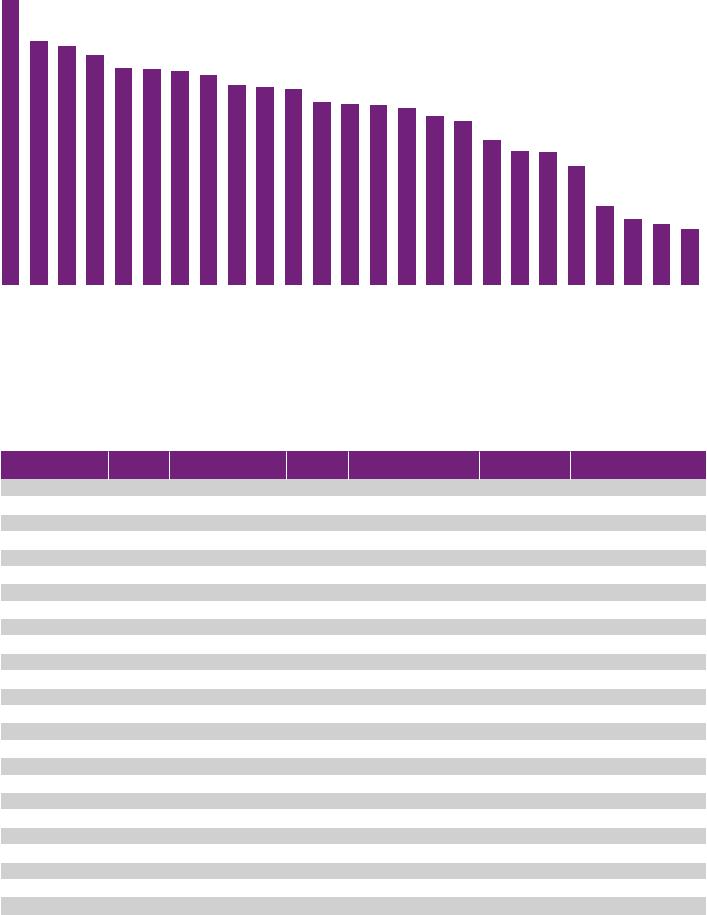
Pillar 2: aggregate scores by country
6.38 |
|
|
|
|
|
|
|
|
|
|
|
|
|
|
|
|
|
|
|
|
|
|
|
|
|
4.94 |
4.65 |
|
|
|
|
|
|
|
|
|
|
|
|
|
|
|
|
|
|
|
|
|
|
|
|
4.56 |
|
|
|
|
|
|
|
|
|
|
|
|
|
|
|
|
|
|
|
|
|
|
|
|
|
4.28 |
|
|
|
|
|
|
|
|
|
|
|
|
|
|
|
|
|
|
|
|
|
|
|
|
|
4.20 |
|
|
|
|
|
|
|
|
|
|
|
|
|
|
|
|
|
|
|
|
|
|
|
|
|
3.92 |
3.91 |
|
|
|
|
|
|
|
|
|
|
|
|
|
|
|
|
|
|
|
|
|
|
|
|
3.87 |
|
|
|
|
|
|
|
|
|
|
|
|
|
|
|
|
||
|
|
|
|
|
|
|
|
|
3.49 |
3.38 |
3.34 |
|
|
|
|
|
|
|
|
|
|
|
|
|
|
|
|
|
|
|
|
|
|
|
3.06 |
|
|
|
|
|
|
|
|
|
|
|
|
||
|
|
|
|
|
|
|
|
|
|
|
|
3.04 |
2.99 |
2.74 |
|
|
|
|
|
|
|
|
|
|
|
|
|
|
|
|
|
|
|
|
|
|
|
|
|
2.52 |
|
|
|
|
|
|
|
|
|
|
|
|
|
|
|
|
|
|
|
|
|
|
|
|
|
2.32 |
|
|
|
|
|
|
|
|
|
|
|
|
|
|
|
|
|
|
|
|
|
|
|
|
|
|
|
|
|
|
|
|
|
|
|
|
|
|
|
|
|
|
|
|
|
|
|
|
|
|
|
1.77 |
1.65 |
|
|
|
|
|
|
|
|
|
|
|
|
|
|
|
|
|
|
|
|
|
|
|
|
1.44 |
|
|
|
|
|
|
|
|
|
|
|
|
|
|
|
|
|
|
|
|
|
|
|
|
|
|
|
|
|
|
|
|
|
|
|
|
|
|
|
|
|
|
|
|
|
|
|
|
|
|
|
0.80 |
0.55 |
|
|
|
|
|
|
|
|
|
|
|
|
|
|
|
|
|
|
|
|
|
|
|
|
0.50 |
0.46 |
|
Israel |
Norway |
United States |
Germany |
Japan |
Sweden |
South Korea |
Finland |
United Kingdom |
The Netherlands |
Canada |
France |
Austria |
United Arab Emirates |
Singapore |
New Zealand |
Australia |
Czech Republic |
China |
Spain |
Hungary |
India |
Mexico |
Russia |
Brazil |
Pillar 2: (Technology and innovation) normalized indicator values by country
|
Country |
Industry |
AV tech firm HQ |
|
AV-related patents |
|
Investment in |
|
WEF — Availability of |
|
WEF — Capacity for |
|
Market share of |
|
|
|
partnerships |
|
|
|
|
AV-related firms |
|
the latest technology |
|
innovation |
|
electric cars |
|
|
Israel |
|
1.000 |
|
0.045 |
|
1.000 |
|
0.946 |
|
0.968 |
|
0.000 |
|
|
1.000 |
|
|
|
|
|
|
|||||||
|
|
|
|
|
|
|
|
|
|
|
|
|
|
|
|
Norway |
0.917 |
0.126 |
|
0.009 |
|
0.155 |
|
0.971 |
|
0.662 |
|
1.000 |
|
|
|
|
|
|
|
|
|
|
|
|
|
|
|
|
|
United States |
1.000 |
0.176 |
|
0.340 |
|
0.141 |
|
0.931 |
|
1.000 |
|
0.031 |
|
|
|
|
|
|
|
|
|
|
|
|
|
|
|
|
|
Germany |
1.000 |
0.069 |
|
0.752 |
|
0.030 |
|
0.751 |
|
0.901 |
|
0.041 |
|
|
|
|
|
|
|
|
|
|
|
|
|
|
|
|
|
Japan |
0.833 |
0.029 |
|
1.000 |
|
0.009 |
|
0.843 |
|
0.588 |
|
0.026 |
|
|
|
|
|
|
|
|
|
|
|
|
|
|
|
|
|
Sweden |
0.750 |
0.179 |
|
0.214 |
|
0.124 |
|
0.937 |
|
0.904 |
|
0.161 |
|
|
|
|
|
|
|
|
|
|
|
|
|
|
|
|
|
South Korea |
1.000 |
0.043 |
|
0.863 |
|
0.040 |
|
0.633 |
|
0.438 |
|
0.033 |
|
|
|
|
|
|
|
|
|
|
|
|
|
|
|
|
|
Finland |
0.917 |
0.199 |
|
0.044 |
|
0.000 |
|
1.000 |
|
0.813 |
|
0.066 |
|
|
|
|
|
|
|
|
|
|
|
|
|
|
|
|
|
United Kingdom |
0.833 |
0.130 |
|
0.246 |
|
0.123 |
|
0.855 |
|
0.778 |
|
0.043 |
|
|
|
|
|
|
|
|
|
|
|
|
|
|
|
|
|
The Netherlands |
0.667 |
0.129 |
|
0.016 |
|
0.071 |
|
0.907 |
|
0.855 |
|
0.069 |
|
|
|
|
|
|
|
|
|
|
|
|
|
|
|
|
|
Canada |
1.000 |
0.109 |
|
0.097 |
|
0.034 |
|
0.782 |
|
0.576 |
|
0.028 |
|
|
|
|
|
|
|
|
|
|
|
|
|
|
|
|
|
France |
0.833 |
0.044 |
|
0.119 |
|
0.044 |
|
0.735 |
|
0.780 |
|
0.043 |
|
|
|
|
|
|
|
|
|
|
|
|
|
|
|
|
|
Austria |
0.667 |
0.050 |
|
0.131 |
|
0.046 |
|
0.685 |
|
0.797 |
|
0.004 |
|
|
|
|
|
|
|
|
|
|
|
|
|
|
|
|
|
United Arab Emirates |
0.833 |
0.000 |
|
0.000 |
|
0.000 |
|
0.787 |
|
0.713 |
|
0.028 |
|
|
|
|
|
|
|
|
|
|
|
|
|
|
|
|
|
Singapore |
0.833 |
0.039 |
|
0.000 |
|
0.073 |
|
0.771 |
|
0.606 |
|
0.002 |
|
|
|
|
|
|
|
|
|
|
|
|
|
|
|
|
|
New Zealand |
0.667 |
0.000 |
|
0.026 |
|
0.000 |
|
0.743 |
|
0.666 |
|
0.028 |
|
|
|
|
|
|
|
|
|
|
|
|
|
|
|
|
|
Australia |
0.500 |
0.055 |
|
0.184 |
|
0.068 |
|
0.576 |
|
0.573 |
|
0.003 |
|
|
|
|
|
|
|
|
|
|
|
|
|
|
|
|
|
Czech Republic |
0.750 |
0.000 |
|
0.000 |
|
0.000 |
|
0.543 |
|
0.509 |
|
0.000 |
|
|
|
|
|
|
|
|
|
|
|
|
|
|
|
|
|
China |
0.750 |
0.005 |
|
0.062 |
|
0.005 |
|
0.023 |
|
0.310 |
|
0.056 |
|
|
|
|
|
|
|
|
|
|
|
|
|
|
|
|
|
Spain |
0.500 |
0.009 |
|
0.029 |
|
0.017 |
|
0.462 |
|
0.257 |
|
0.010 |
|
|
|
|
|
|
|
|
|
|
|
|
|
|
|
|
|
Hungary |
0.667 |
0.067 |
|
0.017 |
|
0.000 |
|
0.371 |
|
0.000 |
|
0.000 |
|
|
|
|
|
|
|
|
|
|
|
|
|
|
|
|
|
India |
0.167 |
0.003 |
|
0.002 |
|
0.002 |
|
0.121 |
|
0.322 |
|
0.002 |
|
|
|
|
|
|
|
|
|
|
|
|
|
|
|
|
|
Mexico |
0.000 |
0.000 |
|
0.008 |
|
0.000 |
|
0.269 |
|
0.146 |
|
0.001 |
|
|
|
|
|
|
|
|
|
|
|
|
|
|
|
|
|
Russia |
0.167 |
0.002 |
|
0.036 |
|
0.003 |
|
0.000 |
|
0.180 |
|
0.000 |
|
|
|
|
|
|
|
|
|
|
|
|
|
|
|
|
|
Brazil |
0.167 |
0.001 |
|
0.009 |
|
0.002 |
|
0.046 |
|
0.136 |
|
0.001 |
|
|
|
|
|
|
|
|
|
|
|
|
|
|
|
|
Source: KPMG International, 2019
2019 Autonomous Vehicles Readiness Index 47
© 2019 KPMG International Cooperative (“KPMG International”). KPMG International provides no client services and is a Swiss entity with which the independent member firms of the KPMG network are affiliated.

vk.com/id446425943


 Infrastructure
Overview
——The Netherlands leads on infrastructure through having the most EV charging stations scaled
by the size of its road network, as well as consistently high scores on the other measures.
——Singapore tops a measure of high-performance mobile network coverage from the GSM Association, while South Korea has the most extensive 4G coverage, with connectivity being essential for AVs.
——The UAE has the best-quality roads as assessed by the World Economic Forum, and leads on the change readiness of its technology infrastructure. Germany scores highest on a World Bank measure of road infrastructure focused on logistics and trucking.
Methodology
The pillar is calculated from six equally weighted factors, unchanged from the 2018 index.
Density of EV charging stations: data for most countries is from the International Energy Agency’s
Global EV outlook 2018 136 while information for other countries is gathered from the US Bureau of Transportation Statistics137 and country-specific data sources. Numbers of chargers are scaled by length of paved roads in each country, using data from the CIA’s World factbook.138 As most AVs are likely to be EVs, their adoption will require the availability
of electric charging stations, so countries with a higher density of charging stations score more. The highest-scoring countries are the Netherlands, Norway and South Korea, while the lowest are India, Brazil and Russia.
Quality of mobile internet: a measure of mobile internet infrastructure assessed by the GSM Association, which represents mobile network operators. The measure awards availability of highperformance mobile internet network coverage, speed, the number of servers and network bandwidth, given AVs need to receive and transmit data.139 Singapore, Norway and Australia have the highest connectivity infrastructure scores while India, Russia and Mexico have the lowest.
4G coverage: based on data from researcher OpenSignal, this measure is included to reflect the importance to AVs of wide access to mobile data networks.140 Most countries are developing much-faster 5G networks, but so far only a few test networks are in place. South Korea, Japan and Norway have the most extensive 4G coverage while Brazil, Israel and Russia have the least.
Quality of roads: from the World Economic Forum’s Global competiveness report, assessed by business executives in each country.141 AVs will work better on high-quality roads and their absence will limit a country’s adoption of them. The UAE, Singapore and the Netherlands have the best roads on this measure while Brazil, Russia and Hungary have the worst.
Logistics infrastructure: this measure considers the quality of roads specifically for logistics, using the World Bank’s Logistic performance index 2018.142 It is included as freight is likely to be one of the first users of AVs. Germany, Japan and Sweden have the highest quality road infrastructure from a logistics perspective while Russia, Mexico and India have the lowest.
Technology infrastructure change readiness: scores are based on KPMG International’s 2017 Change readiness index, updated for 2018.143 This measures the quality of the country’s technology infrastructure, using a number of indicators, providing an additional measure of the technology infrastructure that will help support the use of AVs. The UAE, Singapore and the Netherlands lead this measure, with India, Mexico and China scoring least.
482019 Autonomous Vehicles Readiness Index
©2019 KPMG International Cooperative (“KPMG International”). KPMG International provides no client services and is a Swiss entity with which the independent member firms of the KPMG network are affiliated.
vk.com/id446425943
Pillar 3: aggregate scores by country
7.72 |
|
|
|
|
|
|
|
|
|
|
|
|
|
|
|
|
|
|
|
|
|
|
|
|
|
6.62 |
6.48 |
6.23 |
|
|
|
|
|
|
|
|
|
|
|
|
|
|
|
|
|
|
|
|
|
|
|
|
|
|
|
|
|
|
|
|
|
|
|
|
|
|
|
|
|
|
|
|
|
|
|
|
|
|
5.88 |
5.84 |
5.80 |
5.69 |
|
|
|
|
|
|
|
|
|
|
|
|
|
|
|
|
|
|
|
|
|
|
|
|
5.41 |
|
|
|
|
|
|
|
|
|
|
|
|
|
|
|
|
|
|
|
|
|
|
|
|
|
5.36 |
5.30 |
|
|
|
|
|
|
|
|
|
|
|
|
|
|
|
|
|
|
|
|
|
|
|
|
|
|
4.94 |
4.91 |
4.87 |
4.79 |
|
|
|
|
|
|
|
|
|
|
|
|
|
|
|
|
|
|
|
|
|
|
|
|
4.57 |
|
|
|
|
|
|
|
|
|
|
|
|
|
|
|
|
|
|
|
|
|
|
|
|
|
4.43 |
|
|
|
|
|
|
|
|
|
|
|
|
|
|
|
|
|
|
|
|
|
|
|
|
|
|
3.93 |
|
|
|
|
|
|
|
|
|
|
|
|
|
|
|
|
|
|
|
|
|
|
|
|
|
3.63 |
3.60 |
|
|
|
|
|
|
|
|
|
|
|
|
|
|
|
|
|
|
|
|
|
|
|
|
|
3.21 |
|
|
|
|
|
|
|
|
|
|
|
|
|
|
|
|
|
|
|
|
|
|
|
|
|
2.13 |
|
|
|
|
|
|
|
|
|
|
|
|
|
|
|
|
|
|
|
|
|
|
|
|
|
1.78 |
1.63 |
1.51 |
|
|
|
|
|
|
|
|
|
|
|
|
|
|
|
|
|
|
|
|
|
|
|
||
|
|
|
|
|
|
|
|
|
|
|
|
|
|
|
|
|
|
|
|
|
|
|
|
|
The Netherlands |
Singapore |
Japan |
South Korea |
United Arab Emirates |
Sweden |
Norway |
United States |
Australia |
Austria |
Finland |
United Kingdom |
Germany |
Spain |
France |
Canada |
New Zealand |
China |
Czech Republic |
Hungary |
Israel |
Mexico |
India |
Russia |
Brazil |
Pillar 3: (Infrastructure) normalized indicator values by country
Country |
EV charging |
GSMA global connectivity |
4G coverage |
Quality of roads from the WEF |
|
LPI infrastructure |
KPMG change readiness |
|
|
stations |
index — Infrastructure |
|
global competiveness index |
|
score |
technology infrastructure score |
|
|
|
|
|
|
|
|
|
|
The Netherlands |
1.000 |
0.772 |
0.756 |
0.933 |
|
0.899 |
0.784 |
|
|
|
|
|
|
|
|
|
|
Singapore |
0.090 |
1.000 |
0.640 |
0.994 |
|
0.805 |
0.882 |
|
|
|
|
|
|
|
|
|
|
Japan |
0.121 |
0.690 |
0.923 |
0.875 |
|
0.925 |
0.784 |
|
|
|
|
|
|
|
|
|
|
South Korea |
0.256 |
0.747 |
1.000 |
0.766 |
|
0.597 |
0.784 |
|
|
|
|
|
|
|
|
|
|
United Arab Emirates |
0.102 |
0.549 |
0.488 |
1.000 |
|
0.780 |
1.000 |
|
|
|
|
|
|
|
|
|
|
Sweden |
0.121 |
0.725 |
0.719 |
0.745 |
|
0.918 |
0.667 |
|
|
|
|
|
|
|
|
|
|
Norway |
0.523 |
0.887 |
0.853 |
0.445 |
|
0.572 |
0.588 |
|
|
|
|
|
|
|
|
|
|
United States |
0.044 |
0.649 |
0.780 |
0.445 |
|
0.799 |
0.706 |
|
|
|
|
|
|
|
|
|
|
Australia |
0.005 |
0.862 |
0.696 |
0.508 |
|
0.748 |
0.784 |
|
|
|
|
|
|
|
|
|
|
Austria |
0.039 |
0.675 |
0.396 |
0.835 |
|
0.881 |
0.745 |
|
|
|
|
|
|
|
|
|
|
Finland |
0.008 |
0.806 |
0.594 |
0.653 |
|
0.767 |
0.706 |
|
|
|
|
|
|
|
|
|
|
United Kingdom |
0.143 |
0.678 |
0.268 |
0.637 |
|
0.786 |
0.784 |
|
|
|
|
|
|
|
|
|
|
Germany |
0.157 |
0.700 |
0.122 |
0.709 |
|
1.000 |
0.588 |
|
|
|
|
|
|
|
|
|
|
Spain |
0.005 |
0.621 |
0.620 |
0.749 |
|
0.667 |
0.588 |
|
|
|
|
|
|
|
|
|
|
France |
0.064 |
0.643 |
0.195 |
0.857 |
|
0.767 |
0.667 |
|
|
|
|
|
|
|
|
|
|
Canada |
0.058 |
0.747 |
0.583 |
0.638 |
|
0.610 |
0.412 |
|
|
|
|
|
|
|
|
|
|
New Zealand |
0.007 |
0.819 |
0.216 |
0.482 |
|
0.761 |
0.667 |
|
|
|
|
|
|
|
|
|
|
China |
0.220 |
0.569 |
0.529 |
0.454 |
|
0.610 |
0.235 |
|
|
|
|
|
|
|
|
|
|
Czech Republic |
0.057 |
0.590 |
0.721 |
0.268 |
|
0.428 |
0.353 |
|
|
|
|
|
|
|
|
|
|
Hungary |
0.062 |
0.593 |
0.773 |
0.252 |
|
0.308 |
0.412 |
|
|
|
|
|
|
|
|
|
|
Israel |
0.033 |
0.406 |
0.094 |
0.574 |
|
0.346 |
0.686 |
|
|
|
|
|
|
|
|
|
|
Mexico |
0.046 |
0.294 |
0.433 |
0.429 |
|
0.044 |
0.176 |
|
|
|
|
|
|
|
|
|
|
India |
0.000 |
0.000 |
0.690 |
0.413 |
|
0.082 |
0.000 |
|
|
|
|
|
|
|
|
|
|
Russia |
0.003 |
0.187 |
0.105 |
0.067 |
|
0.000 |
0.725 |
|
|
|
|
|
|
|
|
|
|
Brazil |
0.003 |
0.420 |
0.000 |
0.000 |
|
0.094 |
0.490 |
|
Source: KPMG International, 2019 |
|
|
|
|
|
|
|
|
|
|
|
|
|
2019 Autonomous Vehicles Readiness Index |
49 |
||
© 2019 KPMG International Cooperative (“KPMG International”). KPMG International provides no client services and is a Swiss entity with which the independent member firms of the KPMG network are affiliated.

vk.com/id446425943


 Consumer
acceptance
Overview
——Singapore scores highest overall, partly due to all of the city-state’s population living in an AV test area.
——Indians, closely followed by Mexicans, are the most accepting of AVs according to research carried out for this report with 100 people in each of the 25 countries. Britons then Americans are the least accepting.
——Sweden leads on technology change readiness, based on KPMG research, with the Netherlands leading a World Economic Forum index on technology readiness.
——China leads on market penetration of ride-hailing, followed by the US and the UK, based on data from Statista on the proportion of people who have used a ride-hailing app.
Methodology
The pillar is calculated from five equally weighted factors, with consumer opinions added for this version of the AVRI and ride-hailing market penetration moved from the technology and innovation pillar.
Consumer opinions of AVs: Branded Research144 asked 100 people from online panels in each of the 25 countries to respond to the following question: “What is your general opinion of autonomous vehicles?” Branded Research actively adjusts
its overall audience and recruitment process to ensure that the natural fallout on consumer studies is generally representative of each country, with
a minimal margin of error. Branded Research conducted its research in September 2018 for 24 of the 25 countries, and in India in October 2018. More positive opinions produce higher scores, reflecting the importance of public acceptance of AVs as to whether they will be adopted. Respondents in India, Mexico and the UAE were
the most enthusiastic with those in the UK, the US and Canada the least.
Population living in test areas: this measure uses data on cities carrying out AV testing collected by Bloomberg Philanthropies and Aspen Institute.145 The proportion of national populations living in test areas is then calculated based on city populations from the McKinsey Global Institute’s Urban World app.146 The more people see AVs on the road,
the more comfortable that they are likely to use them when they become available, so countries with a higher proportion of population that live in cities where AV pilots and testing are underway scored the highest. The countries with the highest proportions are Singapore, the Netherlands and Canada. There are currently no AV testing areas in Austria, Hungary, India and Mexico.
Civil society technology use: scores are based on this sub-indicator of KPMG International’s 2017 Change readiness index, updated for 2018.147 This is included as the use of other types of consumer technology indicates the potential for consumers to embrace AVs. The leading countries are Sweden, the Netherlands and Norway while the lowestscoring are India, Brazil and Russia.
Consumer adoption of technology: scored using the World Economic Forum’s Global competiveness report, which includes the availability of latest technologies, mobile broadband subscriptions, internet access and internet bandwidth.148 The top countries are the Netherlands, the UK and Sweden while India, China and Mexico score the lowest.
Online ride-hailing market penetration: a new measure using data from Statista149 on the percentage of people in each country who have used a ride-hailing service. Statista conducts
nationally representative surveys in each country. People in China, the US and the UK are most likely to have used such a service, while those in India, Japan and Hungary are least likely to have done so.
502019 Autonomous Vehicles Readiness Index
©2019 KPMG International Cooperative (“KPMG International”). KPMG International provides no client services and is a Swiss entity with which the independent member firms of the KPMG network are affiliated.

vk.com/id446425943
Pillar 4: aggregate scores by country
6.87 |
6.58 |
|
|
|
|
|
|
|
|
|
|
|
|
|
|
|
|
|
|
|
|
|
|
|
|
|
|
|
|
|
|
|
|
|
|
|
|
|
|
|
|
|
|
|
6.11 |
5.81 |
5.78 |
5.59 |
|
|
|
|
|
|
|
|
|
|
|
|
|
|
|
|
|
|
|
5.36 |
|
|
|
|
|
|
|
|
|
|
|
|
|
|
|
|
|||
|
|
|
|
5.18 |
5.18 |
5.17 |
5.04 |
|
|
|
|
|
|
|
|
|
|
|
|
||
|
|
|
|
|
4.84 |
|
|
|
|
|
|
|
|
|
|
|
|||||
|
|
|
|
|
|
4.75 |
|
|
|
|
|
|
|
|
|
|
|||||
|
|
|
|
|
|
|
|
|
|
|
|
|
|
|
|
|
|
|
|
||
|
|
|
|
|
|
|
|
|
|
|
4.28 |
4.21 |
4.20 |
4.18 |
4.03 |
3.93 |
3.64 |
|
|
|
|
|
|
|
|
|
|
|
|
|
|
|
|
|
|
|
|
|
|
|
|||
|
|
|
|
|
|
|
|
|
|
|
|
|
|
|
|
|
3.34 |
3.21 |
3.06 |
3.05 |
|
|
|
|
|
|
|
|
|
|
|
|
|
|
|
|
|
|
|
|
|
|
1.80 |
Singapore |
The Netherlands |
Norway |
Sweden |
Finland |
United States |
United Arab Emirates |
Israel |
New Zealand |
United Kingdom |
Canada |
Australia |
Germany |
China |
France |
Austria |
Spain |
Japan |
South Korea |
Czech Republic |
Mexico |
Brazil |
Hungary |
Russia |
India |
Pillar 4: (Consumer acceptance) normalized indicator values by country
Country |
Consumer survey data on |
Percent of population living |
KPMG change readiness |
WEF technology |
Ridesharing market |
|
AV acceptance |
in test areas |
technology use sub index |
readiness (GCI) |
penetration |
|
|
|
|
|
|
Singapore |
0.654 |
1.000 |
0.832 |
0.921 |
0.408 |
|
|
|
|
|
|
The Netherlands |
0.466 |
0.775 |
0.985 |
1.000 |
0.429 |
|
|
|
|
|
|
Norway |
0.599 |
0.339 |
0.960 |
0.931 |
0.565 |
|
|
|
|
|
|
Sweden |
0.466 |
0.351 |
1.000 |
0.987 |
0.424 |
|
|
|
|
|
|
Finland |
0.489 |
0.288 |
0.929 |
0.888 |
0.614 |
|
|
|
|
|
|
United States |
0.103 |
0.355 |
0.852 |
0.966 |
0.832 |
|
|
|
|
|
|
United Arab Emirates |
0.968 |
0.219 |
0.787 |
0.835 |
0.168 |
|
|
|
|
|
|
New Zealand |
0.529 |
0.282 |
0.886 |
0.922 |
0.261 |
|
|
|
|
|
|
Israel |
0.489 |
0.524 |
0.559 |
0.947 |
0.359 |
|
|
|
|
|
|
United Kingdom |
0.000 |
0.298 |
0.924 |
0.995 |
0.652 |
|
|
|
|
|
|
Canada |
0.201 |
0.670 |
0.848 |
0.856 |
0.223 |
|
|
|
|
|
|
Australia |
0.372 |
0.366 |
0.884 |
0.806 |
0.261 |
|
|
|
|
|
|
Germany |
0.372 |
0.133 |
0.932 |
0.946 |
0.255 |
|
|
|
|
|
|
China |
0.783 |
0.043 |
0.222 |
0.330 |
1.000 |
|
|
|
|
|
|
France |
0.364 |
0.209 |
0.685 |
0.862 |
0.217 |
|
|
|
|
|
|
Austria |
0.348 |
0.000 |
0.792 |
0.884 |
0.310 |
|
|
|
|
|
|
Spain |
0.693 |
0.000 |
0.571 |
0.793 |
0.266 |
|
|
|
|
|
|
Japan |
0.442 |
0.301 |
0.505 |
0.895 |
0.098 |
|
|
|
|
|
|
South Korea |
0.725 |
0.020 |
0.362 |
0.784 |
0.293 |
|
|
|
|
|
|
Czech Republic |
0.560 |
0.000 |
0.529 |
0.738 |
0.196 |
|
|
|
|
|
|
Mexico |
0.992 |
0.000 |
0.225 |
0.339 |
0.299 |
|
|
|
|
|
|
Brazil |
0.834 |
0.103 |
0.174 |
0.450 |
0.223 |
|
|
|
|
|
|
Hungary |
0.591 |
0.000 |
0.346 |
0.613 |
0.147 |
|
|
|
|
|
|
Russia |
0.866 |
0.000 |
0.176 |
0.444 |
0.207 |
|
|
|
|
|
|
India |
1.000 |
0.000 |
0.000 |
0.000 |
0.000 |
|
|
|
|
|
|
Source: KPMG International, 2019
2019 Autonomous Vehicles Readiness Index 51
© 2019 KPMG International Cooperative (“KPMG International”). KPMG International provides no client services and is a Swiss entity with which the independent member firms of the KPMG network are affiliated.
vk.com/id446425943
Endnotes
1‘Honda Joins with Cruise and General Motors to Build New Autonomous Vehicle’, Honda News, 3 October 2018: http://hondanews. com/releases/honda-joins-with-cruise-and- general-motors-to-build-new-autonomous- vehicle and ‘Ford Creates ‘Ford Autonomous Vehicles LLC’; Strengthens Global Organization to Accelerate Progress, Improve Fitness’, Ford Media Center, 24 July 2018: https://media.ford.com/content/fordmedia/ fna/us/en/news/2018/07/24/ford-creates-ford- autonomous-vehicles-llc.html
2Global status report on road safety 2018, World Health Organization, December 2018. https://www.who.int/violence_injury_ prevention/road_safety_status/2018/en/
3‘Human error as a cause of vehicle crashes’, Bryant Walker Smith, Center for Internet and Society at Stanford Law School, 18 December 2013: https://cyberlaw.stanford. edu/blog/2013/12/human-error-cause-vehicle- crashes
4‘Uber halts autonomous car tests after fatal crash in Arizona’, Mark Bergen and Eric Newcomer, Bloomberg, 19 March 2018: https://www.bloomberg.com/news/ articles/2018-03-19/uber-autonomous-car- involved-in-fatal-crash-in-arizona and ‘Tesla's
Autopilot Was Involved in Another Deadly Car Crash’, Jack Stewart, Wired, 30 March 2018: https://www.wired.com/story/tesla-autopilot- self-driving-crash-california/
5‘2017 safest year on record for commercial passenger air travel: groups’, David Shepardson, Reuters, 1 January 2018: https://www.reuters. com/article/us-aviation-safety/2017-safest-year- on-record-for-commercial-passenger-air-travel- groups-idUSKBN1EQ17L
6‘Autonomy delivers: An oncoming revolution in the movement of goods,’ KPMG LLP, November 2018: https://advisory.kpmg.us/content/dam/ advisory/en/pdfs/2018/autonomy-delivers-final- secured-web.pdf
7‘New survey data reveals increases in driver compensation’, AmericanTrucking Association, 27 March 2018: https://www.trucking.org/ article/New-Survey-Data-Reveals-Increases-in- Driver-Compensation
8The automobile industry pocket guide 201819, European Automobile Manufacturers Association: https://www.acea.be/ publications/article/acea-pocket-guide
9‘UK and seven major companies join campaign for vehicle electrification’, International Energy Agency, 11 September 2018: https://www.iea.org/newsroom/ news/2018/september/uk-and-seven- major-companies-join-campaign-for-vehicle- electrification.html
10‘Reinventing the wheel’, Economist Intelligence Unit, June 2018: https:// innovationmatters.economist.com/ reinventing-the-wheel-moving-eiu
11Marketplace of change: automobile insurance in the era of autonomous vehicles, KPMG in the US, October 2015: https://assets.kpmg.com/content/dam/ kpmg/pdf/2016/06/id-market-place-of- change-automobile-insurance-in-the-era-of- autonomous-vehicles.pdf
12‘UK motor insurance market could shrink up to 41% by 2040 — Bank of England’, Louie Bacani, Insurance
Business, 20 March 2017: https://www. insurancebusinessmag.com/uk/news/ technology/uk-motor-insurance-market- could-shrink-up-to-41-by-2040--bank-of- england-63108.aspx
13‘Lov om utprøving av selvkjørende kjøretøy’ (text of new law in Norwegian), Lovdata Foundation: https://lovdata.no/dokument/NL/ lov/2017-12-15-112
14‘Driverless car tests roll out on south China streets’, Charles Clover, Yuan Yang and Sherry Fei Ju, Financial Times, 5 February 2018: https://www.ft.com/content/8481ee48- 0975-11e8-8eb7-42f857ea9f09
15‘Toespraak van minister Van Nieuwenhuizenbij de opening van de Intertraffic Beurs‘, speech by Cora Van Nieuwenhuizen (in English), Government of the Netherlands, 26 March 2018: https://www.rijksoverheid.nl/regering/ bewindspersonen/cora-van-nieuwenhuizen/ documenten/toespraken/2018/03/26/ speech-by-cora-van-nieuwenhuizen-minister- of-infrastructure-and-water-management-at- the-opening-of-intertraffic-amsterdam-20- march-2018
16‘Uber halts autonomous car tests after fatal crash in Arizona’ as above.
17‘California scraps safety driver rules for self-driving cars’, Daisuke Wakabayashi, NewYorkTimes, 26 February 2018: https:// www.nytimes.com/2018/02/26/technology/ driverless-cars-california-rules.html
18‘EU motors ahead with rules for self-driving cars’, Peter Campbell, FinancialTimes, 14 May 2018: https://www.ft.com/content/f3a76e4c- 5772-11e8-b8b2-d6ceb45fa9d0
19‘Japan looks to launch driverless car system inTokyo by 2020’, Stanley White, Reuters,
4 June 2018: https://www.reuters.com/article/ us-japan-economy-strategy/japan-looks-to- launch-driverless-car-system-in-tokyo-by-2020- idUSKCN1J00VN
20‘Ford Creates ‘Ford Autonomous Vehicles LLC’; Strengthens Global Organization to Accelerate Progress, Improve Fitness’, Ford Media Center, 24 July 2018: https:// media.ford.com/content/fordmedia/fna/ us/en/news/2018/07/24/ford-creates-ford- autonomous-vehicles-llc.html
21‘Uber’s Vision of Self-Driving Cars Begins to Blur’, Mike Isaac, Daisuke Wakabayashi and Kate Conger, 19 August 2018, NewYork
Times: https://www.nytimes.com/2018/08/19/ technology/uber-self-driving-cars.html
22Automated and electric vehicles act 2018,
House of Commons library, 15 August 2018: https://researchbriefings.parliament.uk/ ResearchBriefing/Summary/CBP-8118
23‘Yandex launches the first autonomous ridehailing service in Europe’,Yandex, 28 August 2018: https://yandex.com/company/blog/ yandex-launches-the-first-autonomous-ride- hailing-service-in-europe
24‘Alphabet’s Waymo begins charging passengers for self-driving cars’,Tim Bradshaw and Richard Waters, Financial Times, 26 October 2018: https://www. ft.com/content/7980e98e-d8b6-11e8-a854- 33d6f82e62f8
25‘Office of FutureTransportTechnologies revealed’, Australian deputy prime minister, 4 October 2018: http://minister.infrastructure. gov.au/mccormack/releases/2018/october/ mm178_2018.aspx
26‘Ford, Walmart and Postmates team up for self-driving goods delivery’, Brian Wolf, Ford, 14 November 2018: https://media.ford.com/ content/fordmedia/fna/us/en/news/2018/11/14/ ford--walmart-and-postmates-team-up-for- self-driving-goods-deliv.html and Custom Autonomous Cargo Vans to Deliver Groceries in Walmart’s Pilot with Udelv, Walmart, January 2019: https://news.walmart. com/2019/01/08/custom-autonomous-cargo- vans-to-deliver-groceries-in-walmarts-pilot- with-udelv
27‘Electric driverless truck set to gain approval for public roads’, Patrick McGee, Financial Times, 2 December 2018: https://www. ft.com/content/f76ef090-f47f-11e8-ae55- df4bf40f9d0d
28‘Toespraak van minister Van Nieuwenhuizenbij de opening van de Intertraffic Beurs‘ as above
29‘Self-driving vehicles’ (in English), Government of the Netherlands: https://www.government. nl/topics/mobility-public-transport-and-road- safety/self-driving-vehicles
30‘VDL scoort miljoenenorders voor productie zelfrijdende voertuigen’ (in Dutch), Het Financieele Dagblad, 24 October 2017: https://fd.nl/ondernemen/1224174/vdl-scoort- miljoenenorders-voor-productie-zelfrijdende- voertuigen
31‘NTU, LTA and JTC unveil Singapore’s first autonomous vehicle test centre’, Land Transport Authority, 22 November 2017: https://www.lta.gov.sg/apps/news/page. aspx?c=2&id=10ceddae-472a-4920-8d4c- e73babfcecb0
32‘A self-driving shuttle bus will hit the road at NUS from March next year — here’s what you need to know’, Sean Lim, 12 November 2018,
Business Insider Singapore: https://www. businessinsider.sg/a-self-driving-shuttle-bus- will-hit-the-road-at-nus-from-march-next-year- heres-what-you-need-to-know/
522019 Autonomous Vehicles Readiness Index
©2019 KPMG International Cooperative (“KPMG International”). KPMG International provides no client services and is a Swiss entity with which the independent member firms of the KPMG network are affiliated.
vk.com/id446425943
33‘Dyson chooses Singapore over Britain to build electric car’, Paul Sandle, Reuters, 23 October 2018: https://www.reuters.com/ article/us-britain-dyson-singapore/dyson- chooses-singapore-over-britain-to-build-electric- car-idUSKCN1MX2MO
34‘Lov om utprøving av selvkjørende kjøretøy’ as above
35‘Autonomous future at Forus’, Kolumbus: https://www.kolumbus.no/en/news-archive/ autonomous-future-at-forus/
36‘Scandinavia gets its first autonomous public buses, but there's a big catch’, Stig Øyvann, ZDNet, 18 May 2018: https://www.zdnet.com/ article/scandinavia-gets-its-first-autonomous- public-buses-but-theres-a-big-catch/
37‘Autonomous vehicles: expect up to 50 driverless buses on Oslo streets by 2021’, Stig Øyvann, ZDNet, 23 October 2018: https://www.zdnet.com/article/autonomous- vehicles-expect-up-to-50-driverless-buses-on- oslo-streets-by-2021/
38Applied Autonomy website: https://www. appliedautonomy.no/en/home/
39‘Ta en selvkjørende buss til stranden i sommer!’ (‘Take a self-drive bus to the beach this summer!’), Acando Oslo: https:// www.acando.no/hva-vi-tror-pa/smart-city/ selvkjorende-buss-pa-fornebu/
40Preparing for the future of transportation: automated vehicles 3.0, US Department of Transportation, 4 October 2018: https://www. transportation.gov/av/3
41‘News’, DriveOhio: https://www.driveohio.org/ news/
42Michigan Economic Development Corporation: https://www.michiganbusiness. org/
43‘Gov Charlie Baker signs Massachusetts electric vehicle bill into law’, Shira Schoenberg, MassLive, 13 January 2017: https://www. masslive.com/politics/index.ssf/2017/01/gov_ charlie_baker_signs_massachusetts_electric_ vehicle_bill_into_law.html
44Connected and Automated Vehicle Program, Virginia Department ofTransportation, 2018: http://www.virginiadot.org/programs/ connected_and_automated_vehicles.asp
45‘World's first electrified public road opens in Sweden’, The Local, 13 April 2018: https:// www.thelocal.se/20180413/worlds-first- electric-road-opens-in-sweden
46‘Stockholm gets Scandinavia's first driverless buses on public road’, Emma Löfgren, The Local, 27 December 2017: https://www.thelocal.se/20171227/ stockholm-gets-scandinavias-first- driverless-buses-on-public-road
47‘Volvo's self-driving cars will soon hit the streets in Sweden’, The Local, 14 September 2018: https://www.thelocal.se/20180914/ volvos-self-driving-cars-will-soon-hit-the-road- in-sweden
48‘Electric driverless truck set to gain approval for public roads’, as above.
49‘Martti, developed for adverse weather conditions, is the first Finnish robot car to challenge snow and ice’, VTT, 15 December 2017: https://www.vttresearch.com/media/ news/martti-developed-for-adverse-weather- conditions-is-the-first-finnish-robot-car-to- challenge-snow-and-ice and ‘VTT’s robot car, Martti, now “speaks 5G” and takes another step towards full automation’, VTT, 20 August 2018: https://www.vttresearch.com/media/ news/vtt%E2%80%99s-robot-car-martti-now- speaks-5g-and-takes-another-step-towards-full- automation
50’Nordic conditions drive automated vehicles to the Finnish line’, Good News Finland, 9 August 2017: http://www.goodnewsfinland. com/feature/nordic-conditions-drive- automated-vehicles-to-finnish-line/
51‘Driverless buses take visitors to the Kivistö Housing Fair from 10 July’, HSL, 8 July 2015: https://www.hsl.fi/en/news/2015/driverless- buses-take-visitors-kivisto-housing-fair-10- july-6904
52‘Self-driving bus on Helsinki RobobusLine goes to scheduled service’, City of Helsinki, 15 May 2018: https://www.hel.fi/uutiset/ en/helsinki/robobus-line-goes-to-scheduled- service
53‘Muji and Sensible 4 created Gacha – the first autonomous shuttle bus in the world for all weather conditions’, Sensible 4, Epressi, 31 October 2018: https://www.dezeen. com/2018/11/02/muji-sensible-4-gacha- autonomous-shuttle-bus-finland-driverless- design/
54‘Anyone can be a cabbie — new law transforms Finnish taxi trade’, YLE, 1 July 2018: https://yle.fi/uutiset/osasto/news/ anyone_can_be_a_cabbie__new_law_ transforms_finnish_taxi_trade/10283444
55‘The new RoadTraffic Act aims for a safer future’, Ministry ofTransport and Communications, Finnish Government,
23 November 2017: https://valtioneuvosto.fi/ en/article/-/asset_publisher/uusi-tieliikennelaki- tahtaa-turvallisempaan-tulevaisuuteen
56Automated and electric vehicles act 2018
57From science fiction to reality: people in London and Edinburgh set to be the first to trial self-driving vehicle servicesí, UK Department for Business, Energy and Industrial Strategy, 22 November 2018:
https://www.gov.uk/government/news/from- science-fiction-to-reality-people-in-london- and-edinburgh-set-to-be-the-first-to-trial-self- driving-vehicle-services
58https://publications.parliament.uk/pa/ cm201719/cmselect/cmtrans/590/reportoverview.html
59https://www.lawcom.gov.uk/project/ automated-vehicles/
60https://www.gov.uk/government/news/new- cyber-security-standard-for-self-driving-vehicles
61‘Federal Government adopts action plan on automated driving’, Federal Ministry of
Transport and Digital Infrastructure, 28 August 2017: https://www.bmvi.de/SharedDocs/ EN/publications/strategy-for-automated-and- connected-driving.pdf
62‘Autonomous driving levels 0 to 5: Understanding the differences’, Hope Reese, TechRepublic, 20 January 2016: https://www. techrepublic.com/article/autonomous-driving- levels-0-to-5-understanding-the-differences/
63‘Germany launches task force to kickstart shift to sustainable mobility’, Sören Amelang, Clean Energy Wire, 19 September 2018: https:// www.cleanenergywire.org/news/germany- launches-task-force-kickstart-shift-sustainable- mobility
64‘Mobility for people’, Zukunftsnetz Mobilität NRW: https://www.zukunftsnetz-mobilitaet. nrw.de/sites/default/files/downloads/znm-nrw- infoflyer_znm_din-lang-en_x3-3.pdf
65‘Mohammed bin Rashid approves Dubai AutonomousTransportation Strategy’, Government of Dubai, 25 April 2016: https:// www.dubaifuture.gov.ae/mohammed- bin-rashid-approves-dubai-autonomous- transportation-strategy/
66‘Road to safety: Self-driving cars in the Middle East’, Alicia Buller, Computer Weekly 10 November 2016: https://www. computerweekly.com/news/450402609/
Road-to-safety-Self-driving-cars-in-the-Middle- East
67‘Smart Dubai and IBM to offer first government-endorsed blockchain platform’, Smart Dubai, 30 October 2018: https://smartdubai.ae/newsroom/news- details/2018/10/30/smart-dubai-and-ibm-to- offer-first-government-endorsed-blockchain- platform
68‘Masdar City launches autonomous shuttle’, Gulf News, 22 October 2018: https:// gulfnews.com/uae/transport/masdar-city- launches-autonomous-shuttle-1.2292558
69‘Japan looks to launch driverless car system in Tokyo by 2020’ as above.
70‘Driverless shuttle company signs $20m deal with Chinese’, Chris Hutching, Stuff, 21 June 2018: https://www.stuff.co.nz/ business/104824042/driverless-shuttle- company-signs-20m-production-deal-with- chinese
2019 Autonomous Vehicles Readiness Index 53
© 2019 KPMG International Cooperative (“KPMG International”). KPMG International provides no client services and is a Swiss entity with which the independent member firms of the KPMG network are affiliated.
vk.com/id446425943
71‘Ambitious plan to use Christchurch red zone for autonomous vehicle tests’, Michael Hayward, Stuff, 2 November 2018: https://www.stuff. co.nz/business/108296150/Ambitious-plan-to- use-Christchurch-red-zone-for-autonomous- vehicle-tests
72‘Air taxi trials possible in six years as tech company trials flying vehicle in Canterbury’, Michael Hayward, Stuff, 13 March 2018: https://www.stuff.co.nz/
technology/102203642/air-taxi-trials-possible- in-six-years-as-tech-company-trials-flying- vehicle-in-canterbury
73‘Testing autonomous vehicles in New Zealand’, NZTransport Agency: https:// www.nzta.govt.nz/vehicles/vehicle-types/ automated-and-autonomous-vehicles/testing- autonomous-vehicles-in-new-zealand/
74‘Ontario Government Supports Innovation and Growth in Automated Vehicle Industry’, Ontario Ministry of Transport, 22 January 2019: https://news.ontario.ca/mto/ en/2019/01/ontario-government-supports- innovation-and-growth-in-automated- vehicle-industry.html
75Autonomous Vehicle Innovation Network: https://www.avinhub.ca/ and ‘Automotive Supplier Competitiveness Improvement Program’, Ontario Centres of Excellence: https://www.oce-ontario.org/programs/ commercialization/automotive-supplier- competitiveness-improvement-program- ascip
76Autonomous vehicles and the future of work in Canada, Information and Communications Technology Council, August 2018: https://www.ictc-ctic.ca/ wp-content/uploads/2018/01/ICTC_-
Autonomous-Vehicles-and-The-Future-of- Work-in-Canada-1-1.pdf
77‘Korea builds urban infrastructure for testing autonomous vehicles’, Jun Ji-hye, KoreaTimes, 10 December 2018: http://www.koreatimes. co.kr/www/tech/2018/12/133_260137.html
78‘KT tests driverless bus at Korean airport’, Cho Mu-Hyun, ZDNet, 20 November 2018:
https://www.zdnet.com/article/kt-tests-driverless- bus-at-korean-airport/
79‘New SmartTraffic System to Enhance Safety of Autonomous Cars’, KBS World Radio, 27 March 2018: http://world.kbs.co.kr/service/ news_view.htm?lang=e&Seq_Code=135015
80‘Samsung Reveals DRVLINE™ Platform, Takes Bold StepToward Autonomous Future’, Samsung, 1 August 2018: https://news. samsung.com/us/samsung-reveals-drvline- platform-autonomous-future/
81Issues Related to Regulation Reforms to Activate Autonomous Vehicle Industry”, IITP, 7 September 2018: https://www. iitp.kr/kr/1/notice/reportAndClarify/view. it?ArticleIdx=3222&count=true
82‘Intel buys Mobileye in $15.3 billion bid to lead self-driving car market’, Mark Scott, NewYork Times, 13 March 2017: https://www.nytimes. com/2017/03/13/business/dealbook/intel- mobileye-autonomous-cars-israel.html
83‘Daimler and Mizmaa Ventures co-lead round B at Anagog’, Anagog, 27 February 2018: https://www.anagog.com/project/ daimler-mizmaa-ventures-co-lead-round- b-anagog-mobility-status-ai-innovator/, ‘BP invests in ultra-fast charging battery company StoreDot’, BP, 22 May 2018: https://www.bp.com/en/global/corporate/ media/press-releases/bp-invests-in-ultra- fast-charging-battery-company-storedot. html and ‘SoftWheel is Delighted to Announce Investment by Mitsubishi
Corporation’, Business Wire, 27 September 2018: https://www.businesswire. com/news/home/20180927005303/ en/SoftWheel-Delighted-Announce- Investment-Mitsubishi-Corporation
84Automated vehicles in Australia, National Transport Commission: https://www.ntc.gov. au/roads/technology/automated-vehicles-in- australia/
85‘Office of FutureTransportTechnologies revealed’ as above
86‘NSW Budget caters for the future of driverless cars’,Transport for NSW, 18 June 2018: https://www.transport.nsw.gov.au/ news-and-events/media-releases/nsw- budget-caters-for-future-of-driverless-cars and 'Automated Vehicles GetThe Green Light', Minister for Roads and Road Safety, 23 February 2018: https://www.premier.vic.gov. au/automated-vehicles-get-the-green-light/
87Connected and automated vehicles, Austroads, 22 August 2018: https:// austroads.com.au/drivers-and-vehicles/ connected-and-automated-vehicles 'Connected and automated vehicles (CAV) open data Recommendations', Austroads, 23 August 2018: https://austroads.com.au/ publications/connected-and-automated- vehicles/ap-r581-18; and 'Webinar: operations of automated heavy vehicles in remote and regional areas', Austroads, 25 September 2018: https://austroads.com.au/ publications/freight/web-r579-18
88'Victorian connected and automated vehicle trials',Transurban: https://cavs.transurban. com/content/dam/cavs/documents/victorian- trials-report.pdf
89'Round Australia electric highway', Tesla Owners Australia: https://www.teslaowners. org.au/round-australia
90'Advice on automated and zero emissions vehicles infrastructure', Infrastructure Australia, October 2018: http://www. infrastructurevictoria.com.au/sites/ default/files/files/AVZEV/Advice%20 on%20automated%20and%20zero%20 emissions%20vehicles%20-%20 October%202018.PDF
91‘Slovenia, Austria, Hungary to create driverless region’, SloveniaTimes, 25 March 2018: http:// www.sloveniatimes.com/slovenia-austria- hungary-to-create-driverless-region
92Action Programm on Automated Mobility 2019-2022: https://www.bmvit.gv.at/en/ service/publications/downloads/action_ automated_mobility_2019-2022_ua.pdf
93ALP.Lab, 26 June 2018: https://www.alp-lab. at/2018/07/03/26-06-2018/
94‘BMW starts cooperation withTTTech Auto for developing automated driving functions at the highest safety level’.TTTech Auto, 5 November 2018: https://www.tttech-auto. com/press/bmw-starts-cooperation-with- tttech-auto-for-developing-automated-driving- functions-at-the-highest-safety-level/ and ‘SAIC andTTTech Establish Joint Venture in Shanghai to Deploy the “Smart Brain” for Autonomous Driving Cars in China’,TTTech
Auto, 14 March 2018: https://www.tttech-auto. com/press/saic-and-tttech-establish-joint- venture-in-shanghai-to-deploy-the-smart-brain- for-autonomous-driving-cars-in-china/
95‘Driverless shuttles on test in La Défense’,
Metro Report International, 5 July 2017: https://www.metro-report.com/news/single- view/view/driverless-shuttles-on-test-in-la- defense.html
96‘World premiere in Lyon’, Keolis, 2 September 2016: https://www.keolis.com/en/media/ press-releases/world-premiere-lyon
97‘Development of autonomous vehicles — strategic orientations for public
action’ (summary in English), French Government, May 2018: https://www. ecologique-solidaire.gouv.fr/sites/default/ files/18029_D%C3%A9veloppement- VA_8p_EN_Pour%20BAT-3.pdf
98‘Renault’s EZ-GO robot taxi is the most socially responsible concept in Geneva’,Vlad Savov, The Verge, 8 March 2018: https://www.theverge. com/2018/3/8/17097016/renault-ez-go-robot-taxi- geneva-motor-show-2018
99Faurecia: http://www.faurecia.com/en and Valeo: https://www.valeo.com/en/
100‘Arranca la Plataforma de Vehículo Conectado 3.0’ (in Spanish), ABC, 16 November 2018: https://www.abc.es/motor/ reportajes/abci-arranca-plataforma-vehiculo- conectado-30-201811121517_noticia.html
101‘Barcelona introduces Mobileye to city streets’ Mobileye, 5 December 2017: https://www. mobileye.com/en-uk/2017/12/05/barcelona- introduces-mobileye-city-streets/
102Auto C-its: https://www.autocits.eu/
103‘Successful tests mark important milestone towards a 5G future’, Lancaster University, 10 October 2018: http://www.lancaster. ac.uk/news/successful-tests-mark-important- milestone-towards-a-5g-future
542019 Autonomous Vehicles Readiness Index
©2019 KPMG International Cooperative (“KPMG International”). KPMG International provides no client services and is a Swiss entity with which the independent member firms of the KPMG network are affiliated.
vk.com/id446425943
104 ‘BMW to build Czech test track for self-driving cars’, Andreas Cremer, Reuters, 15 December 2017: https://www.reuters.com/article/us- bmw-czech-investment-idUSKBN1E90Y5
105 ‘Draft bill facilitates autonomous car usage in the Czech Republic’,Tomáš Matejovský and Petr Beneš, Lexology, 20 June 2018: https://www.lexology.com/library/detail. aspx?g=e4bb3c1a-3c28-4aeb-8741- 13f3a712e77a
106 ‘Driverless car tests roll out on south China streets’ as above.
107 ‘Baidu launches public road tests of autonomous cars in China’, Charles Clover, Emily Feng and Sherry Fei Ju, 23 November 2017, FinancialTimes: https://www.ft.com/ content/8c506d06-d02d-11e7-b781- 794ce08b24dc
108 ‘KPMG releases the leading AutoTech 50 List in China for the first time’, 28 March 2018, KPMG China: https://home.kpmg.com/cn/en/ home/news-media/press-releases/2018/03/ the-leading-autotech-50-list-in-china.html
109RoboSense: https://www.robosense.ai/, Surestar: http://www.isurestar.com/index. php/en-Index.html and Horizon Robotics: http://en.horizon.ai/
110Automotive Proving Ground Zala: https:// zalazone.hu/en/
111AImotive: https://aimotive.com/
112‘BMW Group to expand production network in Europe’, 31 July 2018, BMW Group. https://www.bmwgroup-plants.com/ debrecen/en/aktuelles/new-plant.html
113‘Slovenia, Austria, Hungary to create driverless region’ as above
114‘Yandex.taxi’s self-driving car conducts winter testing on Moscow’s public streets’,Yandex, 16 February 2018: https://yandex.com/ company/blog/self-driving-city/
115‘Yandex launches the first autonomous ridehailing service in Europe’ as above
116‘Russia to rapidly scale 5G following launch of first 5G networks in 2020, finds new GSMA study’, Associated Press, 30 October 2018: https://www.apnews.com/5dfe72f2543a49d e977a2ca99a7e1a82
117‘Mexican auto parts makers see new trade deal boosting output’, Sharay Angulo and Anthony Esposito, Reuters, 2 October 2018: https://www.reuters.com/article/us-trade-nafta- autoparts/mexican-auto-parts-makers-see-new- trade-deal-boosting-output-idUSKCN1MB3XU
118‘Mexico grows as world leader on energy reform and renewables’, Mary DeFilippe,
Renewable Energy World, 11 April 2018: https://www.renewableenergyworld.com/ ugc/articles/2018/03/01/mexico-reform-and- renewables.html
119‘Stuck in traffic, Indians are desperate for selfdriving cars’, SuneeraTandon, Quartz India, 18 July 2018: https://qz.com/india/1329942/ indians-are-desperate-for-autonomous-cars/
120‘Metro 3 to get made in India driverless trains’, ChittaranjanTembhekar, Times of India, 20 July 2018: https://timesofindia.indiatimes. com/city/mumbai/metro-3-to-get-made-in- india-driverless-trains/articleshow/65061055. cms
121‘9 Startups In India Working On Self Driving Technology’, Srishti Deoras, Analytics India, 28 November 2017: https://www. analyticsindiamag.com/9-startups-india- working-self-driving-technology/
122‘Revv partners with Mobileye to make its cars safer’, ANI, 1 November 2017: https:// www.aninews.in/news/business/business/ revv-partners-with-mobileye-to-make-its-cars- safer201711011616160003/
123‘Brazil approves tax breaks for Ford, Fiat, other automakers’, Maria Carolina Marcello, Reuters, 9 November 2018: https:// uk.reuters.com/article/uk-brazil-autos/ brazil-approves-tax-breaks-for-ford-fiat-other- automakers-idUKKCN1ND32L
124‘Intelligent Autonomous Robotic Automobile’, Laboratório de Computação de Alto Desempenho, Federal University of Espírito Santo: http://www.lcad.inf.ufes.br/wiki/index. php/IARA
125‘Brazilian university tests self-driving taxi service’, Elton Alisson, Agência FAPESP, 26 August 2015: http://agencia.fapesp.br/ brazilian-university-tests-self-driving-taxi- service/21758/
126‘Toyota reveals world-first flexible fuel hybrid prototype in Brazil’,Toyota, 20 March 2018: https://newsroom.toyota.co.jp/en/ corporate/21633112.html
1272017 Change readiness index, KPMG International, data updated for 2018: https://home. kpmg.com/xx/en/home/insights/2017/07/2017- change-readiness-index.html
128Networked readiness index, World Economic Forum, 2018: http://reports.weforum.org/ network-readiness-index/
129Open data barometer fourth edition, World Wide Web Foundation, 2016: https:// opendatabarometer.org/4thedition/
130‘Segmenting the autonomous vehicle value chain: a look at who is in the “driverless” seat’, Cision PR Web, 8 June 2016: http://www.prweb.com/releases/ vsi/segmentsautonomousvehicle/ prweb13472308.htm
131‘263 self-driving car startups to watch’, Taylor Stewart, Comet Labs, 10 May 2017: https://blog.cometlabs.io/263-self-driving-car- startups-to-watch-8a9976dc62b0
132Crunchbase Pro: https://about.crunchbase. com/products/crunchbase-pro/
133PatSeer: https://patseer.com/
134Networked readiness index as above.
135Table A7, p110, Global EV Outlook 2018,
International Energy Agency: https:// webstore.iea.org/global-ev-outlook-2018
136Tables A10-A12, pp112-13, Global EV outlook 2018 as above.
137Bureau ofTransportation Statistics: https:// www.bts.gov/
138Roadways data, World factbook, CIA: https:// www.cia.gov/library/publications/resources/ the-world-factbook/fields/2085.html
139GSMA Mobile connectivity index,
GSM Association: https://www. mobileconnectivityindex.com/#year=2017
140The state of LTE, OpenSignal, February 2018: https://opensignal.com/reports/2018/02/state- of-lte
141The global competitiveness report 2018,
World Economic Forum: http://reports. weforum.org/global-competitiveness- report-2018/
142Logistics performance index,The World Bank: https://lpi.worldbank.org/
1432017 Change readiness index as above.
144Branded Research: https://gobranded.com/
145‘Initiative on cities and autonomous vehicles’, Bloomberg Philanthropies and Aspen Institute: http://avsincities.bloomberg.org/
146‘Urban world: what’s next?’, McKinsey Global Institute, October 2016 : https://www. mckinsey.com/mgi/overview/in-the-news/ urban-world-app
1472017 Change readiness index as above.
148The global competitiveness report 2018 as above.
149Statista (https://www.statista.com/ outlook/368/ride-hailing)
2019 Autonomous Vehicles Readiness Index 55
© 2019 KPMG International Cooperative (“KPMG International”). KPMG International provides no client services and is a Swiss entity with which the independent member firms of the KPMG network are affiliated.

vk.com/id446425943
KPMG’s Global Mobility Contacts
Global Head of Infrastructure
Richard Threlfall
T: +44 113 231 3437
E: richard.threlfall@kpmg.co.uk
Australia |
Germany |
Norway |
Praveen Thakur |
Moritz Püstow |
Ketil Timm Marcussen |
T: +61 39 288 5808 |
T: +49 30 530199 120 |
T: +47 40 63 93 35 |
E: thakurp@kpmg.com.au |
E: mpuestow@kpmg-law.com |
E: ketil.marcussen@kpmg.no |
Austria |
Hungary |
Russia |
Werner Girth |
Márton Zsótér |
Stepan Svetankov |
T: +43 131 332 3690 |
T: +3618875549 |
T: +74 95 937 4444 |
E: wgirth@kpmg.at |
E: marton.zsoter@kpmg.hu |
E: ssvetankov@kpmg.ru |
Brazil |
India |
Singapore |
Mauricio Endo |
Santosh Kamath |
Satya Ramamurthy |
T: +55 113 940 8322 |
T: +91 226 134 9403 |
T: +65 6213 2060 |
E: mendo@kpmg.com.br |
E: skamath@kpmg.com |
E: sramamurthy@kpmg.com.sg |
Canada |
Israel |
South Korea |
Colin Earp |
Hillel Schuster |
Hyo-Jin Kim |
T: +1 416 777 8898 |
T: +972 3 684 8000 |
T: +82 22 1120 393 |
E: cearp@kpmg.ca |
E: hillelschuster@kpmg.com |
E: hkim68@kr.kpmg.com |
China |
Japan |
Spain |
Philip Ng |
Koichi Iguchi |
Ovidio Turrado |
T: +86 755 254 73308 |
T: +81 33 548 5384 |
T: +34 91 456 8240 |
E: philip.ng@kpmg.com |
E: koichi.iguchi@jp.kpmg.com |
E: oturrado@kpmg.es |
Czech Republic |
Mexico |
Sweden |
Pavel Kliment |
Ignacio Garcia de Presno |
Christoffer Sellberg |
T: +420222123573 |
T: +52 555 246 8300 |
T: +46 31 61 4724 |
E: pkliment@kpmg.cz |
E: igarciadepresno@kpmg.com.mx |
E: christoffer.sellberg@kpmg.se |
Finland |
The Netherlands |
United Arab Emirates |
Henry Beniard |
Loek Kramer |
Ravi Suri |
T: +358207603000 |
T: +31 306 58 2405 |
T: +97 14 403 0443 |
E: henry.beniard@kpmg.fi |
E: kramer.loek@kpmg.nl |
E: ravisuri@kpmg.com |
France |
New Zealand |
United Kingdom |
Laurent des Places |
Istvan Csorogi |
Sarah Owen-Vandersluis |
T: +33 (1) 55 68 68 77 |
T: +6448164868 |
T: +44 207 311 3089 |
E: ldesplaces@kpmg.fr |
E: istvancsorogi@kpmg.co.nz |
E: sarah.ov@kpmg.co.uk |
kpmg.com/socialmedia
Not for distribution in the US.
The information contained herein is of a general nature and is not intended to address the circumstances of any particular individual or entity. Although we endeavor to provide accurate and timely information, there can be no guarantee that such information is accurate as of the date it is received or that it will continue to be accurate in the future. No one should act on such information without appropriate professional advice after a thorough examination of the particular situation.
© 2019 KPMG International Cooperative (“KPMG International”), a Swiss entity. Member firms of the KPMG network of independent firms are affiliated with KPMG International. KPMG International provides no client services. No member firm has any authority to obligate or bind KPMG International or any other member firm vis-à-vis third parties, nor does KPMG International have any such authority to obligate or bind any member firm. All rights reserved.
The KPMG name and logo are registered trademarks or trademarks of KPMG International.
Designed by Evalueserve.
Publication name: 2019 Autonomous Vehicles Readiness Index | Publication number: 136024-G | Publication date: March 2019

vk.com/id446425943
Global downstream outlook to 2035
H1 2019

|
Market outlook summary |
Current market trends |
Demand outlook |
Refining outlook |
Prices and margins outlook |
2 |
|
vk.com/id446425943 |
|
|
|
|
|
|
|
|
|
|
|
|
Market outlook summary
Overall
After a strong 2017, the global refining market in 2018 saw strong capacity additions but slow demand growth and declining margins— trends that we expect to continue to see moving forward. As more global capacity is added, we’ll also see utilization rates slip as a result.
Looking ahead, Europe’s utilization rates should dip below 70% by 2023 due to declining demand and the region’s sensitivity to capacity additions in Africa, Asia, and the Middle East.
Asia’s outlook is strong for the long term, but it will not be immune to sliding utilization rates. We expect its utilization levels to dip to 73% by 2023—almost as low as Europe’s—but it should then steadily increase to the lowto mid-80s after 2030.
We’ll see the strongest market conditions in the US Gulf Coast (USGC), where utilization rates will remain in the mid-80s thanks to refinery complexity, access to cheap natural gas, crude pricing at export parity, and strong demand for product exports.

|
Market outlook summary |
Current market trends |
Demand outlook |
Refining outlook |
Prices and margins outlook |
3 |
|
vk.com/id446425943 |
|
|
|
|
|
|
|
|
|
|
|
|
Supply and demand
Global crude supply is growing at 0.2% per annum (p.a.) to 2035, with strong production increases in the Americas and Middle East offsetting falling production in Asia and Africa. However, the higher supply of non- crude-based material, particularly from biofuels, will reduce the need for refining, and we’ll see demand growth slow from the current 1.2% p.a. to 0.5% p.a. until 2035.
The decline in demand will mostly be driven by road transport and power, with the biggest impact seen on diesel. Meanwhile, refining distillation capacity will grow by 1.2% p.a. in the next four to five years, adding almost 7 million barrels per day (MMb/d) of capacity, with most of the capacity additions in Asia and the Middle East.

|
Market outlook summary |
Current market trends |
Demand outlook |
Refining outlook |
Prices and margins outlook |
4 |
|
vk.com/id446425943 |
|
|
|
|
|
|
|
|
|
|
|
|
Balances and flows
Continued capacity additions will lead to overcapacity in the near term, and we’ll see lower utilization in Asia and Europe through 2024 as a result.
As far as changing product flows in the future, the majority will take place in Africa, South Asia, and Southeast Asia—fast-growing regions that will rely on imports to meet future product demand. Asia’s crude slate will also become lighter as the region imports more light tight oil and replaces falling Russian and Asian crude supply with US and Middle Eastern crudes.

|
Market outlook summary |
Current market trends |
Demand outlook |
Refining outlook |
Prices and margins outlook |
5 |
|
vk.com/id446425943 |
|
|
|
|
|
|
|
|
|
|
|
|
Prices and margins
In the future, MARPOL will be a key player as far as prices and refinery margins go, causing margins to jump initially before tightening markets lead margins to begin to fall.
MARPOL will also increase the light/heavy and diesel gasoline differentials by USD13-17/bbl and USD3-8/bbl, respectively, in 2020, but we expect to see them fall back to historical levels by 2022 as the resid market tightens again and results in a balanced diesel gasoline market.
In addition to products, MARPOL will also push sweet crudes to be priced higher relative to sour crudes from 2020 to 2022; after 2022, these premiums and discounts will revert back to historical levels.
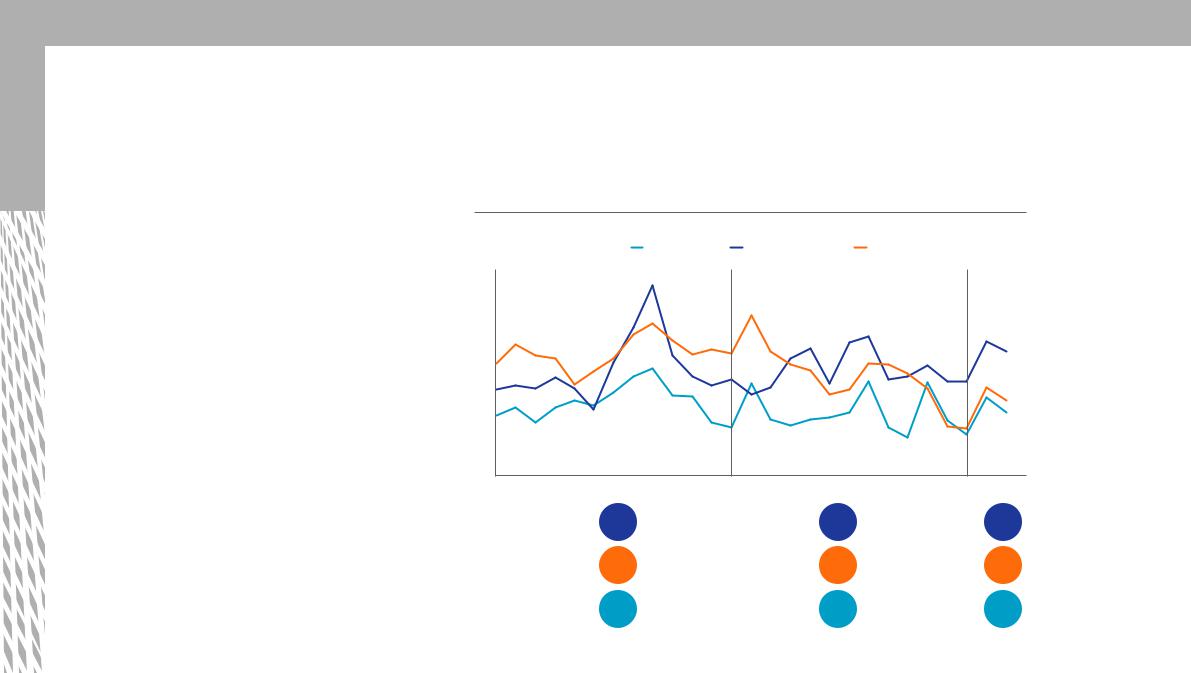
Market outlook summary |
Current market trends |
Demand outlook |
Refining outlook |
Prices and margins outlook |
6 |
vk.com/id446425943 |
|
|
|
|
|
|
|
|
|
|
|
After a strong 2017, refining markets weakened slightly in 2018 in Europe and Asia
•After a relatively strong year in 2017, cracking margins fell on average by USD1.18/bbl and USD0.77/bbl in Asia and Europe, respectively
•The drop in margins came mostly in the second half of 2018, with Asia continuing to see falling margins into early 2019
•European margins remained flat for the majority of 2018 with a slow decline toward the end of the year
•The USGC also saw flat margins on average in 2018, and a slight increase in the first quarter of 2019
Refining margins across hubs: variable cash
USD/barrel |
NWE FCCV1 |
USGC Cracking2 |
Singapore Cracking (RCC)3 |
13 |
|
|
|
12 |
|
|
|
11 |
|
|
|
10 |
|
|
|
9 |
|
|
|
8 |
|
|
|
7 |
|
|
|
6 |
|
|
|
5 |
|
|
|
4 |
|
|
|
3 |
|
|
|
2 |
|
|
|
1 |
|
|
|
0 |
2017 |
2018 |
Q1 2019 |
|
|||
|
6.94 |
6.93 |
7.65 |
Margin |
|
|
|
annual |
7.99 |
6.81 |
4.59 |
average |
|
|
|
|
4.86 |
4.09 |
3.96 |
1 Brent delivered to Northwest Europe; Fluid cataltyic cracking + visbreaking (FCCV)
2 WTI Magellan East Houston (MEH) in US Gulf Coast
3 Dubai delivered to Singapore; Residual catalytic cracking (RCC)
Source: Energy Insights – OilDesk Model (June 2019), Platts
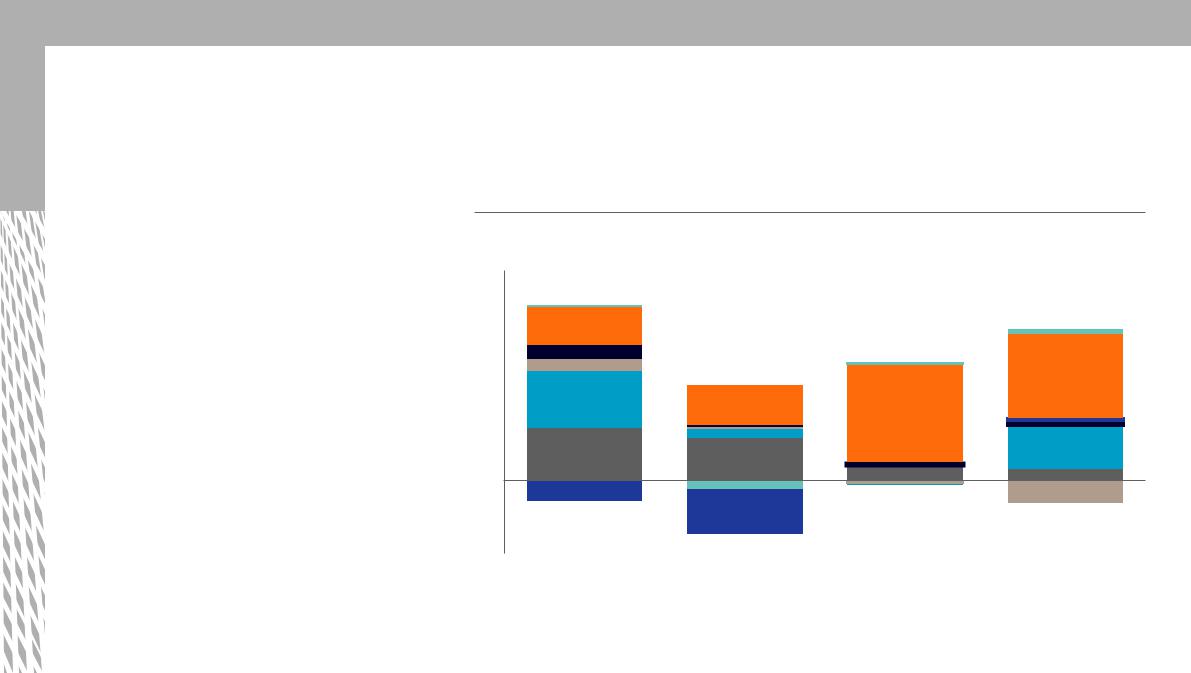
Market outlook summary |
Current market trends |
Demand outlook |
Refining outlook |
Prices and margins outlook |
7 |
vk.com/id446425943 |
|
|
|
|
|
|
|
|
|
|
|
Global refinery capacity additions were strong in 2018, especially in Asia and the Middle East
•Net distillation capacity growth was strong in 2018, adding 950 Kb/d of capacity versus 835 Kb/d in 2017
•Asia was the largest contributor of capacity growth with over 600 Kb/d added in 2018, largely from expansion projects in China and India and Vietnam’s new Nghi Son 200 Kb/d refinery
•The Middle East had over 300 Kb/d of additions, most of which came from two 120-Kb/d condensate splitters at Iran’s Bandar Abbas refinery
•Distillation capacity in Latin America decreased by 156 Kb/d with the closure of the Point a Pierre refinery in Trinidad
Change in refining distillation capacity1
MMb/d |
|
Africa |
|
Asia |
|
Europe |
|
FSU |
|
Middle East |
|
North America |
|
Latin America |
|
|
|
|
|
|
|
||||||||
|
|
|
|
|
|
|
||||||||
1.5 |
|
|
|
|
|
|
|
|
|
|
|
|
|
|
1.0
0.5
0
-0.5
2015 |
2016 |
2017 |
20182 |
1 Based on date of capacity start up 2 Does not include partial capacity additions from Aliaga, Hengli, and RAPID assumed to come online partially in 2019, representing 325 Kb/d in Asia and 186 Kb/d in Europe
Source: McKinsey Refining Capacity Database
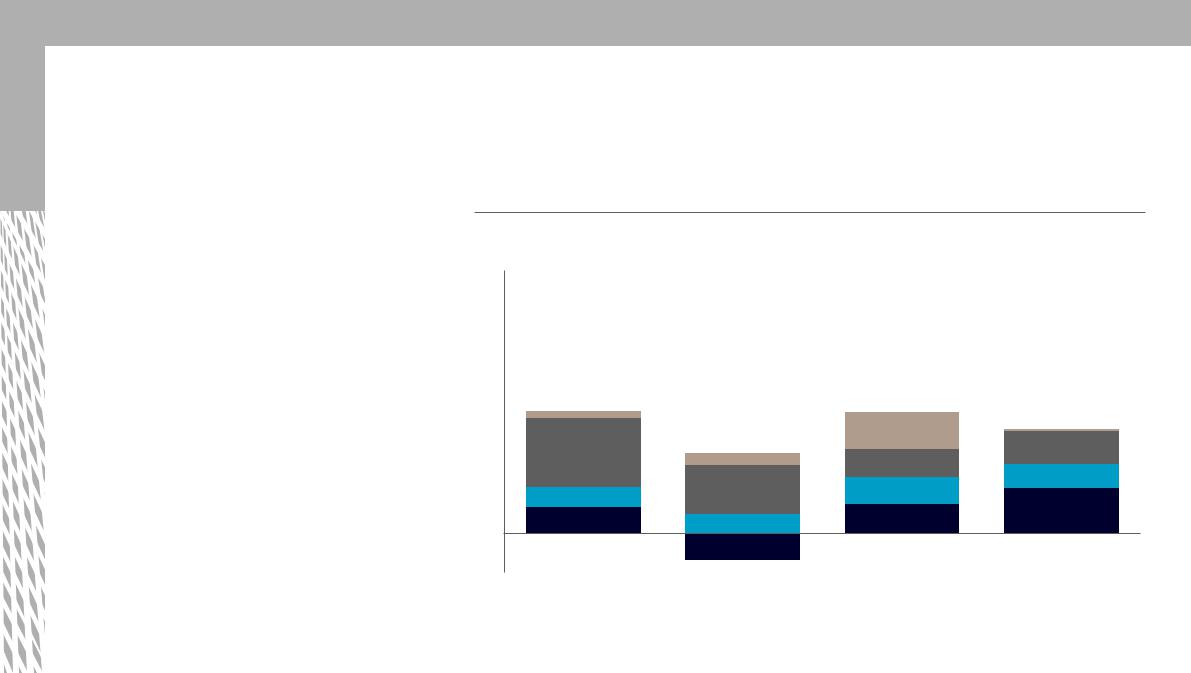
Market outlook summary |
Current market trends |
Demand outlook |
Refining outlook |
Prices and margins outlook |
8 |
vk.com/id446425943 |
|
|
|
|
|
|
|
|
|
|
|
Globally, middle distillate1 demand growth was stronger than gasoline range products in 2018
•Global light product demand growth was ~200 Kb/d lower in 2018, almost entirely a result of naphtha growth falling to ~0
•Diesel/gasoil demand grew the strongest, with 40% growth from both North America and Asia (largely driven by India)
•Jet/kero demand growth was in line with history, although ~40 Kb/d lower than in 2017, with most of the growth slowdown originating in North America
•Gasoline growth remained strong in 2018, with 25% of growth resulting from Europe’s push toward gasoline-powered cars versus diesel
•Naphtha demand growth was marginal in 2018, mostly related to the relative pricing to propane as a chemical feedstock
Change in global light product demand, Year-over-year change
MMb/d |
|
Naphtha |
|
Gasoline |
|
Jet/Kero |
|
Diesel/Gasoil |
|
|
|
|
|||||
|
|
|
|
3.0
2.8
2.6
2.4
2.2
2.0
1.8
1.6
1.4
1.2
1.0
0.8
0.6
0.4
0.2
0 -0.2 -0.4
2015 |
2016 |
2017 |
2018 |
1 Includes jet/kero and diesel/gasoil
Source: Energy Insights – Global Downstream Model (May 2019)
Market outlook summary |
Current market trends |
Demand outlook |
Refining outlook |
Prices and margins outlook |
9 |
vk.com/id446425943 |
|
|
|
|
|
|
|
|
|
|
|
Global oil demand is projected to slow down and peak by the early 2030s, sooner than in most other sources
•Oil demand growth is expected to slow to 0.5% p.a. from 2018 to 2035 in our latest reference case. This represents a significant slowdown compared to the historical average of +1% p.a. over the last three decades
•Our outlook is within the range of other forecasts in the near term to 2030
•In the long term, we forecast an earlier peak in oil demand by the early 2030s compared to other forecasts. This is primarily due to a more bearish outlook for road transport demand due to growing penetration of electric vehicles
Global oil demand1 |
|
|
CAGR |
Indexed to 100 |
Reference case forecasts |
Sustainability cases |
2018-35 |
125 |
|
ExxonMobil |
0.8% |
120 |
|
||
|
Equinor Reform |
0.7% |
|
115 |
|
||
|
|
|
|
110 |
|
IEA New Policies |
0.6% |
|
|
|
|
105 |
|
Global Downstream Model 20181 |
0.6% |
|
|
|
|
100 |
|
Global Downstream Model 20191 |
0.5% |
|
|
|
|
95 |
|
BP Evolving Transition |
0.4% |
|
|
|
|
90 |
|
Shell – Sky |
0.1% |
|
|
|
|
85 |
|
BP Rapid Transition |
-0.4% |
|
|
|
|
80 |
|
IEA Sustainable Development |
-0.7% |
|
|
|
|
|
|
Equinor Renewal |
-0.6% |
7516 17 18 19 20 21 22 23 24 25 26 27 28 29 30 31 32 33 34 35 |
|
||
1 The Global Downstream Model outlooks are based on our Global Energy Perspective Reference Case. Definition of products (e.g., ethane, refinery fuel) may not be consistent across all other forecasts. Source: Energy Insights – Global Downstream Model (May 2019), BP Global Energy Outlook (Feb 2019), ExxonMobil Outlook for Energy (Feb 2018), IEA World Energy Outlook (Oct 2018), Equinor Energy Perspectives (May 2018), Shell Scenarios (Apr 2018)
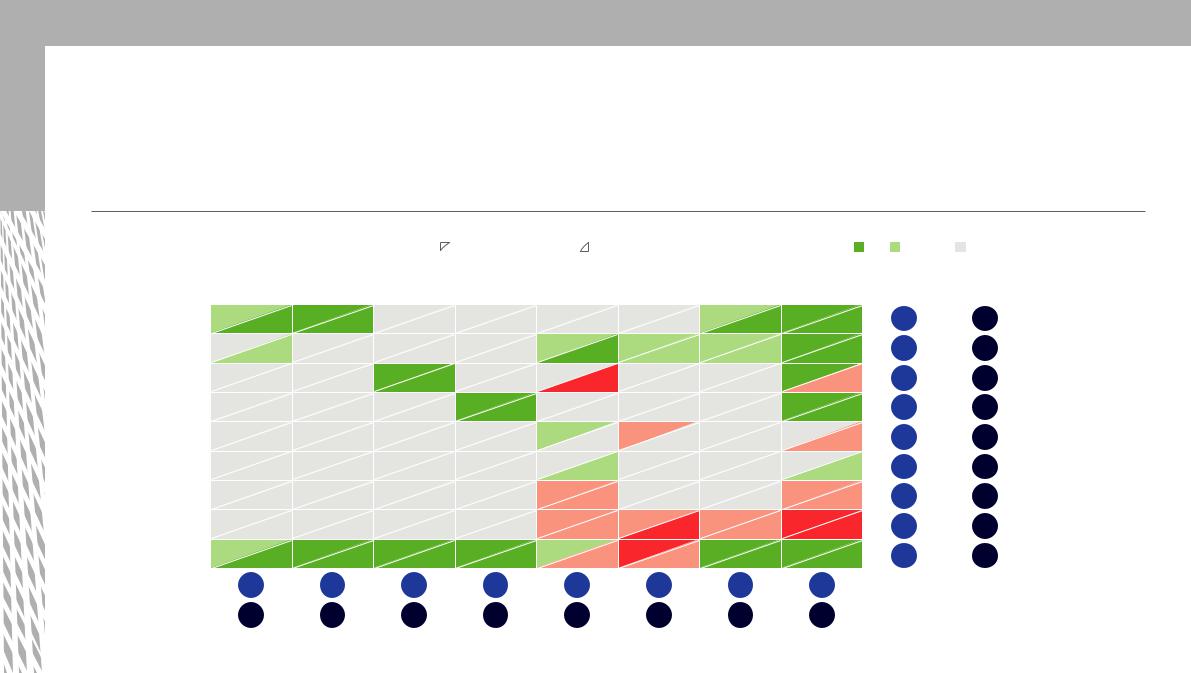
Market outlook summary |
Current market trends |
Demand outlook |
Refining outlook |
Prices and margins outlook |
10 |
vk.com/id446425943 |
|
|
|
|
|
|
|
|
|
|
|
Chemicals and aviation are the main sources of long-term demand growth, while road transport and power have the biggest decline
Global liquids demand 2018-35 |
|
|
|
|
|
|
|
|
|
|
|
|
MMb/d |
|
|
|
2018-25 (short term) |
2018-35 (long term) |
2018-35 delta MMb/d |
>1 |
0.1 to 1 |
-0.1 to 0.1 |
|||
|
|
|
Motor |
|
|
|
|
|
|
|
CAGR |
Total 2018 |
|
LPG1 |
Naphtha |
gasoline |
Jet/Kero |
Gas/Diesel |
Fuel oil |
Other2 |
Total |
(2018-35) |
volume |
||
Chemicals |
|
|
|
|
|
|
|
|
|
|
2.4% |
13.2 |
Other industries |
|
|
|
|
|
|
|
|
|
|
1.0% |
13.9 |
Road transport |
|
|
|
|
|
|
|
|
|
|
-0.1% |
44.2 |
Aviation |
|
|
|
|
|
|
|
|
|
|
2.3% |
7.0 |
Marine |
|
|
|
|
|
|
|
|
|
|
-0.3% |
5.1 |
Other transport |
|
|
|
|
|
|
|
|
|
|
1.4% |
1.8 |
Buildings |
|
|
|
|
|
|
|
|
|
|
-0.5% |
7.7 |
Power |
|
|
|
|
|
|
|
|
|
|
-5.3% |
3.7 |
Total |
|
|
|
|
|
|
|
|
|
|
0.5% |
95.8 |
CAGR (2018-35) |
0.7% |
2.2% |
0.2% |
2.0% |
-0.3% |
|
-0.7% |
1.3% |
0.5% |
|
|
|
Total 2018 volume |
9.3 |
7.1 |
26.0 |
7.8 |
28.6 |
|
7.1 |
9.9 |
95.8 |
|
|
|
 -0.1 to -1
  <-1
<-1
1Liquefied petroleum gas
2Includes reformate BTX (feedstock into aromatics unit at refinery), bitumen, lubes, waxes, petcoke, and other oil products Source: Energy Insights – Global Downstream Model (May 2019)
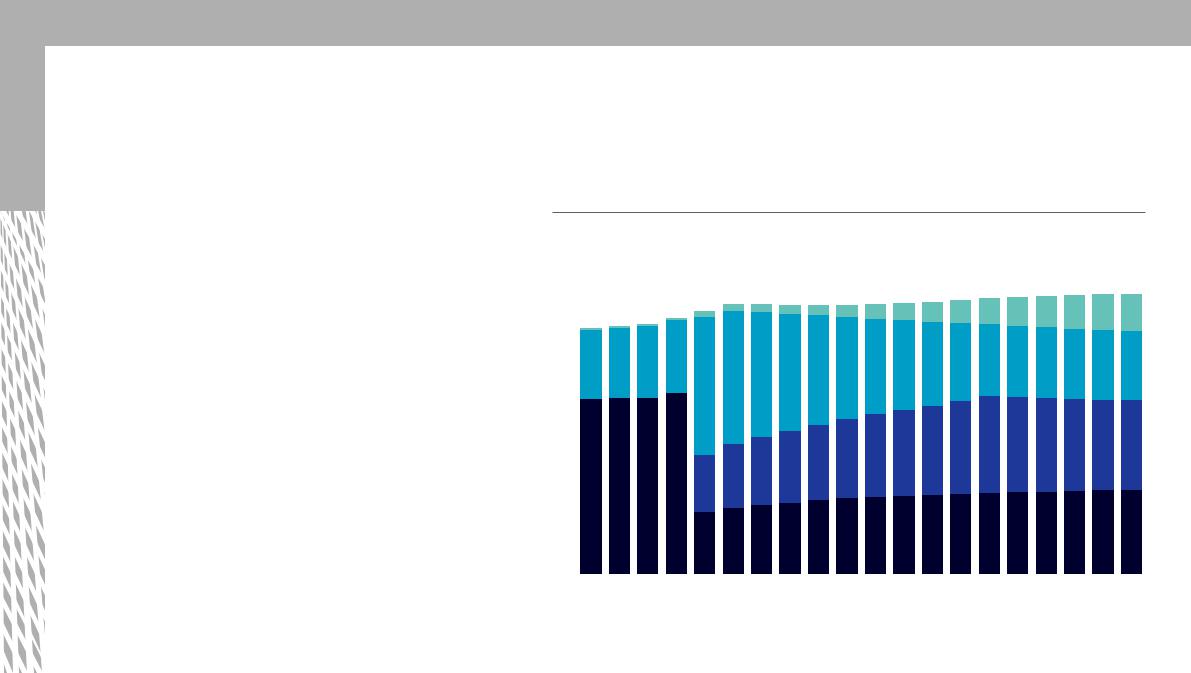
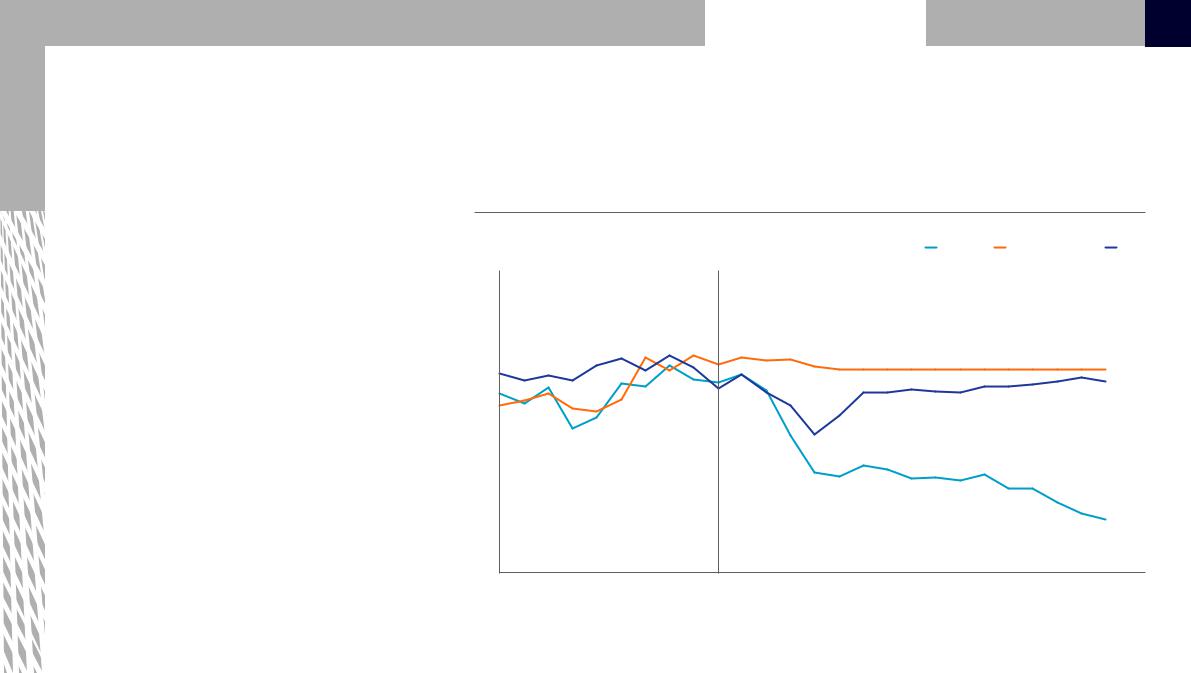
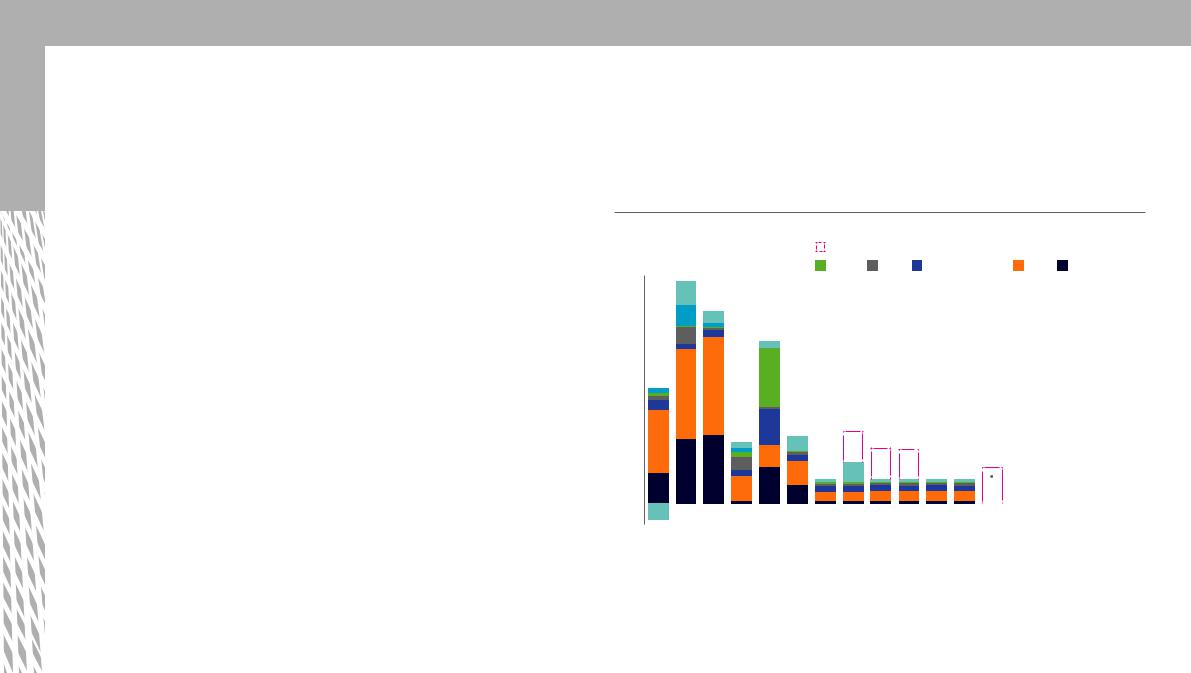
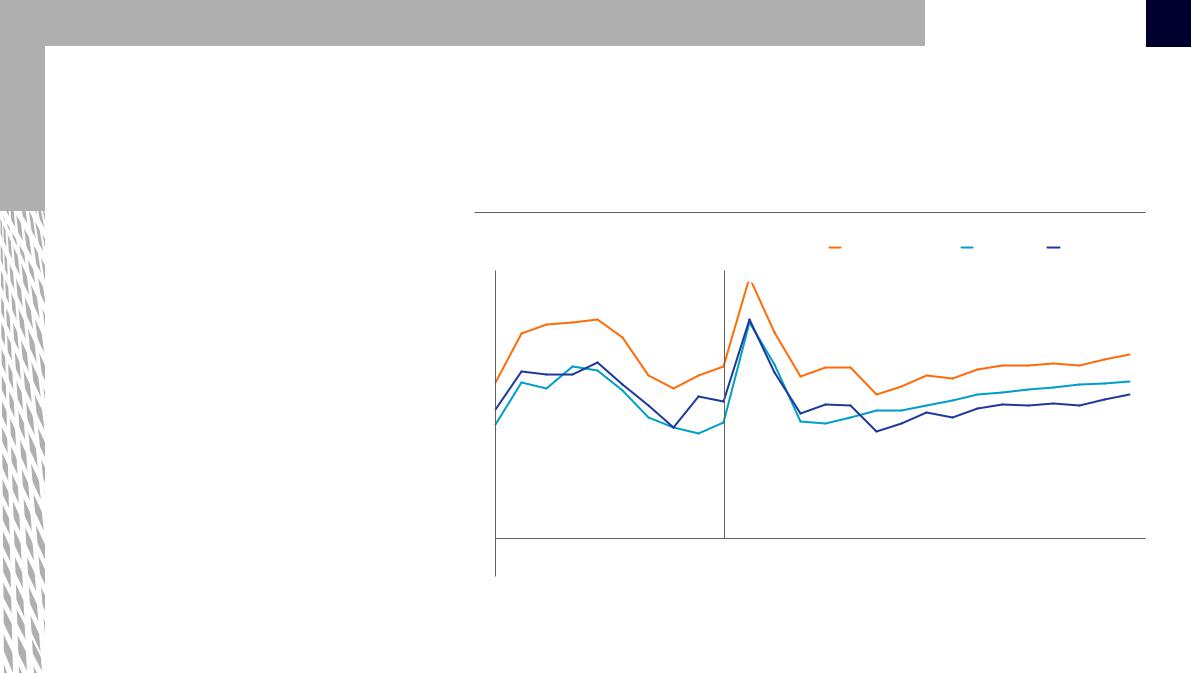
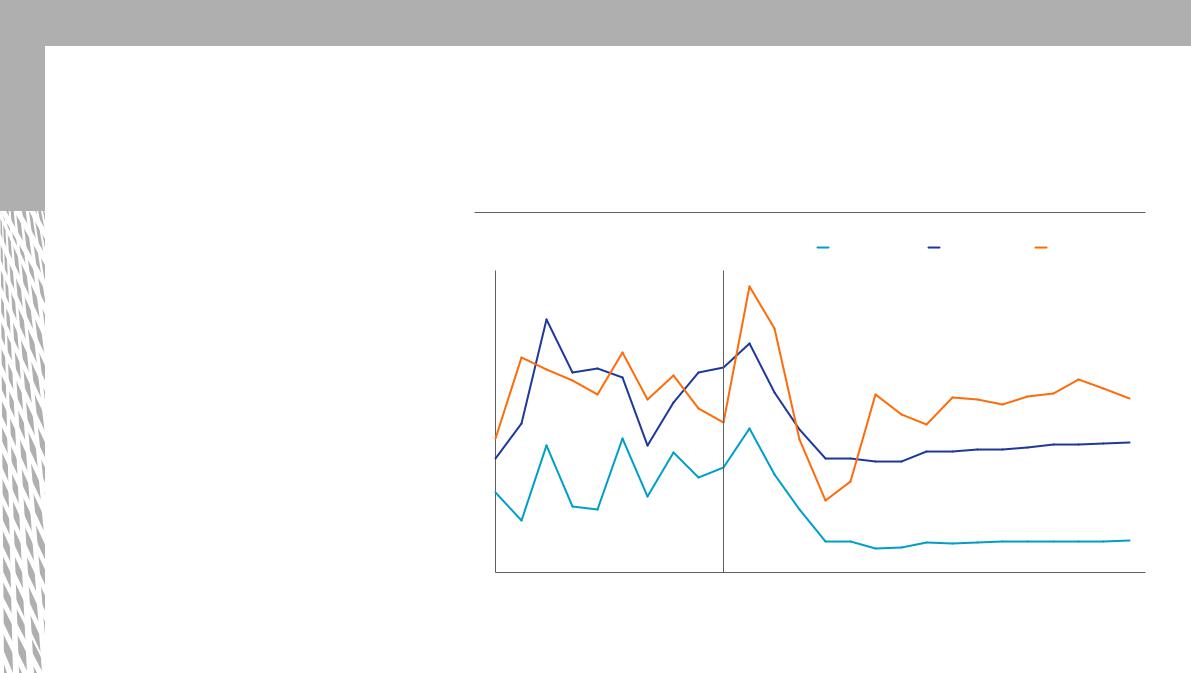


vk.com/id446425943
Methodology
Market sizing & forecasts
Key global trends
Newzoo’s Gamer SegmentationTM
Top 35 companies
Global
games
market report
2019


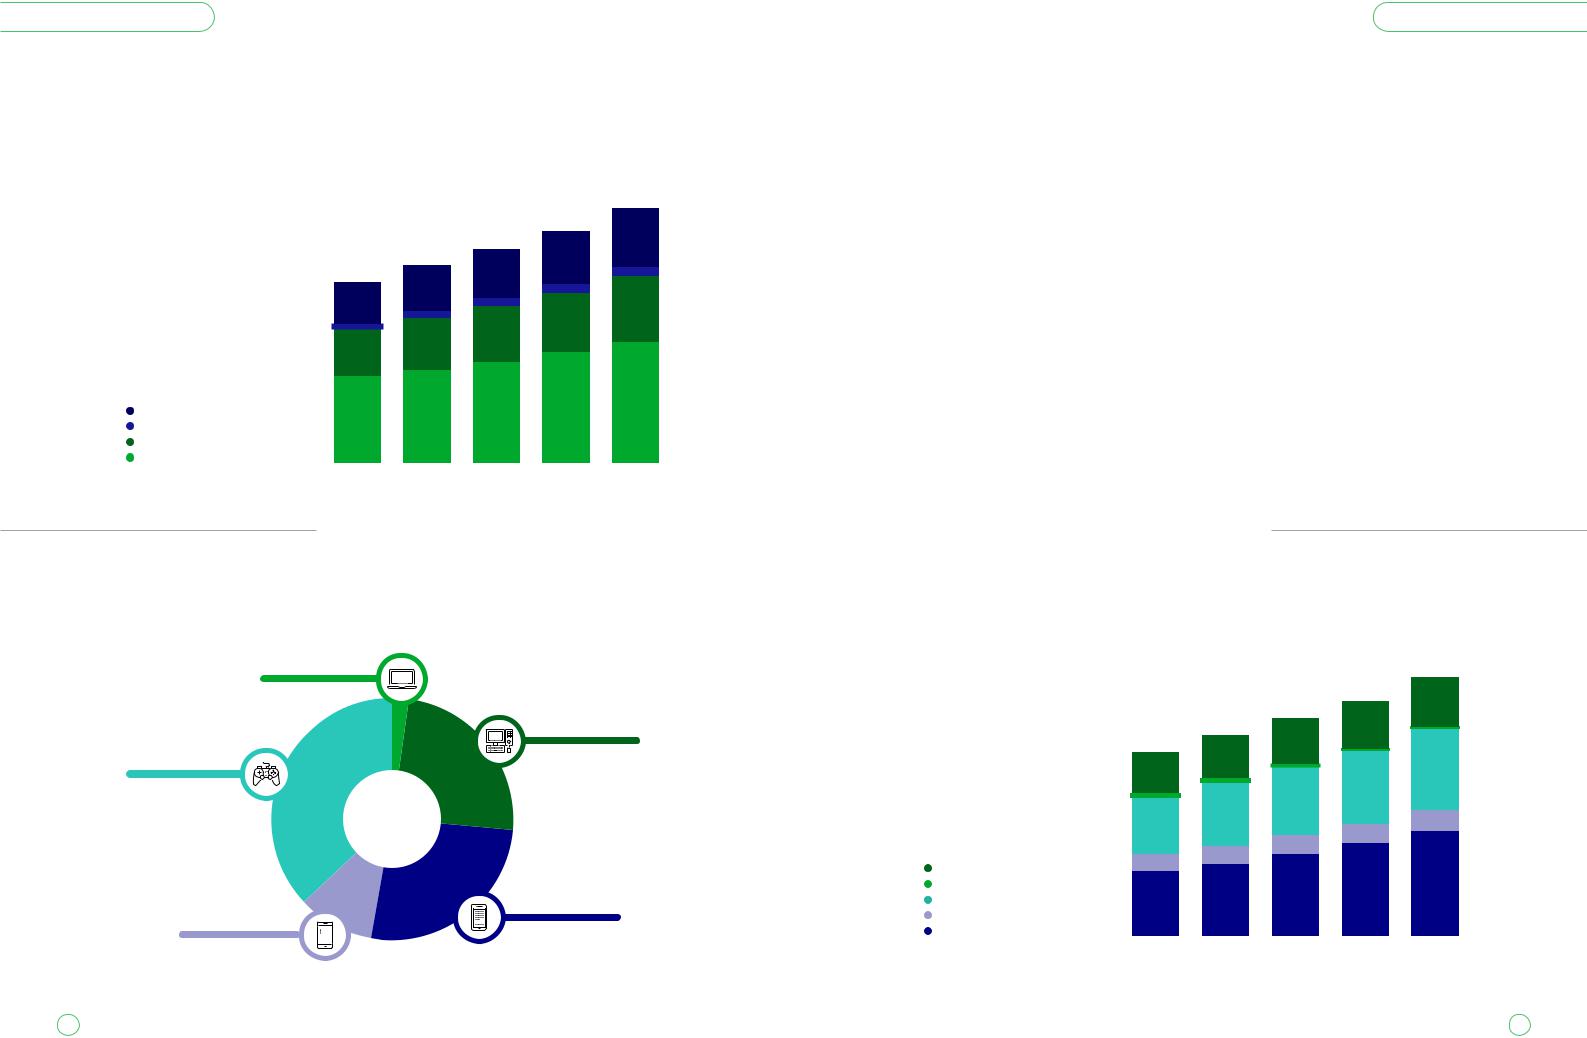


vk.com/id446425943
Capital Markets in 2030
The future of equity capital markets
Written by


vk.com/id446425943
Contents
Executive summary |
4 |
Then and now: Are the markets on trend? |
5 |
Which sectors and where? |
6 |
Which markets attract foreign issuers? |
10 |
Looking to 2030 |
12 |
Which countries will lead capital raising in 2030? |
12 |
What drives the choice of exchange? |
15 |
What is holding back EM exchanges? |
16 |
Are public equity markets under threat? |
18 |
Private markets: To rival or to complement? |
19 |
Conclusion |
21 |
About this report |
22 |


 Financial
  Technology
  Other
Other


vk.com/id446425943
www.pwc.com
This content is for general information purposes only, and should not be used as a substitute for consultation with professional advisors.
© 2019 PricewaterhouseCoopers LLP. All rights reserved. PwC refers to the UK member firm, and may sometimes refer to the PwC network. Each member firm is a separate legal entity. Please see www.pwc.com/structure for further details.
The Design Group 33234 03/19
vk.com/id446425943
2018 Wind Technologies Market Report
