

- •Foreword
- •Milestones
- •Executive summary
- •National Profiles
- •The road ahead
- •Preparation and Authorship
- •Acknowledgments
- •List of Acronyms
- •Executive Summary
- •Table of Contents
- •List of Figures
- •List of Tables
- •1 Introduction
- •2 Installation Trends
- •3 Industry Trends
- •4 Technology Trends
- •5 Performance Trends
- •6 Cost Trends
- •7 Wind Power Price Trends
- •8 Policy and Market Drivers
- •9 Future Outlook
- •References
- •Appendix: Sources of Data Presented in this Report

vk.com/id446425943
2018 Wind Technologies Market Report
8 Policy and Market Drivers
The federal production tax credit remains one of the core motivators for wind power deployment
Various policies at both the federal and state levels, as well as federal investments in wind energy research and development (R&D), have contributed to the expansion of the wind power market in the United States. At the federal level, the most impactful policy incentives in recent years have been the PTC (or, if elected, the ITC) and accelerated tax depreciation.
Initially established in 1994 (via the Energy Policy Act of 1992—see Table 4), the PTC provides a 10-year, inflation-adjusted credit that stood at $24/MWh in 2018. The historical impact of the PTC on the wind industry is illustrated by the pronounced lulls in wind additions in the years (2000, 2002, 2004, 2013) during which the PTC lapsed, as well as by the increased activity often seen during the year in which the PTC is otherwise scheduled to expire (see Figure 2).
In December 2015, via the Consolidated Appropriations Act of 2016 (see Table 4), Congress passed a fiveyear extension of the PTC (as well as the ITC, which wind projects can elect to receive in lieu of the PTC). To qualify, projects must begin construction before January 1, 2020. Moreover, in 2016 the IRS issued Notice 2016-31, which allows four years for project completion after the start of construction, without the burden of proving continuous construction. This guidance lengthened the “safe harbor” completion period from the previous term of two years.
In extending the PTC, Congress established a progressive reduction in the value of the credit for projects starting construction after 2016. Specifically, the PTC phases down in 20%-per-year increments for projects starting construction in 2017 (80% PTC value), 2018 (60%), and 2019 (40%). Under the current schedule, projects that commence construction in 2020 and after will no longer receive the PTC.
Developers reportedly qualified a significant amount of new wind turbine capacity for the full PTC by starting construction (as per the IRS safe harbor guidelines) prior to the end of 2016. Chadbourne & Parke (2017) reported two such estimates of PTC-qualified capacity—30–58 GW and 40–70 GW—while consultant MAKE pegged the number at 45 GW (Recharge 2017). Notwithstanding this large volume of turbines that will be deployed through 2020 (within the four-year safe harbor window), an additional 10 GW of wind capacity was reportedly qualified for 80% of the PTC by the end of 2017, with yet another 6.6 GW qualified in 2018 for the 60% PTC (Froese 2019).
A second form of federal tax support for wind is accelerated tax depreciation, which historically has enabled wind project owners to depreciate the vast majority of their investments over a fiveto six-year period for tax purposes. Even shorter “bonus depreciation” schedules have been periodically available, since 2008, and the December 2017 tax reform legislation allows both new and used equipment to be fully expensed (i.e., equivalent to 100% bonus depreciation) in the year of purchase; historically, however, the wind industry has not opted to fully utilize such bonus depreciation measures.
The continued near-term availability of federal tax incentives underpins recent low-priced power purchase agreements for wind energy, and is a significant contributor to the ongoing surge in wind capacity additions. As discussed earlier, the tax reform legislation passed in December 2017 seems unlikely to substantially impact wind development during the current PTC cycle. The PTC phase-out, on the other hand, imposes risks to the industry’s competitiveness in the midto long-term.
70

vk.com/id446425943
2018 Wind Technologies Market Report
Table 4. History of Production Tax Credit Extensions
Legislation
Energy Policy Act of 1992
Ticket to Work and Work Incentives Improvement Act of 1999
Job Creation and Worker
Assistance Act
The Working Families Tax
Relief Act
Energy Policy Act of 2005
Tax Relief and Healthcare Act of 2006
Emergency Economic
Stabilization Act of 2008
The American Recovery and
Reinvestment Act of 2009
American Taxpayer Relief Act of 2012
Tax Increase Prevention Act of 2014
Consolidated Appropriations
Act of 2016
|
|
|
|
|
|
|
|
Effective PTC |
|
|
Date |
|
|
Start of |
|
End of |
|
Planning Window |
|
|
Enacted |
|
|
PTC Window |
|
PTC Window |
|
(considering lapses and early |
|
|
|
|
|
|
|
|
|
extensions) |
|
|
|
|
|
|
|
|
|
||
10/24/1992 |
|
1/1/1994 |
6/30/1999 |
|
80 months |
||||
|
>5-month lapse before expired PTC was extended |
|
|
|
|||||
|
12/19/1999 |
|
|
7/1/1999 |
|
12/31/2001 |
|
24 months |
|
|
|
|
|
|
|
|
|
|
|
|
>2-month lapse before expired PTC was extended |
|
|
|
|||||
3/9/2002 1/1/2002 12/31/2003
>9-month lapse before expired PTC was extended
10/4/2004 1/1/2004 12/31/2005
8/8/2005 1/1/2006 12/31/2007
12/20/2006 1/1/2008 12/31/2008
10/3/2008 1/1/2009 12/31/2009
2/17/2009 1/1/2010 12/31/2012
2-day lapse before expired PTC was extended
|
1/2/2013 |
|
1/1/2013 |
|
Start construction |
|
|
|
|||||
|
|
|
by 12/31/2013 |
|
||
|
|
|
|
|
|
>11-month lapse before expired PTC was extended
|
12/19/2014 |
|
1/1/2014 |
|
Start construction |
|
|
|
|||||
|
|
|
by 12/31/2014 |
|
||
|
|
|
|
|
|
>11-month lapse before expired PTC was extended
|
|
|
|
|
|
|
|
|
|
|
|
|
|
|
|
Start construction |
|
12/18/2015 |
1/1/2015 |
|
by 12/31/2017 |
|
|
|
|
|
|
Start construction |
|
|
|
|
|
by 12/31/2016 |
|
Start construction by 12/31/2018
Start construction by 12/31/2019
22 months
15 months
29 months
24 months
15 months
46 months
12 months (in which to start construction)
2 weeks (in which to start construction)
12 months to start construction and receive 100% PTC value
24 months to start construction and receive 80% PTC value
36 months to start construction and receive 60% PTC value
48 months to start construction and receive 40% PTC value
Notes: Although the table pertains only to PTC eligibility, the American Recovery and Reinvestment Act of 2009 enabled wind projects to elect a 30% investment tax credit (ITC) in lieu of the PTC starting in 2009. While it is rarely used, this ITC option has been included in all subsequent PTC extensions (and will follow the same phase-out schedule as the PTC, as noted in the table: from 30% to 24% to 18% to 12%). Section 1603 of the same law enabled wind projects to elect a 30% cash grant in lieu of either the 30% ITC or the PTC; this option was only available to wind projects that were placed in service from 2009 to 2012 (and that had started construction prior to the end of 2011), and was widely used during that period. Finally, beginning with the American Taxpayer Relief Act of 2012, which extended the PTC window through 2013, the traditional “placed in service” deadline was changed to a more-lenient “construction start” deadline, which has persisted in the two subsequent extensions. The IRS initially issued safe harbor guidelines providing projects that meet the applicable construction start deadline up to two full years to be placed in service (without having to prove continuous effort) in order to qualify for the PTC. In May 2016, the IRS lengthened this safe harbor window to four full years.
Source: Berkeley Lab
71
vk.com/id446425943
2018 Wind Technologies Market Report
State policies help direct the location and amount of wind power development, but wind power growth is outpacing state targets
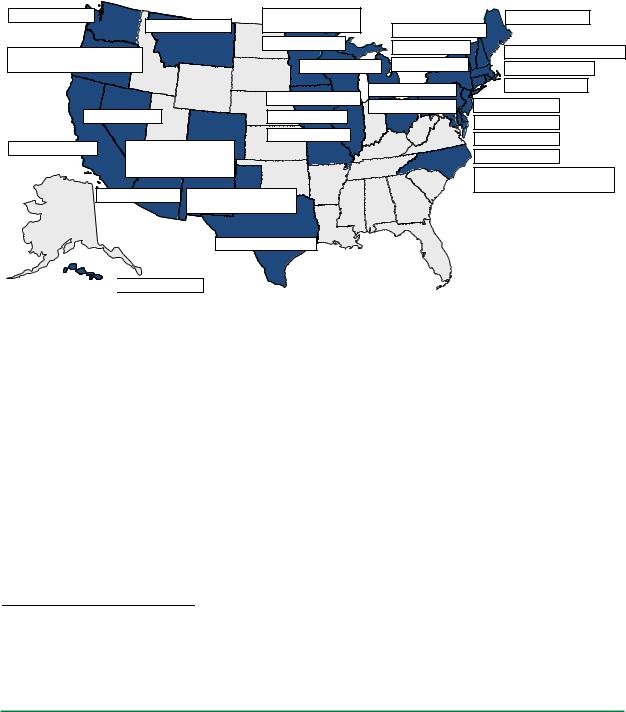
As of May 2019, mandatory RPS programs existed in 29 states and Washington, D.C. (Figure 61).73,74 In recent years, a sizeable contingent of states have increased their RPS targets, in many cases to levels ranging from 50% to 100% of retail electricity sales. Since the beginning of 2018 and through May 2019, six states (California, Connecticut, Massachusetts, New Jersey, New Mexico, and Nevada) and Washington, D.C. have enacted legislation increasing their RPS targets. In addition to the RPS policies shown in Figure 61, several states—including California, New Mexico, and Washington—have also adopted 100% zero-carbon electricity standards or goals.
WA: 15% by 2020 |
MT: 15% by 2015 |
MN: 26.5% by 2025 |
|
|
ME: 40% by 2017 |
|
|
Xcel: 31.5% by 2020 |
|
NH: 25.2% by 2025 |
|||
|
|
WI: 10% by 2015 |
|
|||
OR: 50% by 2040 (large IOUs) |
|
VT: 75% by 2032 |
MA: 41.1% by 2030 +1%/yr |
|||
|
|
|||||
|
|
NY: 50% by 2030 |
||||
5-25% by 2025 (other utilities) |
MI: 15% by 2021 |
RI: 38.5% by 2035 |
||||
|
|
IA: 105 MW by 1999 |
PA: 18% by 2021 |
CT: 44% by 2030 |
||
|
|
|
||||
|
|
OH: 12.5% by 2026 |
NJ: 54.1% by 2031 |
|||
NV: 50% by 2030 |
IL: 25% by 2026 |
|||||
|
|
DE: 25% by 2026 |
||||
|
|
MO: 15% by 2021 |
|
|
||
CA: 60% by 2030 |
CO: 30% by 2020 (IOUs) |
|
|
DC: 100% by 2032 |
||
|
|
|
||||
|
|
|
MD: 25% by 2020 |
|||
|
20% by 2020 (co-ops) |
|
|
|
||
|
10% by 2020 (munis) |
|
|
|
NC: 12.5% by 2021 (IOUs) |
|
|
|
|
|
|
||
|
2025 NM: 80% by 2040 (IOUs) |
|
|
10% by 2018 (co-ops and munis) |
||
|
|
|
|
|||
|
80% by 2050 (co-ops) |
|
|
|
||
|
TX: 5,880 MW by 2015 |
|
|
|
||


 HI: 100% by 2045
Notes: The figure does not include mandatory RPS policies established in U.S. territories or non-binding renewable energy goals adopted in U.S. states and territories. Note also that many states have multiple sub-requirements or “tiers” within their RPS policies, though those details are not summarized in the figure.
Source: Berkeley Lab
Figure 61. State RPS policies as of May 2019
Of all wind power capacity built in the United States from 2000 through 2018, Berkeley Lab estimates that roughly 47% is delivering RECs to load-serving entities with RPS obligations. In recent years, however, the role of state RPS programs in driving incremental wind power growth has diminished, at least on a national basis; 19% of U.S. wind capacity additions in 2018 is estimated to serve RPS requirements. Outside of the wind-rich Interior region, however, RPS requirements continue to form a strong driver for wind growth, with 63% of 2018 wind capacity additions in those regions serving RPS demand.
In aggregate, existing state RPS policies will require 570 terawatt-hours of RPS-eligible electricity by 2030, at which point RPS requirements in most states will have reached their maximum percentage targets. Based on the mix and capacity factors of resources currently used or contracted for RPS compliance, this equates to a
73The data and analysis reported in this section largely derives from Barbose (2018), with some updates to include 2019 data.
74Although not shown in Figure 55, mandatory RPS policies also exist in a number of U.S. territories, and non-binding renewable energy goals exist in a number of U.S. states and territories.
72

vk.com/id446425943
2018 Wind Technologies Market Report
total of around 167 GW of RPS-eligible generation capacity needed to meet RPS demand in 2030.75 Of that total, Berkeley Lab estimates that existing state RPS programs will require roughly 60 GW of renewable capacity additions by 2030, relative to the installed base at year-end 2018.76 This equates to an average annual build-rate of roughly 5.0 GW per year, only a portion of which will be wind. By comparison, over the past decade, U.S. wind power capacity additions averaged 7.2 GW per year, and total U.S. renewable capacity additions averaged 13.1 GW per year.
In addition to state RPS policies, utility resource planning requirements—principally in Western and Midwestern states—have motivated wind power additions in recent years.77 So has voluntary customer demand for “green” power (O’Shaughnessy et al. 2018). State renewable energy funds provide support (both financial and technical) for wind power projects in some jurisdictions, as do a variety of state tax incentives.78 Finally, some states and regions have enacted carbon reduction policies that may help to support wind power development. For example, the Northeast’s Regional Greenhouse Gas Initiative (RGGI) cap-and-trade policy has been operational for a number of years,79 and California’s greenhouse gas cap-and-trade program commenced operation in 2012,80 although carbon pricing in these programs has generally been too low to drive significant wind energy growth.
System operators are implementing methods to accommodate increased penetrations of wind energy, but transmission and other barriers remain
Wind energy output is variable and often the areas with the greatest wind speeds are distant from electricity load centers. As a result, integration with the power system and provision of adequate transmission capacity are particularly important for wind energy. Concerns about, and solutions to, these issues impact the pace of wind power deployment. Worldwide experience in operating power systems with wind energy highlights the critical role of power system flexibility, defined as the characteristics of a power system that facilitate effective management of variability and uncertainty (IEA 2019).
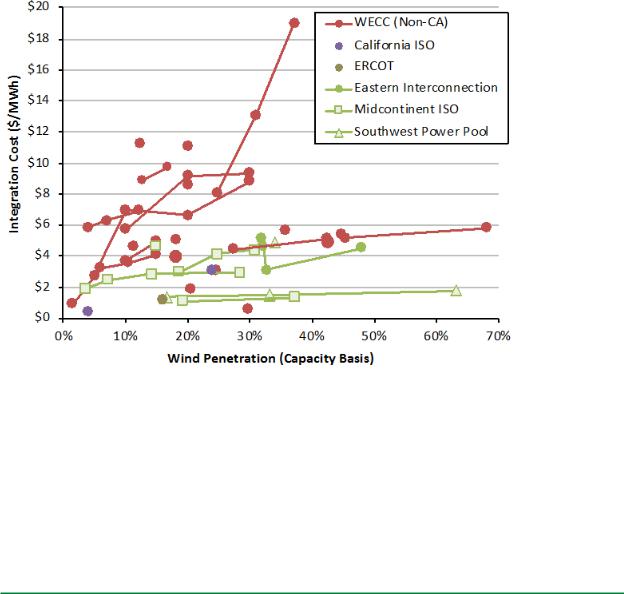
Figure 62 provides a selective listing of estimated wind integration costs at various levels of wind capacity penetration, from studies completed from 2003 through 2018, and grouped by region of the United States. While studies differ in how they define integration costs, the impacts assessed typically include any additional balancing costs associated with managing increased forecast errors and balancing reserves. These integration costs were not included in the earlier analysis of the market value of wind, which only accounted for the timevarying generation profile and the location of wind in the system. Some of the integration cost studies reported in Figure 62 also include an estimate of the difference in the value of wind with a time-varying profile compared to a more conventional dispatch profile, thereby potentially overlapping with the market value
75Berkeley Lab’s projections of new renewable capacity required to meet each state’s RPS requirements assume different combinations of renewable resource types for each RPS state. Those assumptions are based, in large part, on the actual mix of resources currently used or under contract for RPS compliance in each state or region.
76Berkeley Lab’s estimate of required renewable capacity additions is derived by first estimating incremental renewable generation needed to meet RPS requirements in 2030, relative to available supplies as of year-end 2018. These estimates are performed on a utility-by-utility basis for regulated states, and on a regional basis for restructured states within regional REC markets. These estimates account for the ability of load-serving entities to bank excess RECs for compliance in future years, including any specific banking limitations in individual states. From the incremental renewable generation needs for each state, the corresponding capacity additions are estimated based on the mix and capacity factors of resources currently used or contracted for RPS compliance. This analysis ignores several complexities that could result in either higher or lower incremental capacity needs, including retirements of existing renewable capacity (which would result in higher incremental RPS needs) and the possibility that resources currently serving renewable energy demand outside of RPS requirements (e.g., voluntary corporate procurement) might become available for RPS demand in the future (which would result in lower incremental RPS needs).
77See, e.g., https://resourceplanning.lbl.gov/login.php
78See, e.g., https://www.dsireusa.org/
79See, e.g., https://www.rggi.org/
80See, e.g., https://www.arb.ca.gov/cc/capandtrade/capandtrade.htm
73
vk.com/id446425943
2018 Wind Technologies Market Report
results presented earlier. The wind integration costs in these studies do not, however, include any costs associated with incremental transmission or the lower capacity contribution of wind, costs that are sometimes included in other integration cost estimates and that are partially captured in the market value estimates presented earlier (e.g., Heptonstall et al. 2017, BP 2018).
Integration costs estimated by the studies reviewed are near or below $5/MWh in all of the regions shown, except the non-California portion of the Western Electricity Coordinating Council (WECC), for wind power capacity penetrations up to and even exceeding 40% of the peak load of the system in which the power is delivered. Studies in the non-California portion of WECC are all focused on individual utilities that also act as balancing authorities, with responsibility to maintain a balance between supply and demand at all times. These studies tend to find higher integration costs, though, with limited exceptions, integration costs estimated by the studies reviewed are still below $10/MWh. Even in the non-California portion of WECC, however, some recent studies find relatively low integration costs. Overall, the results of these studies show that costs tend to increase with wind penetration levels, and tend in general to be lower when balancing areas are larger. Other variations in estimated costs are due, in part, to differences in methods, definitions of integration costs, power system and market characteristics, fuel price assumptions, wind output forecasting details, and the degree to which thermal plant cycling costs are included.
Notes: All studies categorized as WECC (Non-CA) are from individual utilities within WECC. Studies in California and ERCOT are all regional. Many of the studies in the Eastern Interconnect (inclusive of those in MISO and SPP) are regional, but some are from individual utilities. Studies that assessed multiple wind energy penetrations using a common methodology are depicted with connecting lines.
Sources: Additional details on the studies included in this review, and therefore represented in the figure, can be found in the data file associated with this report, downloadable from: https://emp.lbl.gov/wind-technologies-market-report
Figure 62. Integration costs at various levels of wind power capacity penetration
Beyond these studies, system operators and planners continue to make progress integrating wind into the power system with new records for instantaneous wind penetration hit each year, including SPP reaching an instantaneous wind penetration of over 70% in April 2019. SPP is developing products to better manage uncertainty in order to minimize manual adjustments by system operators, focusing on uncertainty in the 30minutes to 3-hour period (SPP 2019). MISO has found that incorporating the ability to dispatch wind resources
74
vk.com/id446425943
2018 Wind Technologies Market Report
in the MISO markets improves congestion management, almost entirely eliminating manual curtailment of wind (Potomac Economics 2018). MISO also found that it needed to better incorporate the technical characteristics of wind turbines into wind energy forecasts, however, as a severe cold snap demonstrated that wind turbines often shut down in especially low temperatures (Potomac Economics 2019a). Finally, system operators continue to examine issues arising from wind generators not naturally contributing inertia to the system and displacing synchronous generators that do (e.g., Matevosyan 2018). An increase in ancillary service requirements in ERCOT in 2018 was primarily due to the need to ensure adequate online inertia (Potomac Economics 2019b).
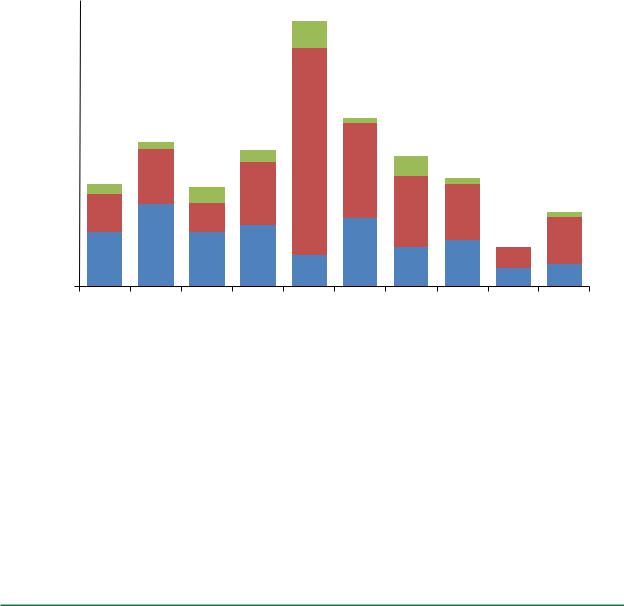
The best wind resources are often located far from load centers, and so transmission is also particularly important for wind power. Transmission additions were limited in 2018, with approximately 1,300 miles of transmission lines coming online (see Figure 63). The decline since the peak in 2013 is, in part, due to the completion of the Texas CREZ lines in 2013. As of March 2019, FERC (2019b) finds that another 6,300 miles of new transmission (or upgrades) are proposed to come online by April 2021, with 2,200 miles of those lines having a higher probability of completion.
Completed Transmission (miles/year)
5000 |
|
|
|
|
|
|
|
|
|
|
|
|
|
|
|
|
|
|
≥500 kV |
|
|
|
|
|
|
345 kV |
|
|
|
|
|
|
|
|
4000 |
|
|
|
|
≤ 230 kV |
|
|
|
|
|
|
||
|
|
|
|
|
||
|
|
|
|
|
|
|
|
|
|
|
|
|
|
3000 |
|
|
|
|
|
|
|
|
|
|
|
|
|
2000 |
|
|
|
|
|
|
|
|
|
|
|
|
|
1000 |
|
|
|
|
|
|
|
|
|
|
|
|
0
2009 |
2010 |
2011 |
2012 |
2013 |
2014 |
2015 |
2016 |
2017 |
2018 |
Source: FERC monthly infrastructure reports
Figure 63. Miles of transmission projects completed, by year and voltage
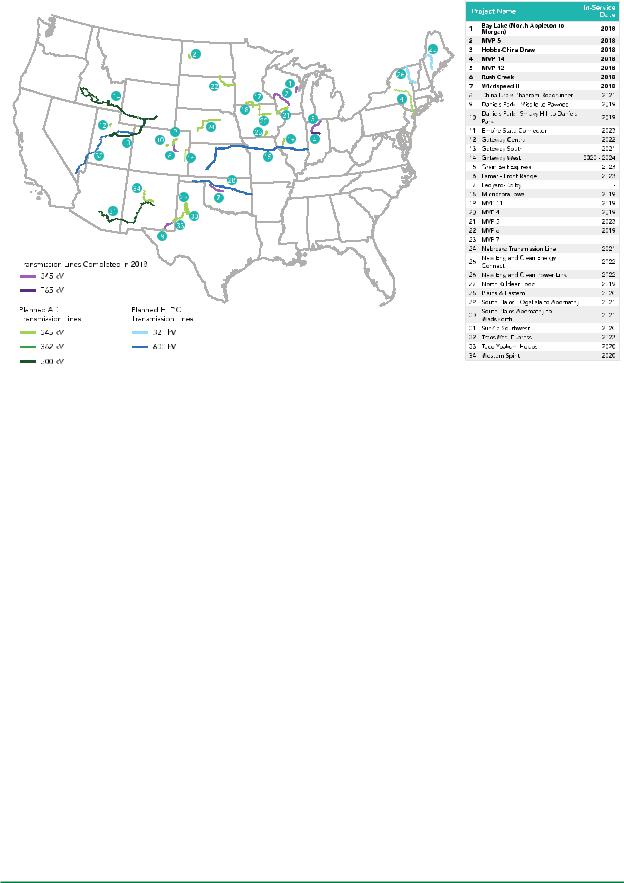
Eight transmission projects that may support wind energy were completed in 2018. In addition, AWEA (2019a) has identified a large number additional near-term transmission projects that, if completed, could support considerable amounts of wind capacity (see Figure 64).
75
vk.com/id446425943
2018 Wind Technologies Market Report
Source: AWEA (2019a)
Figure 64. Transmission line activity: completed in 2018, and planned for near future
76